
 ?Mathematical formulae have been encoded as MathML and are displayed in this HTML version using MathJax in order to improve their display. Uncheck the box to turn MathJax off. This feature requires Javascript. Click on a formula to zoom.
Abstract
Despite natural image super-resolution (SR) methods have achieved great success, super-resolution methods for hyperspectral image (HSI) with rich spectral features are still a very challenging task. Furthermore, due to the diversity of HSI captured by different cameras, their degradation conditions vary. Currently available HSI SR methods are mainly based on fixed degradation models, and their performance is severely affected when the actual degradation does not match the assumed degradation model. To address this issue, this paper proposes a single-band hyperspectral image super-resolution (SBHSR) method for HSI. This method assumes that the degradation Gaussian blur kernel parameters of the HSI are unknown, and adapts to various degradation conditions by conducting blind super-resolution on the image. It also combines another band with better spatial structure as an auxiliary band for feature fusion. To address the spectral differences between the super-resolution band and the auxiliary band, we use the Spatial Adaptation Module (SAM) to map the feature distribution, ensuring consistent spectral brightness between the auxiliary band and the super-resolution band. Due to the use of blind degradation super-resolution method, our method is more robust compared to previous HSI SR methods. Additionally, as it is specifically designed for single-band hyperspectral image super-resolution, it has the advantage of being faster and more efficient. Experimental validation on two hyperspectral datasets demonstrates the superiority of our method, as it improves the spatial resolution of the image while preserving the spectral features, and performs better than existing blind super-resolution methods.
1. Introduction
Hyperspectral image (HSI) consists of hundreds of bands of images ranging from visible to infrared wavelengths (400 nm-2500nm) (Rasti et al. Citation2020). HSI can reconstruct the corresponding material for any point in space through its continuous and fine spectral curve, thereby obtaining both spatial and material properties of the target. However, due to the limited available energy during image capture by hyperspectral sensors, hyperspectral imaging systems face a trade-off between spectral resolution, spatial resolution, and signal-to-noise ratio (SNR). Hyperspectral imaging sacrifices spatial resolution to achieve higher spectral resolution. However, in many applications such as road topography extraction (Mohammadzadeh et al. Citation2006) and spectral unmixing (Licciardi et al. Citation2012), higher spatial resolution images are needed to achieve better performance. Therefore, improving the spatial resolution of HSI using super-resolution (SR) techniques (Li et al. Citation2022) has become a current research focus.
Currently, hyperspectral spatial super-resolution (HSI SR) can be divided into two categories based on whether auxiliary images such as panchromatic images (PAN) or multispectral images (MSI) are used: (1) fusion-based methods that fuse HSI with corresponding auxiliary images (Loncan et al. Citation2015), and (2) single-frame HSI SR methods that do not include other auxiliary images (Zhang et al. Citation2021). Existing fusion-based methods typically fuse low-resolution (LR) HSI with high-resolution PAN, RGB images, or MSI to obtain high spatial resolution target images.
In general, fusion-based methods are known to provide more accurate spatial information. For example, methods such as MFSDM (Deng et al. Citation2022), EU2ADL (Gao et al. Citation2023), NonRegSRNet (Zheng et al. Citation2022), and HyCoNet (Zheng et al. Citation2021) utilize multiple HR and LR images as input. Compared to methods that only use a single LR image, these fusion-based methods have access to more known texture information, resulting in better super-resolution effects. However, in practical applications, the auxiliary observations captured in the same scene of the observed HSI are often scarce or somewhat inaccurate. Additionally, the fusion of HSI with auxiliary images faces registration issues, which may lead to blurred results due to registration errors. These factors limit the practicality of fusion-based methods.
In recent years, research on single hyperspectral image super-resolution methods based on deep learning has been hot. It can be mainly divided into two categories: single-band hyperspectral image super-resolution methods and single hyperspectral image multi-frame fusion super-resolution methods. With the rapid development of convolutional neural networks and the superior performance of deep learning in computer vision tasks, deep learning-based natural image super-resolution algorithms such as SRCNN (Dong et al. Citation2015) and EDSR (Lim et al. Citation2017) have been proposed successively, which have better performance compared to traditional methods. However, when faced with hyperspectral images with rich spectral features, these algorithms find it difficult to learn spectral information and more spatial information, and the network parameters will be too large, resulting in limited effectiveness in applying these algorithms to hyperspectral image super-resolution. (Liebel and Körner Citation2016) proposed a single-band super-resolution method for hyperspectral images, but this method did not utilize the multi-band information of hyperspectral images. Therefore, this paper proposes a method of using auxiliary bands to help the current band to learn spatial information for super-resolution (Yuan et al. Citation2017) This method borrows the idea of transfer learning to improve the resolution of hyperspectral images using information from natural images, and has good super-resolution effects. In addition, SFCSR (Wang et al. Citation2021a), (Bu et al. Citation2023) and GDRNN (Li et al. Citation2018), these methods fully utilize the multi-band spectral and spatial information of hyperspectral images. These methods assume that the blur kernel of image downsampling is fixed and known, and even only downsampling without adding a blur kernel. However, the degradation of real hyperspectral images is often complex and unknown. When the real degradation of the image does not match these fixed degradation models, the super-resolution results will be relatively poor. Therefore, this paper proposes a blind estimation-based hyperspectral image super-resolution method to adapt to different image degradation situations, and combines another band with good spatial structure as an auxiliary band for single hyperspectral image multi-frame fusion super-resolution..
In conclusion, this paper proposes a novel single-band hyperspectral super-resolution method that, for the first time, incorporates multi-scale fusion using another band. The proposed method employs the SAM module to eliminate the spectral influence of the auxiliary band. Furthermore, it is based on blind estimation and is applicable to various hyperspectral datasets.
2. Related works
2.1. Single hyperspectral super-resolution
Most existing single-band hyperspectral image super-resolution methods simultaneously super-resolve all bands of the HSI. However, HSI have a large number of bands, for example, pavia-Center has 101 bands. Super-resolving all bands is time-consuming and labor-intensive. (Liebel and Körner Citation2016) proposed a single-band hyperspectral super-resolution method, but this method did not consider the fact that the degradation of HSI in practical application scenarios, such as collaborative observation of a certain imaging area by micro-nano satellites, varies due to different imaging positions, angles, and environments. The actual degradation kernel of hyperspectral images in practical application scenarios is often complex and unknown. However, most existing single-band hyperspectral image super-resolution methods assume that the Gaussian kernel during image down-sampling is fixed and known, or even only down-sampling without a Gaussian kernel. When the true degradation of an image does not match these fixed degradation models, the super-resolution results will be poor.
Therefore, this paper proposes a single-band hyperspectral image super-resolution method based on blind estimation, and in order to make use of the different characteristics of multiple bands and spatial structures in hyperspectral images, we use another band with clearer spatial structure in the image as an auxiliary band for single-band hyperspectral super-resolution.
2.2. Blind SR
Blind degradation methods estimate image degradation without knowing the degradation parameters, thereby deblurring the image and achieving super-resolution. KXnet (Fu et al. Citation2022) proposed a method that iteratively estimates the Gaussian kernel and clear image, IKC (Gu et al. Citation2019) proposed an iterative kernel correction method that corrects the estimated degradation by observing previous SR results, and DASR (Wang et al. Citation2021c) proposed a blind SR method that implicitly estimates degradation through unsupervised degradation representation learning. IKC, KXnet, and others estimate the Gaussian kernel at the pixel level, while DASR learns abstract representations to distinguish various degradations, making it faster and more efficient. In the deblurring module of this paper, we draw on the DASR network to achieve the purpose of deblurring.
2.3. Super-resolution based on reference image
During super-resolution, in order to utilize the information from another band, we refer to super-resolution methods that use reference images, such as DCSR (Wang et al. Citation2021b) and MASA-SR (Lu et al. Citation2021). In the MASA-SR method, the Spatial Adaptation Module (SAM) can remap the color and brightness distribution of the reference image features to the LR features, and this paper’s method utilizes this module to eliminate spectral differences when fusing features from another band with the current band, in order to achieve spectral preservation. At the same time, the Double Residual Aggregation Module (DRAM) in the MASA-SR method fuses the remapped reference features with the LR features in a dual-branch structure, refining the high-frequency details of both the reference and LR images to enhance the generation of new features, thereby enhancing the high-frequency details of the features. The method proposed in this paper fuses the features of the reference and LR images at multiple scales.
3. Proposed method
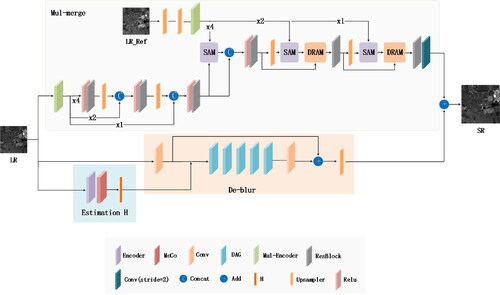
In this section, the proposed SBHSR is introduced in detail. Our network framework SBHSR consists of a degradation Estimation module [(Wang et al. Citation2021c), a De-blur module (Wang et al. Citation2021d), and a band fusion module, as shown in . The network is divided into two branches. Branch 1 follows the network framework of DASR to estimate the degraded blurred representation of the LR image, remove the blur, and then perform upsampling. Branch 2 performs multiscale fusion of features from another band.
Figure 1. The framework of SBHSR network.
The degradation model for single-band can be represented as follows:
(1)
(1)
Where is the low-resolution image of the i-th band,
is the high-resolution image of the i-th band,
represents convolution operation,
is the Gaussian kernel,
is the down-sampling with scale factor s, n is usually Gaussian white noise, and m represents the number of bands in the hyperspectral image. In this paper, bicubic down-sampling is used as the down-sampling operation, and the Gaussian kernel parameter sig is a random number in the range of [0.2 ∼ 4].
3.1. Estimation H module
Degradation representation learning, also known as Estimation H module, is an unsupervised method for extracting discriminative representations from LR images, as shown in . It uses a contrastive learning framework for blurry representation learning. It assumes that the degradation of each image is the same, while the degradation of different images is different. The single-band image blur estimation is shown in the following .
Figure 2. Estimation H moudule structure.
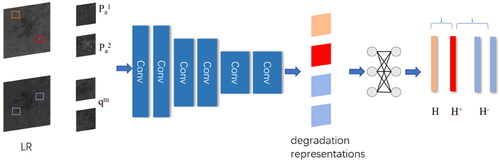
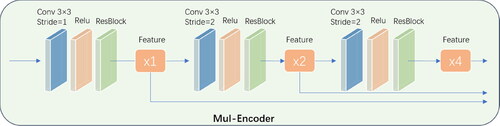
Figure 3. Mul-Encoder structure.
The method steps are as follows: first, a set of low-resolution images is inputted, and an image block is extracted from any low-resolution image A as a query block. In the second step, another image block
is extracted from image A as a positive sample. In the third step, some image blocks
are randomly extracted from the remaining low-resolution images as negative samples. The query block, positive sample, and negative sample are encoded using an Encoder network to obtain their blurry representations. These blurry representations are further fed to a two-layer Multi-Layer Perceptron (MLP) to obtain
and
The MoCo (He et al. Citation2020) contrastive learning method is used to approximate the similarity between
and
as much as possible, and to increase the dissimilarity between
and
The InfoNCE loss is used to constrain these similarities, and the calculation formula for InfoNCE is as follows:
(2)
(2)
where N represents the number of negative samples, τ represents the temperature hyperparameter. The larger the value of τ, the smoother the output features, and vice versa, the sharper the output features.
During the training process, B randomly selected low-resolution images are first chosen, and two image blocks and
are randomly extracted from each of these images.
represents the first image block extracted from the i-th image, and
represents the second image block extracted from the i-th image. They are used as the query block and positive sample, respectively. The loss of this network module can be represented as follows:
(3)
(3)
where
represents the number of samples in the queue, and
represents the j-th negative sample in the queue.
3.2. De-blur module
We adopt the degradation-aware module of DASR to apply the blurry representation to LR and remove the blur from the image, as shown in . De-blur consists of five residual groups DAG, each consisting of five DA blocks. Within each DA block, there are two DA convolutional layers that adapt the features based on the blurry representation. As shown in the figure, the degradation representation H is inputted into the DA through two fully connected (FC) layers and a reshape layer to generate a convolutional kernel Then, a 3 × 3 depth convolution w and a 1 × 1 convolution process the input features to generate F1. In the other branch of DA, the modulation coefficients based on the degradation representation are learned to achieve channel adaptation. R is passed to two additional FC layers and a Sigmoid activation layer to generate channel modulation coefficients v, which are then used to adjust the channel components in F, resulting in F2. F1 and F2 are added together and sent to the subsequent layers to generate the output feature
which serves as the input to the next DA block.
3.3. Band fusion module
This module multi-scale fusion of the current super-resolution band LR and the auxiliary band image Ref_LR, because different bands of HSI have different spatial details due to different wavelengths. Therefore, it is reasonable to choose a reference band for auxiliary super-resolution, which can complement each other in spatial structure and increase the texture details of the super-resolution image. First, the auxiliary band can select a band with clearer spatial structure from the HSI as HR_Ref, which is downsampled to obtain LR_Ref. LR_Ref and LR are fed into the network together. Ref_LR is upsampled by a factor of 4 to obtain Ref, and Ref and LR are separately processed by Mul-Encoder to obtain ×1, ×2, and ×4 feature maps
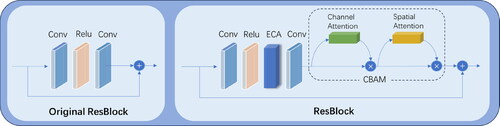
as shown in . The multi-scale feature maps of Ref are processed by the SAM module to match the color and brightness of the feature maps with LR. Then, through DRAM and ResBlock residual blocks, the features of LR and Ref are gradually upsampled and fused in a multi-scale manner to obtain the ×4 feature map. The ×4 feature map is then processed by a convolution with a stride of 2 to obtain the ×2 feature map, which is then added to the upsampled feature map of Branch1. The ResBlock incorporates the ECA (Wang et al. Citation2020) attention mechanism and the CBAM (Woo et al. Citation2018) channel-spatial attention mechanism, as shown in .
In the ECA module. Perform global average pooling operation on the input feature map, perform 1-dimensional convolution with a kernel size of k, and obtain the weights of each channel through the sigmoid activation function, as shown in the formula (4) below. Then, multiply the weights with the corresponding elements of the original input feature map to obtain the final output feature map.
(4)
(4)
where C1D represents one-dimensional convolution.
In the CBAM attention mechanism, the calculation formula for the Chnnel attention is shown in Formula 5, and the calculation formula for the Spatial attention is shown in Formula 6.
(5)
(5)
(6)
(6)
where
represents the average pooling feature and the maximum pooling feature, respectively.
and
are learnable parameters which which are represented through the MLP in our experiment.
are sigmoid activation functions.
represents important channel informations,
represents important spatial informations.
3.3.1. SAM and DRAM
The structural of the SAM and DRAM are illustrated in and , respectively. The LR image in the current super-resolution spectral band shares similarities in structure and texture with the auxiliary Ref image. However, due to their different spectral bands, their feature luminance also exhibits variations. To address this issue, we employ SAM to map the features of Ref onto the feature distribution of LR. This approach reduces the impact on the spectral luminance of the current super-resolution band during the feature fusion process in the DRAM module. The first half of the DRAM is divided into two branches, allowing us to separately extract the texture details of and
and which are subsequently merged for feature fusion ( and ).
Figure 4. DRAM structure.
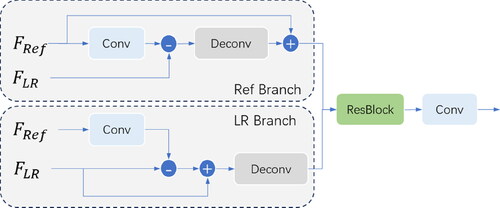
Figure 5. SAM structure.
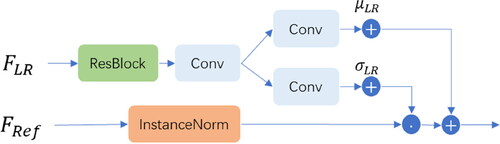
Figure 6. ResBlock structure.
4. Experimental results
4.1. Dataset and experimental settings
DIV2K, Flickr2K (Agustsson and Timofte Citation2017). DIV2K contains 800 natural images, and Flickr2K contains 2650 images, each with three bands. Two bands are selected from each image as the training set.
OHS dataset. which consists of 32 bands with a spatial resolution of 10 meters. It is cropped into 256 × 256 size images, and 400 images are slidingly cropped from each band, with 380 images used as the training set and 20 images used as the test set.
Pavia-Center dataset, obtained by the ROSIS sensor during a flight over Pavia in northern Italy. It is a 1096 × 715 pixel image with a spatial resolution of 1.3 m and a total of 101 bands.
According to formula (1), the size of the Gaussian kernel is fixed at 21 × 21, and an isotropic Gaussian kernel is used to train the network for noise-free degradation super-resolution. The range of the Gaussian kernel σ is [0.2, 2.0], and the down-sampling factor is 2. During training, 8 HR images are randomly selected from the training set, and data augmentation is performed through random rotation and flipping. Then, 8 LR images are randomly generated from the above data using Gaussian kernels, and each LR image is randomly cropped into 48 × 48 image blocks, resulting in a total of 16 LR image blocks and their corresponding HR image blocks. The hyperparameter is set to 0.07, and
is set to 8192. The Adam optimizer (Kingma and Ba Citation2014) is used with
and
The degradation encoder is trained first for 100 iterations, with an initial learning rate of
and a decrease to
after 50 iterations. The entire network is trained for 400 iterations, with an initial learning rate of
and the learning rate is halved every 100 iterations. The overall loss function is
where
is the Smooth L1 (Girshick Citation2015) loss between HR and SR. In simple terms, Smooth L1 loss is a smoothed version of L1 loss, which converges faster than L1 loss.
4.2. Results and discussions
4.2.1. Single-band super-resolution experiment results
This section shows the SR results of the proposed SBHSR on public HSI datasets, Pavia-Center. In addition, comparisons with relevant methods are also provided. The SR results are compared based on qualitative analysis and quantitative evaluation in . In addition, experiments are conducted on real-world hyperspectral data OHS to further demonstrate the effectiveness of the proposed method .
We compared our SBHSR method with several recent mainstream super-resolution networks, including KXNet, IKC, Real-ESRGAN (Wang et al. Citation2021d), DASR, and SFCSR. To observe the difference between the reconstructed hyperspectral image and ground-truth more clearly, the absolute error map between them is given. As shown in and , our method describes the result of low absolute error. In particular, the proposed SBHSR exhibits shallow edges or no edges in some regions, indictaing that our method achieves optimal spatial image reconstruction.
Figure 7. Comparison of three sets (a–c) of grayscale image details for the 55th band reconstructed from Pavia-Center data.
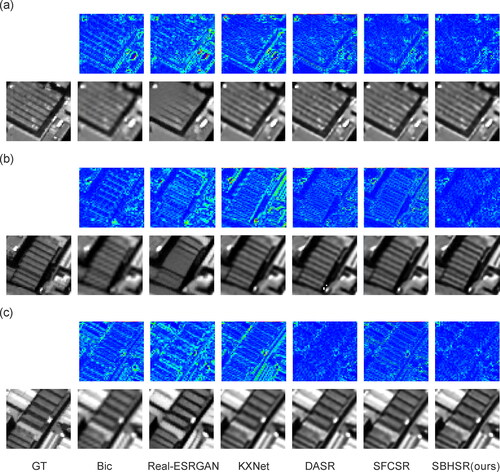
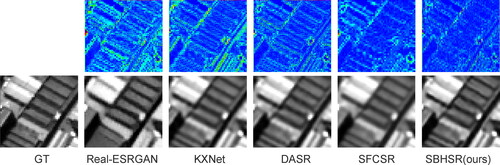
Figure 8. The detailed image of the 55th band of Pavia-Center data.
The training dataset for this round of experiments consisted of the DIV2K and Flickr2K datasets, and the test image was the 55th band of Pavia-Center, with the auxiliary band being the 45th band. LR images are obtained by applying a Gaussian kernel with δ = 0 on the ground truth images (GT), followed by down-sampling using bicubic interpolation. Subsequently, each method is used to perform 2x super-resolution on the LR images.
From the three sets of above, it is evident that the proposed method SBHSR exhibits more fine details and textures, while DASR exhibits singularities with pixel values of 0. This conclusion is further supported by the evaluation metrics PSNR and SSIM, which demonstrate the superiority of the proposed method over Bicubic interpolation, Real-ESRGAN, KXNet, DASR, and SFCSR. Additionally, the inclusion of the fusion band module in the proposed method further enhances its advantages compared to DASR.
For the test image of the 55th band of Pavia-Center with the auxiliary band being the 45th band, LR images are obtained by applying a Gaussian kernel with δ = 0.8 on the ground truth images (GT), followed by down-sampling using bicubic interpolation.
From , the results of the second set of experiments, it is evident that the Real-ESRGAN method suffers from severe distortion in low spatial resolution image super-resolution. The KXNet method lacks the image texture details of our method, SBHSR. Compared to the DASR and SFCSR method, our method has higher clarity in texture, indicating the effectiveness of the fusion module proposed in our method.
For the test image of the OHS dataset, we performed a 2x super-resolution on the GT original image with a spatial resolution of 10m to obtain an image with a spatial resolution of 5m.
From and , it is evident that our SBHSR method has more detailed image textures compared to other methods and performs the best in terms of the NIQE (Mittal et al. Citation2013) metric. Although SFCSR has the lowest NIQE score, its PIQE score is higher, and it can be clearly seen from the images that SBHSR has more texture details compared to SFCSR. However, it can be observed that the Real-ESRGAN method has the lowest PIQE (Venkatanath and Praneeth Citation2015) metric, indicating that the image becomes very smooth after applying the Real-ESRGAN method, resulting in distortion. At this point, the reference metric loses its reference significance for the Real-ESRGAN method. In addition, our method has the best PIQE metric and the best visual effect. The comparison of image textures and metrics with the DASR method confirms the superior super-resolution effect of our SBHSR method, which incorporates the fusion module proposed by us on the basis of the DASR method.
Figure 9. Details of the doubled super-resolution (a) (b) of 12th band in the original image of OHS data.
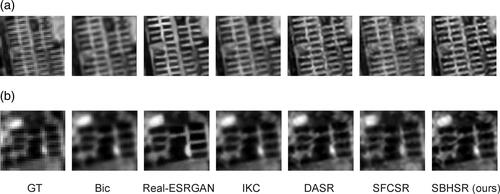
Table 1. Quantitative evaluation Pavia-Center dataset.
Table 2. The no-reference image evaluation metrics.
4.2.2. Ablation experiment results
In order to validate the effectiveness of the hybrid attention mechanism module, SAM module, and DRAM module in SBHSR, we conducted four experiments: BSHSR-Attention method that removes the attention mechanism module, BSHSR-SAM method that removes the SAM module, BSHSR-SAM-DRAM method that removes both SAM and DRAM modules. Since the SAM module serves the DRAM fusion module, removing the DRAM module directly implies removing both the SAM and DRAM modules. The shows the absolute error maps of the reconstructed hyperspectral images for each method.
Figure 10. Absolute error maps of the reconstructed hyperspectral images.
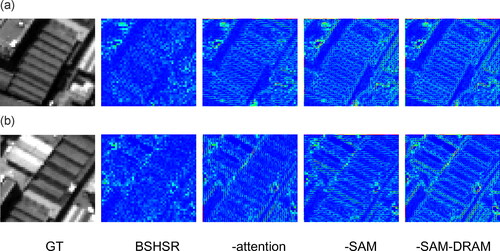
From , it is evident that removing the attention mechanism from BSHSR results in the loss of some image textures compared to BSHSR. This demonstrates the effectiveness of incorporating the hybrid attention mechanism in our method, BSHSR. The experimental results of BSHSR without the SAM module show even more texture in the absolute error images, indicating the high contribution of the SAM module to the image reconstruction method proposed in this paper. Furthermore, comparing the experimental results of BSHSR without both the SAM and DRAM modules to those without only the SAM module, it can be observed that the former exhibits even more texture in the absolute error images, highlighting the contribution of the DRAM module in BSHSR as well. These experiments validate the effectiveness of each module in our method, BSHSR.
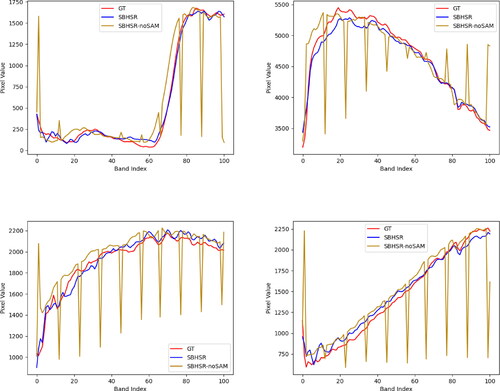
4.2.3. Spectral preservation experiment validation
To validate the spectral consistency of the SAM module, the Pavia_center dataset was used with 101 bands. The proposed methods, SBHSR and SBHSR-SAM, were applied to perform band merging. The spectral curves of the ground truth (GT) and super-resolved (SR) images were plotted for four sets of points. From , it is evident that the proposed method maintains good spectral fidelity and does not compromise the spectral characteristics of hyperspectral data, thereby confirming the effectiveness of SAM.
Figure 11. Spectral curve comparison chart.
5. Conclusions
In conclusion, in this paper, we propose a single-band super-resolution method for hyperspectral images based on blind degradation estimation, while utilizing another band of the hyperspectral image for auxiliary super-resolution. Experimental results demonstrate that our method not only achieves good performance in simulated experiments but also shows promising super-resolution results on real-world images. Furthermore, the robustness of our proposed method for super-resolution on different hyperspectral datasets is demonstrated through the aforementioned experimental results. Clearly, single-band hyperspectral super-resolution is also more efficient. These findings strongly indicate the superiority of our BSHSR method.
Disclosure statement
No potential conflict of interest was reported by the authors.
Data availability statement
Some or all data, models, or code generated or used during the study are available from the corresponding author by request.
Additional information
Funding
References
- Agustsson E, Timofte R. 2017. NTIRE 2017 challenge on single image super-resolution: dataset and study. IEEE Conference on Computer Vision and Pattern Recognition Workshops (CVPRW), Honolulu, HI, USA, p. 1122–1131. doi: 10.1109/CVPRW.2017.150.
- Bu L, Dai D, Zhang Z, Yang Y, Deng M. 2023. Hyperspectral super-resolution reconstruction network based on hybrid convolution and spectral symmetry preservation. Remote Sens. 15(13):3225. doi: 10.3390/rs15133225.
- Deng C, Luo X, Wang W. 2022. Multiple frame splicing and degradation learning for hyperspectral imagery super-resolution. IEEE J Sel Top Appl Earth Observat Remote Sens. 15:8389–8401. doi: 10.1109/JSTARS.2022.3207777.
- Dong C, Loy C, He K, Tang X. 2015. Image super-resolution using deep convolutional networks. IEEE Trans Pattern Anal Mach Intell. 38(2):295–307. doi: 10.1109/TPAMI.2015.2439281.
- Fu J, Wang H, Xie Q, Zhao Q, Meng D, Xu Z. 2022. KXNet: a model-driven deep neural network for blind super-resolution. Eur Conf Comput Vis. p. 235–253. doi: 10.1007/978-3-031-19800-7_14.
- Gao L, Li J, Zheng K, Jia X. 2023. Enhanced autoencoders with attention-embedded degradation learning for unsupervised hyperspectral image super-resolution. IEEE Trans Geosci Remote Sens. 61:1–17. doi: 10.1109/TGRS.2023.3267890.
- Gu J, Lu H, Zuo W, Dong C. 2019. Blind super-resolution with iterative kernel correction. IEEE/CVF conference on computer vision and pattern recognition (CVPR), Long Beach, CA, USA, p. 1604–1613. doi: 10.1109/CVPR.2019.00170.
- Girshick R. 2015. Fast R-CNN. IEEE international conference on computer vision (ICCV). Santiago, Chile, p. 1440–1448. doi: 10.1109/ICCV.2015.169.
- He K, Fan H, Wu Y, Xie S, Girshick R. 2020. Momentum contrast for unsupervised visual representation learning. IEEE/CVF conference on computer vision and pattern recognition (CVPR), Seattle, WA, USA, p. 9726–9735. doi: 10.1109/CVPR42600.2020.00975.
- Kingma D, Ba J. 2014. Adam: a method for stochastic optimization. Comp Sci. doi: 10.48550/arXiv.1412.6980.
- Lim B, Son S, Kim H, Nah S, Lee KM. 2017. Enhanced deep residual networks for single image super-resolution. IEEE conference on computer vision and pattern recognition workshops (CVPRW). Honolulu, HI, USA, p. 1132–1140. doi: 10.1109/CVPRW.2017.151.
- Li J, Hong D, Gao L, Yao J, Zheng K, Zhang B, Chanussot J. 2022. Deep learning in multimodal remote sensing data fusion: a comprehensive review. Int J Appl Earth Obs Geoinf. 112:102926. doi: 10.1016/j.jag.2022.102926.
- Li Y, Zhang L, Dingl C, Wei W, Zhang Y. 2018. Single hyperspectral image super-resolution with grouped deep recursive residual network. IEEE fourth international conference on multimedia big data (BigMM), Xi’an, China, 2018, p. 1–4. doi: 10.1109/BigMM.2018.8499097.
- Lu L, Li W, Tao X, Lu J, Jia J. 2021. MASA-SR: matching acceleration and spatial adaptation for reference-based image super-resolution. IEEE/CVF conference on computer vision and pattern recognition (CVPR), Nashville, TN, USA, p. 6364–6373. doi: 10.1109/CVPR46437.2021.00630.
- Liebel L, Körner M. 2016. Single-image super resolution for multispectral remote sensing data using convolutional neural networks. Int Arch Photogramm Remote Sens Spatial Inf Sci. XLI-B3:883–890. doi: 10.5194/isprs-archives-XLI-B3-883-2016.
- Loncan L, de Almeida LB, Bioucas-Dias JM, Briottet X, Chanussot J, Dobigeon N, Fabre S, Liao W, Licciardi GA, Simoes M, et al. 2015. Hyperspectral pansharpening: a review. IEEE Geosci Remote Sens Mag. 3(3):27–46. doi: 10.1109/MGRS.2015.2440094.
- Licciardi G, Villa A, Khan MM, Chanussot J. 2012. Image fusion and spectral unmixing of hyperspectral images for spatial improvement of classification maps. IEEE International Geoscience and Remote Sensing Symposium. p. 7290–7293. doi: 10.1109/IGARSS.2012.6351978.
- Mittal A, Soundararajan R, Bovik AC. 2013. Making a “completely blind” image quality analyzer. IEEE Signal Process Lett. 20(3):209–212. doi: 10.1109/LSP.2012.2227726.
- Mohammadzadeh A, Tavakoli A, Zoej MJV. 2006. Road extraction based on fuzzy logic and mathematical morphology from pan-sharpened ikonos images. Photogram Rec. 21(113):44–60. doi: 10.1111/j.1477-9730.2006.00353.x.
- Rasti B, Hong D, Hang R, Ghamisi P, Kang X, Chanussot J, Benediktsson JA. 2020. Feature extraction for hyperspectral imagery: the evolution from shallow to deep: overview and toolbox. IEEE Geosci Remote Sens Mag. 8(4):60–88. doi: 10.1109/MGRS.2020.2979764.
- Venkatanath N, Praneeth D. 2015. Blind image quality evaluation using perception based features. Twenty first national conference on communications (NCC), Mumbai, India, p. 1–6. doi: 10.1109/NCC.2015.7084843.
- Woo S, Park J, Lee J-Y, Kweon IS. 2018. CBAM: convolutional block attention module. Comp Vis ECCV Lect Notes Comp Sci. 11211:3–19. doi: 10.1007/978-3-030-01234-2_1.
- Wang Q, Wu B, Zhu P, Li P, Zuo W, Hu Q. 2020. ECA-Net: efficient channel attention for deep convolutional neural networks. IEEE/CVF conference on computer vision and pattern recognition (CVPR), Seattle, WA, USA, p. 11531–11539. doi: 10.1109/CVPR42600.2020.01155.
- Wang Q, Li Q, Li X. 2021a. Hyperspectral image superresolution using spectrum and feature context. IEEE Trans Ind Electron. 68(11):11276–11285. doi: 10.1109/TIE.2020.3038096.
- Wang T, Xie J, Sun W, Yan Q, Chen Q. 2021b. Dual-camera super-resolution with aligned attention modules. IEEE/CVF international conference on computer vision (ICCV), Montreal, QC, Canada, p. 1981–1990. doi: 10.1109/ICCV48922.2021.00201.
- Wang L, Wang Y, Dong X, Xu Q, Yang J, An W, Guo Y. 2021c. Unsupervised degradation representation learning for blind super-resolution. IEEE/CVF conference on computer vision and pattern recognition (CVPR), Nashville, TN, USA, p. 10576–10585. doi: 10.1109/CVPR46437.2021.01044.
- Wang X, Xie L, Dong C, Shan Y. 2021d. Real-ESRGAN: training real-world blind super-resolution with pure synthetic data. IEEE/CVF international conference on computer vision workshops (ICCVW), Montreal, BC, Canada, p. 1905–1914. doi: 10.1109/ICCVW54120.2021.00217.
- Yuan Y, Zheng X, Lu X. 2017. Hyperspectral image superresolution by transfer learning. IEEE J Sel Top Appl Earth Observations Remote Sens. 10(5):1963–1974. doi: 10.1109/JSTARS.2017.2655112.
- Zhang M, Sun X, Zhu Q, Zheng G. 2021. A survey of hyperspectral image super-resolution technology. IEEE international geoscience and remote sensing symposium IGARSS. Brussels, Belgium, p. 4476–4479. doi: 10.1109/IGARSS47720.2021.9554409.
- Zheng K, Gao L, Liao W, Hong D, Zhang B, Cui X, Chanussot J. 2021. Coupled convolutional neural network with adaptive response function learning for unsupervised hyperspectral super resolution. IEEE Trans Geosci Remote Sens. 59(3):2487–2502. doi: 10.1109/TGRS.2020.3006534.
- Zheng K, Gao L, Hong D, Zhang B, Chanussot J. 2022. NonRegSRNet: A nonrigid registration hyperspectral super-resolution network. IEEE Trans Geosci Remote Sens. 60:1–16. doi: 10.1109/TGRS.2021.3135501.