
 ?Mathematical formulae have been encoded as MathML and are displayed in this HTML version using MathJax in order to improve their display. Uncheck the box to turn MathJax off. This feature requires Javascript. Click on a formula to zoom.
Abstract
Groundwater is an essential natural resource that sustains numerous ecological systems and human lifestyles. The Jhargram district is facing persistent groundwater development issues, requiring comprehensive monitoring and planning, as most farmers heavily rely on groundwater for crop production. The groundwater potential zone of the Jhargram district was classified into five classes, viz., very high (5.82%), high (50.81%), moderate (30.33%), low (13.01%), and very low (0.03%), zones, respectively. The results were assessed for validity using ROC curves, which demonstrated an accuracy rate of 80.4%. The calculation of the AUC was performed in order to assess the overall accuracy of the predicted GWPZ. The GWPZ map is crucial for implementing artificial recharge structures like percolation ponds, bunds and trenching in semi-arid regions. It aids in developing sustainable groundwater management policies, mitigating drought, climate change, and water scarcity, and aiding farmers, regional planners, policy-makers, climate change experts, and local governments.
1. Introduction
Groundwater is the primary source of liquid freshwater on the planet (Krakauer et al. Citation2014; Paneerselvam et al. Citation2023). It facilitates almost 50% of potable water and 40% of irrigation for agricultural practices at global scale (Jesiya and Gopinath Citation2019; Paneerselvam et al. Citation2023; Wang et al. Citation2023). Approximately 2.5 billion individuals globally depend on groundwater sources to meet their basic needs, especially those living in rural areas with limited access (Gopinath and Seralathan Citation2004; Naidoo and Olaniran Citation2014; Shaji et al. Citation2021). Meanwhile, groundwater resource demand has risen considerably in recent decades due to industrialization, rapid urbanization, the global impact of climate change, recurring drought conditions, and lack of rainfall (Mall et al. Citation2006; Roy et al. Citation2022; Mishra Citation2023). In the last few decades, increasing agricultural activities have pressured groundwater resources for irrigation, mainly in drought prone zones in different countries of the world (Foster Citation2001; Shiferaw et al. Citation2008; Torabi Haghighi et al. Citation2020). So, uncontrolled groundwater exploration creates problems for decreased groundwater levels, degradation of groundwater potentiality, and water quality of any region (Foster Citation2001; Yesilnacar and Gulluoglu Citation2008; Sankar et al. Citation2023). Furthermore, groundwater potential zone (GWPZ) analysis is essential for maintaining sustainable water resource management (Moiwo et al. Citation2010; Agarwal and Garg Citation2015; Biswas, Pal, Ruidas, et al. Citation2023). The groundwater availability of any region depends on various climatic, geological, geomorphological, and other physio-cultural factors including rainfall, temperature, evaporation, lithology, geology, lineament density (LD), drainage density (DD), soil type, LULC, biological factors, etc. (Mahmoud and Alazba Citation2016; Godfray and Tembo Citation2022); Bhadran et al. Citation2022).
Remote sensing (RS), GIS, and machine learning are now extremely effective and precise approaches for determining groundwater presence (Thakur et al. Citation2017; Panneerselvam, Muniraj, Pande, et al. 2023; Sikakwe Citation2023). The advancement in remote sensing technology, along with the use of Geographic Information System (GIS) and powerful computers, has greatly improved the process of delineating Groundwater Potential Zones (GWPZ). This method is more efficient and cost-effective compared to traditional techniques such as geological, geophysical, hydrogeological surveys, drilling, resistivity survey, and ground-penetrating radar surveys, which often require specialized expertise (Dar et al. Citation2010; Kumar et al. Citation2011; Magesh et al. Citation2012; Tahmassebipoor et al. Citation2015). Furthermore, the combination of remote sensing (RS) and geographic information systems (GIS) is highly effective in evaluating, monitoring, and controlling groundwater in both space and time within a specified timeframe. The AHP method makes use of the widely-used multi-criteria decision-making (MCDM) technique, which is useful for groundwater management since it adds consistency, accessibility, and framework considerations to the analysis (Bello-Dambatta et al. Citation2009; Das et al. Citation2019; Murmu et al. Citation2019; Kumari and Singh Citation2021; Godfray and Tembo Citation2022). The combined GIS and AHP application translates and unifies spatial maps as well as normalized weight to produce information that can be used in the decision-making process (Deng et al. Citation2016; Mogaji Citation2016; Biswas, Pal, and Saha Citation2023). Many researchers have used the remote sensing and geographical information system based multi-criteria decision making and analytical hierarchy process (Ghosh et al. Citation2015; Mukherjee and Singh Citation2018; Das Citation2019), Weights of evidence (Pourtaghi and Pourghasemi Citation2014), Logistic regression (Park et al. Citation2017), analytic hierarchy process (Maity and Mandal Citation2017), logistic regression (Park et al. Citation2017), Naïve Bayes (Biswas et al. Citation2023a; Biswas et al. Citation2023b; Miraki et al. Citation2018), Weights of evidence (Madani and Niyazi Citation2015), frequency ratio (Ozdemir A 2011), GIS information fusion, Random Forest (Naghibi et al. Citation2018), regression tree (Naghibi et al. Citation2015), artificial neural network (Daliakopoulos et al. Citation2005), and support vector machine (Suryanarayana et al. Citation2014); Multi affecting factors (Anbarasu et al. Citation2020; Pande et al. Citation2021) and MCDM-DSM (Pandey et al. Citation2022) for the delineation of groundwater potential zone. The various studies in recent years have shown that multicriteria decision analysis (MCDA) is an effective method for water resource management by providing a framework, transparency, accountability, and robustness to decisions (Al-Abadi and Shahid Citation2015; Arnous Citation2016; Saha Citation2017; Jesiya and Gopinath Citation2020; Shao et al. Citation2020). Analytic hierarchy process (AHP) is the most extensively used technique for delineating the GWPZ because of its ease of integration with GIS (Dinesan et al. Citation2015; Ejepu et al. Citation2022; Hasanuzzaman et al. Citation2022; Shelar et al. Citation2022; Moharir et al. Citation2023).
Jhargram district in West Bengal has typical semi-arid conditions, with rainfall occurring only during the monsoon season (Bera et al. Citation2021; Senapati and Das Citation2021). Therefore, severe water scarcity exists during non-monsoon seasons. The region requires a detailed groundwater potential map due to agriculture’s predominant activity and the need for watershed development due to unpredictable monsoon behaviour and summer water scarcity (Guchhait et al. Citation2023). This study aims to identify groundwater potential zones (GWPZ) using GIS and AHP methods, utilizing various thematic maps, field datasets, and water level data. The GWPZ map was further cross validated using the water depth and the receiver operating characteristic curve (ROC). The cost-effective GIS-AHP technique is very efficient in accurately defining the GWPZ and may be effectively utilized for the development and implementation of sustainable groundwater policy and management strategies.
2. Study area
Jhargram is located in the south-western part of West Bengal which is formed as the 22nd district on 4th April 2017 after the splitting of Paschim Medinipur district. Jhargram district covers an area of 3,037.64 Sq.km. and had a population of 11,36,548 as of the 2011 census. Jhargram is located in West Bengal, India, between latitude 21°45′ N to 22°42′ N and longitude 86°42′ E to 87°16′ E encompassing an area of 3,037.64 square kilometres (). Rural areas accounted for 96.52% of the total population, while urban areas accounted for only 3.48% of the total population. The average yearly rainfall in this district is 1430 mm, and the temperature in May and June is 45 °C. December and January are the coldest months, and the climate is quite humid and tropical. Geographically, an extended part of dissected Chhotonagpur Plateau and Ranchi Peneplains profoundly noticed in the western part of the district. The Chhotanagpur Plateau is mainly composed of Precambrian rocks, including metamorphic rocks, granite, and gneiss. These rocks have undergone extensive weathering and erosion over millions of years. The plateau is covered with forests, and the vegetation varies from tropical moist deciduous to dry deciduous. The Ranchi Peneplains characterized by relatively flat, gently rolling landscapes that result from the erosion of previously uplifted areas. They often exhibit a subdued relief with residual hills. The Ranchi Peneplains have been shaped by long-term erosion processes, and they represent a stage in the erosional cycle where the land is approaching a state of base level, achieving a more subdued topography.
Figure 1. Location map of the study area: (a) India, (b) West Bengal and (c) Jhargram district.
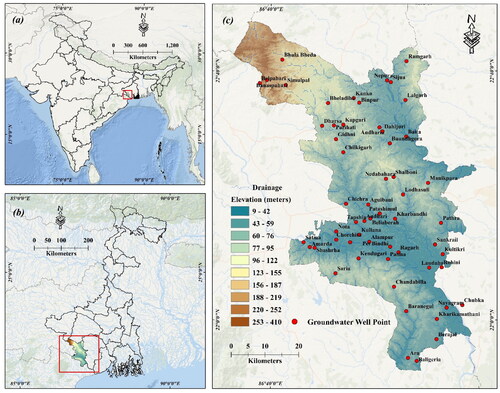
The general slope of the whole region extends from north-west to south-east direction. The hard-rocky crystalline rocks are responsible for the lack of proper aquifer development on the northwest side of the district. The geological characteristics of hard-rocky crystalline rocks can pose challenges for aquifer development in terms of low permeability, limited porosity, and the potential absence of well-connected fractures and fissures. Understanding the geological conditions is crucial for effective water resource management and the development of sustainable groundwater sources in such areas. The Jhargram region has experienced chronic water scarcity for many years, impeding socio-economic progress. This scarcity has a negative impact on agriculture, industries, public health, and education, resulting in migration and environmental repercussions. In the summer season, the sources of surface water dry up in every year and the common people of Jhargram rely on groundwater aquifers for drinking, household consumption, agricultural practices, and other sectors as well, but excessive exploitation of groundwater arise the issue of groundwater level depletion. Hence, proper groundwater assessment and appropriate management planning is necessary to cope up with water scarcity and maintain the groundwater table for this region.
3. Materials and method
3.1. Geodatabase preparation for groundwater potential evaluation
This research aims to identify high-potential groundwater sites in Jhargram district, West Bengal, India by prioritizing key influencing factors in decision-making process of ground potential zones maps. The Multi-Criteria Decision Making (MCDA) and Analytical Hierarchy Process (AHP) have been used to compute the weightage of each influencing groundwater parameters (Jesiya and Gopinath Citation2019). Groundwater potential maps were developed by considering lithology, precipitation, slope, lineament density (LD), drainage density (DD), soil, and land use and cover (LULC). High resolution gridded data sets, in the form of CRU gridded monthly rainfall data (30′ X 30′) have been obtained from the Climate Research Unit (crudata.uea.ac.uk) to prepare the rainfall map of the study region. Slope maps, lineament density (LD) maps, and drainage density (DD) maps were generated utilizing SRTM DEMs obtained from the United States Geological Survey (USGS) portal (https://earthexplorer.usgs.gov/). The drainage density map is built using ArcGIS's line density tool, lineaments extracted with PCI Geomatica’s LINE module, and discontinuities verified with ArcMap’s Split Line Tool. The generated lineament shapefile is used to determine lineament density in kilometres per square kilometre. The inclination of a slope is calculated in degree by the input of the DEM surface raster in Arc-GIS. Land use/landcover (LULC) map has been generated based on the maximum likelihood algorithm of supervised image classification from Landsat Thematic Mapper imagery (). The lithology and soil maps were collected from the Geological Survey of India’s (GSI) official website (https://bhukosh.gsi.gov.in/). The observational well data were obtained from the Central Ground Water Board (CGWB). This data includes the coordinates of the well’s location as well as the depth of the well for each of the wells. The weightages for thematic layers have been determined using the Analytic Hierarchy Process (AHP) and Weighted Overlay Analysis (WOA) approaches in order to identify prospective groundwater zones that are influenced by different environmental conditions (Swetha et al. Citation2017; Panneerselvam et al. Citation2020). AHP, developed by Saaty (Citation1990a, Citationb), is a decision-making technique that evaluates various criteria and determines their relative relevance in identifying groundwater zones. The WOA technique was employed to delineate prospective groundwater zones by conducting a weighted overlay analysis of the thematic layers. The advantages of AHP include its hierarchical composition, accuracy, and efficiency, which make it a cost-effective and time-efficient technique (Balamurugan et al. Citation2020). The methodology adopted in the present study is shown in .
Figure 2. Graphical framework of methodology flow chart.
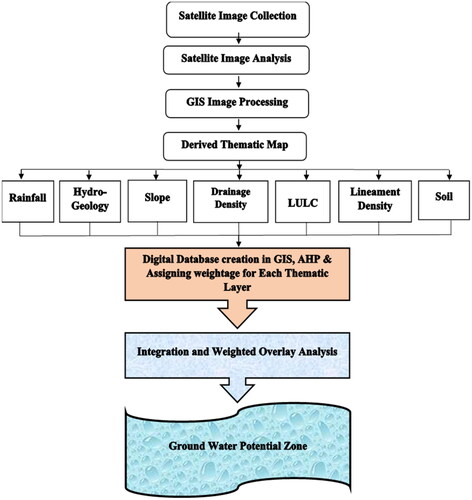
Table 1. Sources of data used for preparing thematic layers.
3.2. Analytic Hierarchy process (AHP) method
The Analytic Hierarchy Process (AHP) is a component of the Multi-Criteria Decision Analysis (MCDA) methodology, which involves the assessment and determination of several objectives (Jesiya and Gopinath Citation2019; Achu et al. Citation2022; Shelar et al. Citation2022; Bera et al. Citation2021). Our study focuses on utilizing the Analytic Hierarchy Process (AHP) technique to assess the impact of each thematic layer on groundwater potential (Bhadran et al. Citation2022; Panneerselvam, Muniraj, Duraisamy, et al. Citation2023); Saaty Citation1980). The MCDA process makes it possible to justify the optimality of the decision. The MCDA method involves assigning weights to pertinent aspects in a study, whereas the AHP technique is subjective and relies on the selection and weighting of subunits according to proper decision-making criteria (Swetha et al. Citation2017; Bhadran et al. Citation2022; Pande et al. Citation2021; Moharir et al. Citation2023). The combination of satellite imagery, geographic information systems, and AHP approaches has become increasingly popular in the field of GIS to handle extensive datasets and identify areas with high groundwater potential using hydrologic and geological factors. The AHP analysis is a low-cost and time-efficient method for calculating the GWPZ that simplifies crucial judgments through pair-wise comparisons (). Through an integrated geospatial analysis technique, it also maintains consistency, lowers bias, and displays the structure of the decision-making program. To assign the weights Satty’s nine (9) points scaling method has been used. On a 9-point scale, value one (1) represents when two indices likewise influenced to the objective and value nine (9) represents the high strength over the other indexes to fulfil the desire objective. The steps involved to compute the final weights of all parameters with Multi-Criteria Decision Analysis (MCDA) process under the framework of the Analytical Hierarchy Process is discussed below.
Table 2. Pairwise comparison matrix for climatic – morphometric – lithologic (CML) indicators at level one (1) decision Hierarchy model.
3.2.1. Factors select and the pairwise comparison matrix
The behaviour of subterranean water is evaluated using a pairwise comparison matrix, which requires the parameters and subclasses to be assigned scores and weights.
(1)
(1)
Decision makers evaluate all the comparative criteria Rj and Rk (j, k =1,2,3,4 …, m). Where, m is the number of the compared parameters.
This matrix Pm is an inversely diagonal symmetric matrix, i.e. pjk =1/pkj. The basic principle for assembling the given matrix table is simply that a specialist must specify how much a certain criterion is more important than another.
3.2.2. Normalized the pairwise comparison
Each column in the pairwise comparison matrix is summed, and then each cell is normalized by being divided by the column sum. Then, we aggregate the rows obtained from the individual elements, and we divide the resultant sum by the total number of indices or parameters. The priorities vector may be computed mathematically in the following way:
(2)
(2)
‘Where, “Wij” represents the standard weight and ‘n’ denotes number of indices or criteria’.
3.2.3. Consistency perform
When a comparison is made by personal or subjective judgment, some degree of inconsistency may occur. To ensure the consistency of judgments, the final operation is called a consistency check. This is the most advantageous operation in the AHP framework. By computing the Consistency Ratio (CR) we could measure the degree of consistency among the pairwise comparison. The CR represents the proportion of Consistency Index (CI) to Random Index (RI) for the identical sequence of matrices (Akinlalu et al. Citation2017).
(3)
(3)
(4)
(4)
(5)
(5)
‘Where, RI represents Random Inconsistency. RI of the parameters has been provided in Appendix 2. The pairwise comparison is believed as consistent when the value of CR is equal or less than (≤) 0.1, or else, it will be amended’.
3.3. Weighted overlay analysis (WOA)
The weighted overlay analysis tool is critical for detecting GWPZ because it addresses the challenging problem of evaluating site suitability using standard measures from a variety of inputs. Within the framework of WOA, a rating scale ranging from 1 to 10 is employed to assign scores to sub-parameters, in alignment with the previously mentioned criterion. The WOA tool was utilized to superimpose and integrate all of the reclassified raster maps for the given criteria. According to their relative importance to groundwater presence, weights have been assigned to each indicator (raster format) of the GWPZ in the Jhargram district. The GWPZ (GWPZ) of the Jhargram district has been developed by integrating all the weighted indicators with a GIS overlay environment. The total score of all indicators has been computed as –
(6)
(6)
‘Where, ‘TS’ signifies the Total Score, ‘W’ means the weight of the main indicators and ‘R’ represents the weight of the sub-indicators.
(7)
(7)
‘Where, “GWPZ” represents Groundwater Potential Zone, “RD” signifies Rainfall Density, “S” means Slope, “LD” signifies Lineament Density, “DD” indicates Drainage Density, “SS” indicates Soil Structure, and “LULC” denotes Land use land cover’.
3.4. Groundwater potential zone estimation (GWPZ)
The estimation of Groundwater potential zone is acquired by adding the allotted weightage of variables which is designated as ‘W’ and the rating scores which is expressed as ‘R’. So, groundwater potential index (GWPI) was estimated by the subsequent function –
‘Where, RDW - Weight of Rainfall Density, RDR - Rank of Rainfall Density, HGW - Weight of Hydro Geology, HGR - Rank of Hydro Geology, SW - Weight of land slope, SR - Rank of land slope, DDW - Weight of Drainage Density, DDR - Rank of Drainage Density, LULCW - Weight of LULC, LULCR - Rank of LULC, LDR - Lineament Density’s rank, LDW - Lineament Density’s weight, SSD - Soil Structure’s weight, SSR - Rank of Soil Structure’.
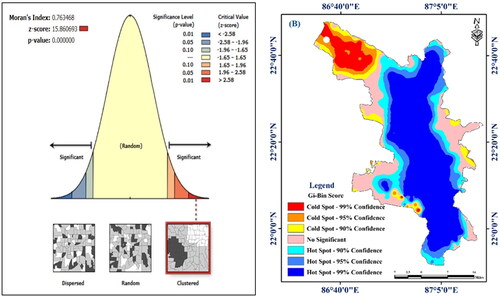
3.5. Determination of spatial association: Hotspot analysis
The study analyzes groundwater potential and scarcity using statistical tools and spatial associations. In the Arc GIS Environment, we have used hotspot approaches for the purpose of statistical analysis. Random points are first created on the final Groundwater potential zone map for the hotspot analysis. The hotspot analysis utilizes the Getis-Ord Gi* statistic and facilitate the display and comprehension of important spatial relationships between areas with high values (hot spots) and areas with low values (cold spots) of groundwater potential. The statistical significance of the geographical clusters is determined by the analysis’s z-score (GiZ score), p-value (GiP value), and confidence level bin field (Gi_bin). Using Getis-Ord Gi* statistics with inverse distance and Euclidean distance, this study finds the elements that are closest to each other and have the most influence, as opposed to those that are further apart. This technique finds places where values are too high or too low compared to their neighbors, and it finds places where values are too different from their neighbors to be considered normal ().
4. Result and discussion
4.1. Rainfall characteristics and groundwater potentiality
The hydrological cycle relies on precipitation, making it a major source of subsurface groundwater recharge (Balamurugan et al. Citation2020; Pande et al. Citation2021; Bhadran et al. Citation2022). The groundwater recharging rate is profoundly influenced by rain’s spatiotemporal pattern. It is more likely that groundwater potential will rise as rainfall increases. The annual average rainfall of the study area is about 1500 to 2000 mm. The rainy season extends from June to September as a result of the southwest monsoon, with the majority of precipitation occurring in July and August. The precipitation diminishes from October, marking the onset of a dry winter season. The dry season extends until the month of May. However, during this period, this region experiences intermittent rainfall. The middle eastern part and some pockets of the western portion receive the highest rainfall whereas north-west segment receives the lowest rainfall in the selected research region (). Among all parameters, rainfall gets relatively higher weightage because it has the extent effect on groundwater. The potential effect of groundwater is high for the zone of above 2568.80 mm rainfall annually and this category gets maximum weight, 0.380 ().
Figure 3. Groundwater potential zone parameters: (a) slope, (b) drainage density, (c) lineament density, (d) annual rainfall, (e) LULC, (f) soil category and (g) Hydro geology.
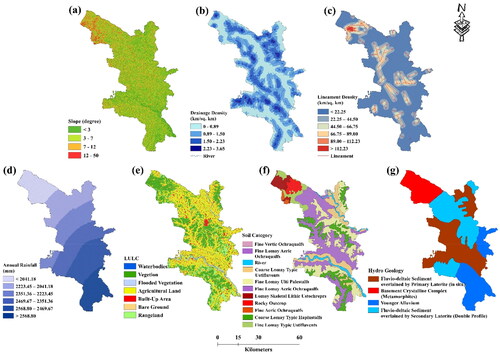
Table 3. Ranking sub-categories for various conditioning factors and assigning weightages based on these rankings.
4.2. Hydrogeological characteristics and groundwater potential
Hydrogeological maps analyze morphology and underlying geology to understand processes, structures, and controls in groundwater presence and potential, crucial for planning and implementing exploration (Panneerselvam et al. Citation2020). Geo hydrogeological characteristics have the second highest weight (0.243). The studied region was categorized into four different hydrogeological classes viz., basement crystalline complex (metamorphites), fluvio-deltaic sediment overlined by primary laterite (in situ), fluvio-deltaic sediment overlined by secondary laterite (double profile) and younger alluvium (). The fluvio-deltaic sediment overlined by secondary laterite double profile (FDSOdp) demonstrated high groundwater potential and got maximum weightage of 0.483 (). The study area’s lithological characteristics include thin fine sand stratum, coarse to medium FDSDdp sand, silt bed, vertical faces gradation, shale, and YA with finer to medium sand, sand facies changing to sandy clay or clay.
4.3. Sloping characteristics and groundwater potential
Slope gradient is another essential element that has a direct impact on groundwater occurrence. A higher slope percentage leads to an increase in surface runoff, whereas a lower slope percentage promotes infiltration, which in turn recharges groundwater. The northwestern district has a steep slope, ranging from 12 to 50 degrees, with the slope decreasing in the southeast direction from the north-west direction (). The Jhargram district slope map is categorized into classes: very low (0 – 3%). low (3 – 7%). moderate (7 – 12%), and very high (12 – 50%). The southern and northern regions have a mild slope and are better suited for infiltrating surface water, hence slopes less than 3 degrees are given the maximum weight (0.429) ().
4.4. Drainage density and groundwater potential
Drainage density reflects natural soil infiltration based on lithology. Drainage density (Dd) is very much influenced by structure and nature of rocks, quality of soil, and slope of land, and other related factors (Manap et al. Citation2013). Drainage density described as the total length of the stream channel in per unit area or basin area (Strahler Citation1952; Tucker et al. Citation2001). The Strahler method is based on streams that are in the same order coming together. There are no other streams that run into a first order stream. When two streams with different orders join, the new stream has the same order as the stream with the largest order. The classification of streams based on the number and type of tributary junction has proven to be a useful indicator of stream size, discharge, drainage area, and age (Strahler Citation1952). The drainage density of the Jhargram district ranged from 0 to 3.65 km/km2 (). The relationship between drainage density and groundwater is inversely proportional, with high drainage density resulting in high surface run-off and low infiltration, and low drainage density causing low surface run-off and high infiltration. A higher drainage density results in a decrease in the amount of surface water that penetrates the subsurface, and vice versa (Bera et al. Citation2019).
4.5. Landuse/landcover characteristics and groundwater potential
The land use land cover (LULC) is another key indicator that may be used to evaluate the groundwater potential (Jhariya et al. Citation2016). The hydrological, hydrogeological, and hydroclimatological processes of the water cycle, such as runoff, infiltration, and evapotranspiration, are especially susceptible to the impacts of land use and land cover (LULC). This mechanism also impacts the recharge of groundwater. The LULC map has been generated through Landsat-8 OLI datasets which collected from USGS Earth Explorer and categorized it into different classes using ArcGIS 10 software’s by adopting the supervised classification algorithm (SCA). The water bodies, barren land, agricultural land, agricultural fallow, open forest, dense forest, settlement, sand, road, and railway are the major LULC classes of the Jhargram District (). The groundwater potential of Jhargram district is determined by considering agricultural area, agricultural fallow, forest, waterbody, and bare soil. Compared to bare ground and built-up regions, vegetation and forest cover minimize runoff and improve subsurface infiltration. Water bodies and paddy fields boost groundwater infiltration and recharging thereby have high weightage, while barren land/urban locations have low weightage due to inadequate infiltration.
4.6. Lineament density and groundwater potential
Lineaments are sub-surface geological structures which are generally found in the form of linear or curvilinear pattern in the earth’s surface. It consists of underlying rock structure such as - faults, along the drainage network and fractures etc. seen in satellite images. The major lineaments in the study area have a trend of NNW-SSE to NW-S-E and E-W direction (). There are many minor lineaments in the study area, that trend in the NW-SE and N-S directions. Most of the lineaments in the area were found to be along the drainages. The lineament density (LD) of the Jhargram district was grouped into six divisions, viz., very low (0.0–22.25 km/km2), low (22.25–44.50 km/km2), moderately low (44.50–66.75 km/km2), moderately high (66.75–89.00 km/km2), high (89.00–112.23 km/km2), and very high (above 112.23 km/km2). Groundwater potential is highly favorable in places with high to very high LD, thus very high (over 112.23 km/km2) LD zones have a higher weight, 0.380 ().
4.7. Soil characteristics and groundwater potential
Soil properties significantly influence potential groundwater zones, with fine-textured soil indicating low permeability and coarse-textured soils often being highly permeable (Holt Citation1965). Highly permeable soils allow for relatively quick penetration rates, allowing most of the precipitation to reach groundwater. The major nine types of soil observed in the Jhargram district include fine aeric ochraqualfs, fine vertic ochraqualfs, coarse loamy typic ustifluvents, coarse loamy typic haplustalfs, fine loamy typic ustifluvents, fine loamy aeric ochraqualfs, fine loamy ulti paleustalfs, loamy lithic ustochrepts, loamy skeletal lithic ustochreprs, and rocky outcrops (). The soil types classified as fine vertic haplaquaepts, fine vertic haplaquaepts, and coarse loamy typic ustifluvents exhibit higher weight scores for infiltration rate surpassing runoff volume. Conversely, the soil types categorized as loamy skeletal lithic ustochreprs, fine loamy typic ustochreptas, and fine loamy typic ustifluvents display the lowest weight scores. In the eastern portion of Jhargram very fine loamy, aeric, and sandy soil are found which has maximum specific yielding capacity (19-30%) and high permeability rate (32-38%) and which indicates the sub-surface soil saturated, and groundwater recharged through well-defined pore spaces by precipitation. However, the crystalline rocks found in the northwest section of the region are impermeable to water due to their low porosity and permeability. This is because the rocks’ tiny grain sizes and huge surface surfaces have enhanced friction (Donahue et al. Citation1978). Therefore, the rate of groundwater recharge, amount of groundwater storage and discharge of groundwater is determined through soil parameters, and which further determines the quality of groundwater subsequently.
4.8. Groundwater potential index (GWPI)
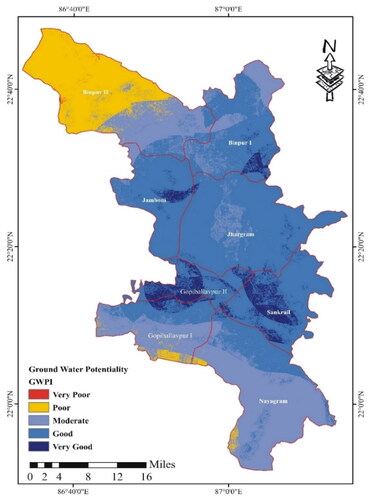
Groundwater recharge maps have been generated using weighted overlay analysis in ArcGIS 10.3 software, incorporating drainage density, lineament density, hydro geology, land use, rainfall, slope, and soil type to understand groundwater storage in the study region. The GWPZ of Jhargram district was categorized into five classes viz. very good (5.82%), good (50.81%), moderate (30.33%), poor (13.01%), and very poor (0.03%) of the total area. Jhargram district has a moderate to good groundwater potential, ranging from 30.33 to 50.81%. Very poor and poor zones characterize the northwestern and southwestern parts of the district. The pockets of very good GWPZs have been observed at the Binpur-I (fractures and weathered zones within the crystalline rocks could contribute to localized areas with good groundwater potential), Jamboni (Fractured zones within crystalline rocks and alluvial deposits in valleys could serve as potential groundwater zones), Gopiballavpur II (areas with well-developed fractures, weathered zones, and regions with enhanced porosity) and Sankrail (hilly terrain to relatively flat areas) Block of the district ().
Figure 4. Map showing the spatial distribution of groundwater potential zones in Jhargram district.
4.9. Spatial association based on hot spot analysis
The spatial autocorrelation reports reveal that the z-score of 15.860693 corresponds to a statistically significant model cluster, as evidenced by a Moran’s Index value of 0.763468 and a p-value of 0.000000 (). The z-score and p-value obtained indicate the presence of spatial clustering for attributes with either high or low values. Hot spot analysis reveals seven hot spots, three cold spots, and one no-significant spot, with 99%, 95%, and 90% confidence levels, respectively (). The study area’s hot and cold spots map reveals a high hot spot zone in the middle and northern regions, with the highest groundwater level including Jamboni, Binpur-I, Sankrail and Gopiballavpur II block. Small hotspot patches surround the large hot spot area, with lower water depth. The largest cold spot zone is found in the north eastern region covering in almost part of Binpur-II areas, causing concern for groundwater levels and alarming water level fluctuations ().
Figure 5. (a) Spatial autocorrelation report, (b) zone of hot spot and cold spot.
4.10. Evaluation of GWPI map through well information
Scientific studies need validation. The Central Ground Water Board (CGWB) provided data from fifty-seven groundwater wells to validate the final groundwater potential zone (GWPZ). The well water level varies from 24 feet to 82 feet within the studied region (). The water level data which was collected from different wells within the districts were used to generate a water column map () in ArcGIS using the Inverse Distance Weighted tool. The receiver operating characteristic (ROC) is a commonly employed technique for assessing the precision of a model’s output (Mohammady et al. Citation2012; Ruidas et al. Citation2022). The study employs the Receiver Operating Characteristic (ROC) curve to analyze the precision of the Analytic Hierarchy Process (AHP) outcomes for GWPZ mapping utilizing GIS and hydrogeological data, evaluating the demarcated GWPZ. The area under the curve (AUC) in ROC analysis quantifies the level of accuracy of the proposed model. The groundwater data acquired from CGWB's numerous dug wells has been validated with GWPZ, and the AUC in the ROC method is 0.80, indicating that the model’s accuracy is 80%, making it a valuable tool for producing potential groundwater areas ().
Figure 6. Water column map with well distribution in Jhargram district.
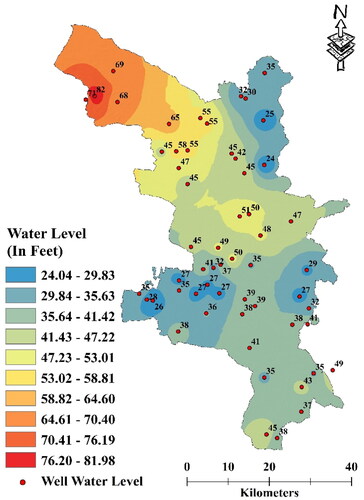
Figure 7. Receivers operating characteristic (ROC) curve showing the accuracy of the present study.
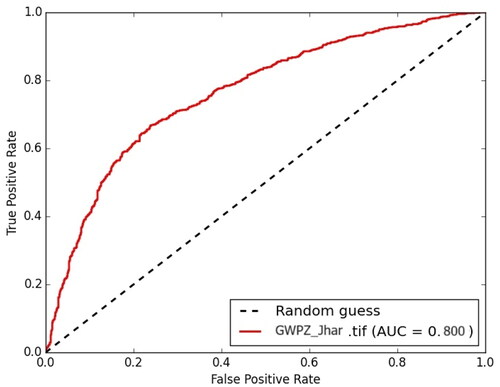
Table 4. Water level data below ground level in feet (fbgl) of some selected stations.
5. Conclusion
This study aims to demarcate groundwater potential zone in Jhargram district of West Bengal, India by employing Analytic Hierarchy Process (AHP) and Geographic Information System (GIS) approaches. In this research, the groundwater potential is delineated by incorporating several geological factors and hydrological parameters, such as hydrogeology, slope, lineament density, rainfall, drainage density, soil type, and landuse and cover, within the GIS environment. The final GWPZ map indicates that the study region was classified into five distinct areas, which included very high, high, moderate, low, and very low. The groundwater potential in Jhargram district ranges from 30.33% to 50.81%, indicating a moderate to good level. The basement crystalline complex lithology predominates in several parts of the district, making ground water availability in those parts extremely limited. Groundwater data obtained from several drilled wells of the CGWB in the study area has been validated with GWPZ, and the AUC in the ROC method is 0.80, indicating that the model’s accuracy is 80%. This study enhances understanding of Jhargram district’s groundwater resources, offering insights for sustainable water management and planning. The study underlines the significance of local geology and hydrogeological expertise in implementing approaches to avoid bias in the construction of groundwater potential zone maps. It implies that combining remote sensing and GIS technology with AHP and traditional approaches can increase accuracy while reducing reliance on any single method in determining groundwater potential zones. The utilization of GIS and remote sensing techniques has greatly improved groundwater exploration and has effectively limited the areas that require extensive hydrological surveys. Water policymakers and government officials can use the study’s maps to identify good locations for groundwater resource management projects like artificial recharge structures and new bore well drilling. Based on the findings of the study, a sustainable groundwater control strategy is proposed with the goals of reducing water scarcity in the Jhargram region, improving knowledge of water use, and restoring rehabilitate water-dependent ecosystems. Alterations to cropping patterns and mandatory rainwater collection from rooftops are two more ways that groundwater development could be further improved. The recommendations will help to secure the long-term sustainability of groundwater resources in the study area, thereby benefiting both the environment and the local communities.
Supplemental Material
Download MS Word (21.8 KB)Acknowledgement
This publication was supported by the Deanship of Scientific Research at the King Faisal University, Saudi Arabia (grant: 4,063).
Disclosure statement
No potential conflict of interest was reported by the author(s).
Data availability
Data available on request from the authors.
Additional information
Funding
References
- Achu AL, Anjali N, Gopinath G. 2022. Delineation of groundwater potential zones in a tropical river basin using geospatial techniques and analytical hierarchy process. In: Singh VP, Yadav S, Yadav KK, Corzo Perez GA, Muñoz-Arriola F, Yadava RN, editors. Application of remote sensing and GIS in natural resources and built infrastructure management. Cham: springer International Publishing. p. 259–278. doi:10.1007/978-3-031-14096-9_13.
- Agarwal R, Garg PK. 2015. Remote sensing and GIS based groundwater potential & recharge zones mapping using multi-criteria decision making technique. Water Resour Manage. 30(1):243–260. doi:10.1007/s11269-015-1159-8.
- Akinlalu AA, Adegbuyiro A, Adiat KAN, Akeredolu BE, Lateef WY. 2017. Application of multi-criteria decision analysis in prediction of groundwater resources potential: a case of Oke-Ana, Ilesa Area Southwestern, Nigeria. NRIAG J Astron Geophys. 6(1):184–200. doi:10.1016/j.nrjag.2017.03.001.
- Al-Abadi AM, Shahid S. 2015. A comparison between index of entropy and catastrophe theory methods for mapping groundwater potential in an arid region. Environ Monit Assess. 187(9):576. doi:10.1007/s10661-015-4801-2.
- Anbarasu S, Brindha K, Elango L. 2020. Multi-influencing factor method for delineation of groundwater potential zones using remote sensing and GIS techniques in the western part of Perambalur district, southern India. Earth Sci Inform. 13(2):317–332. doi:10.1007/s12145-019-00426-8.
- Arnous MO. 2016. Groundwater potentiality mapping of hard-rock terrain in arid regions using geospatial modelling: example from Wadi Feiran basin, South Sinai, Egypt. Hydrogeol J. 24(6):1375–1392. doi:10.1007/s10040-016-1417-8.
- Balamurugan P, Kumar PS, Shankar K. 2020. Dataset on the suitability of groundwater for drinking and irrigation purposes in the Sarabanga River region, Tamil Nadu, India. Data Brief. 29:105255. doi:10.1016/j.dib.2020.105255.
- Bello-Dambatta A, Farmani R, Javadi AA, Evans BM. 2009. The Analytical Hierarchy Process for contaminated land management. Adv Eng Inf. 23(4):433–441. doi:10.1016/j.aei.2009.06.006.
- Bera A, Mukhopadhyay BP, Das D. 2019. Landslide hazard zonation mapping using multi-criteria analysis with the help of GIS techniques: a case study from Eastern Himalayas, Namchi, South Sikkim. Nat Hazards. 96(2):935–959. doi:10.1007/s11069-019-03580-w.
- Bera B, Shit PK, Sengupta N, Saha S, Bhattacharjee S. 2021. Trends and variability of drought in the extended part of Chhota Nagpur plateau (Singbhum Protocontinent), India applying SPI and SPEI indices. Environ Challeng. 5:100310. doi:10.1016/j.envc.2021.100310.
- Bhadran A, Girishbai D, Jesiya NP, Gopinath G, Krishnan RG, Vijesh VK. 2022. A GIS based Fuzzy-AHP for delineating groundwater potential zones in tropical river basin, southern part of India. Geosyst Geoenviron. 1(4):100093. doi:10.1016/j.geogeo.2022.100093.
- Biswas T, Pal SC, Ruidas D, Islam ARMT, Saha A, Costache R, Shit M. 2023a. Modelling of groundwater potential zone in hard rock-dominated drought-prone region of eastern India using integrated geospatial approach. Environ Earth Sci. 82(3):81. doi:10.1007/s12665-023-10768-8.
- Biswas T, Pal SC, Saha A. 2023b. Hydro-chemical assessment of coastal groundwater aquifers for human health risk from elevated arsenic and fluoride in West Bengal, India. Mar Pollut Bull. 186:114440. doi:10.1016/j.marpolbul.2022.114440.
- Daliakopoulos IΝ, Coulibaly P, Tsanis IK. 2005. Groundwater level forecasting using artificial neural networks. J Hydrol. 309(1-4):229–240. doi:10.1016/j.jhydrol.2004.12.001.
- Dar IA, Sankar K, Dar MA. 2010. Remote sensing technology and geographic information system modeling: an integrated approach towards the mapping of groundwater potential zones in Hardrock terrain, Mamundiyar basin. J Hydrol. 394(3-4):285–295. doi:10.1016/j.jhydrol.2010.08.022.
- Das B, Pal SC, Malik S, Chakrabortty R. 2019. Modeling groundwater potential zones of Puruliya district, West Bengal, India using remote sensing and GIS techniques. Geol Ecol Landscapes. 3(3):223–237. doi:10.1080/24749508.2018.1555740.
- Das S. 2019. Comparison among influencing factor, frequency ratio, and analytical hierarchy process techniques for groundwater potential zonation in Vaitarna basin, Maharashtra, India. Groundwater Sustain Dev. 8:617–629. doi:10.1016/j.gsd.2019.03.003.
- Deng F, Deng Z, Lv D, Wang D, Duan H, Xing Z. 2016. Application of remote sensing and GIS analysis in groundwater potential estimation in west Liaoning Province, China. J Engineer Res. 4(3):1–17. https://kuwaitjournals.org/jer/index.php/JER/article/view/976
- Dinesan VP, Gopinath G, Ashitha MK. 2015. Application of geoinformatics for the delineation of groundwater prospects zones- a case study for Melattur Grama Panchayat in Kerala, India. Aquat Procedia. 4:1389–1396. doi:10.1016/j.aqpro.2015.02.180.
- Donahue RL, Miller RW, Shickluna JC. 1978. Soils – An introduction to soils and plant growth. Soil Sci. 125(4):271. doi:10.1097/00010694-197804000-00019.
- Ejepu JS, Jimoh MO, Abdullahi S, Mba MA. 2022. Groundwater Exploration using multi criteria decision analysis and analytic hierarchy process in federal capital territory, Abuja, Central Nigeria. IJG. 13(01):33–53. doi:10.4236/ijg.2022.131003.
- Foster SSD. 2001. The interdependence of groundwater and urbanisation in rapidly developing cities. Urban Water. 3(3):185–192. doi:10.1016/S1462-0758(01)00043-7.
- Ghosh PK, Bandyopadhyay S, Jana NC. 2015. Mapping of groundwater potential zones in hard rock terrain using geoinformatics: a case of Kumari watershed in western part of West Bengal. Model Earth Syst Environ. 2(1):1. doi:10.1007/s40808-015-0044-z.
- Godfray G, Tembo MM. 2022. Assessment of ground water potentiality in semi-arid area of central Tanzania. implication from geology and geomorphology of the dodoman supergroup. Geol Ecol Landscapes. 1–20. doi:10.1080/24749508.2022.2109833.
- Gopinath G, Seralathan P. 2004. Identification of groundwater prospective zones using irs-id liss iii and pump test methods. J Indian Soc Remote Sens. 32(4):329–342. doi:10.1007/BF03030858.
- Guchhait S, Dolui G, Das S, Das N. 2023. Chapter 15 - Groundwater fluctuation and agricultural insecurity: a geospatial analysis of West Bengal in India. In: Shit P, Bhunia G, Adhikary P, editors. Case studies in geospatial applications to groundwater resources. Elsevier. p. 275–288. doi:10.1016/B978-0-323-99963-2.00002-X.
- Hasanuzzaman M, Mandal MH, Hasnine M, Shit PK. 2022. Groundwater potential mapping using multi-criteria decision, bivariate statistic and machine learning algorithms: evidence from Chota Nagpur Plateau, India. Appl Water Sci. 12(4):58. doi:10.1007/s13201-022-01584-9.
- Holt CLR. 1965. Geology and water resources of Portage County, Wisconsin. U.S. Geological Survey. doi:10.3133/wsp1796.
- Jesiya NP, Gopinath G. 2019. A Customized FuzzyAHP - GIS based DRASTIC-L model for intrinsic groundwater vulnerability assessment of urban and peri urban phreatic aquifer clusters. Groundwater Sustain Dev. 8:654–666. doi:10.1016/j.gsd.2019.03.005.
- Jesiya NP, Gopinath G. 2020. A fuzzy based MCDM–GIS framework to evaluate groundwater potential index for sustainable groundwater management - A case study in an urban-periurban ensemble, southern India. Groundwater Sustain Dev. 11:100466. doi:10.1016/j.gsd.2020.100466.
- Jhariya DC, Kumar T, Gobinath M, Diwan P, Kishore N. 2016. Assessment of groundwater potential zone using remote sensing, GIS and multi criteria decision analysis techniques. J Geol Soc India. 88(4):481–492. doi:10.1007/s12594-016-0511-9.
- Krakauer NY, Li H, Fan Y. 2014. Groundwater flow across spatial scales: importance for climate modeling. Environ Res Lett. 9(3):034003. doi:10.1088/1748-9326/9/3/034003.
- Kumar KK, Patwardhan SK, Kulkarni A, Kamala K, Rao KK, Jones R. 2011. Simulated projections for summer monsoon climate over India by a high-resolution regional climate model (PRECIS). Current Science. 101(3):312–326.
- Kumari A, Singh A. 2021. Delineation of Groundwater Potential Zone using Analytical Hierarchy Process. J Geol Soc India. 97(8):935–942. doi:10.1007/s12594-021-1794-z.
- Madani A, Niyazi B. 2015. Groundwater potential mapping using remote sensing techniques and weights of evidence GIS model: a case study from Wadi Yalamlam basin, Makkah Province, Western Saudi Arabia. Environ Earth Sci. 74(6):5129–5142. doi:10.1007/s12665-015-4524-2.
- Magesh NS, Chandrasekar N, Soundranayagam JP. 2012. Delineation of groundwater potential zones in Theni district, Tamil Nadu, using remote sensing, GIS and MIF techniques. Geosci Front. 3(2):189–196. doi:10.1016/j.gsf.2011.10.007.
- Mahmoud SH, Alazba AA. 2016. Integrated remote sensing and GIS‐based approach for deciphering groundwater potential zones in the central region of Saudi Arabia. Environ Earth Sci. 75(4):344. doi:10.1007/s12665-015-5156-2.
- Maity DK, Mandal S. 2017. Identification of groundwater potential zones of the Kumari river basin, India: an RS & GIS based semi-quantitative approach. Environ Dev Sustain. 21(2):1013–1034. Mismatch] doi:10.1007/s10668-017-0072-0.
- Mall RK, Gupta A, Singh R, Singh RS, Rathore LS. 2006. Water resources and climate change: an Indian perspective. Current Sci. 90(12):1610–1626.
- Manap MA, Sulaiman WNA, Ramli MF, Pradhan B, Surip N. 2013. A knowledge-driven GIS modeling technique for groundwater potential mapping at the Upper Langat Basin, Malaysia. Arab J Geosci. 6(5):1621–1637. doi:10.1007/s12517-011-0469-2.
- Miraki S, Zanganeh SH, Chapi K, Singh VP, Shirzadi A, Shahabi H, Pham BT. 2018. Mapping groundwater potential using a novel hybrid intelligence approach. Water Resour Manage. 33(1):281–302. doi:10.1007/s11269-018-2102-6.
- Mishra RK. 2023. Fresh Water availability and Its Global challenge. BJMAS. 4(3):1–78. doi:10.37745/bjmas.2022.0208.
- Mogaji KA. 2016. Combining geophysical techniques and multi-criteria GIS-based application modeling approach for groundwater potential assessment in southwestern Nigeria. Environ Earth Sci. 75(16):1181. doi:10.1007/s12665-016-5897-6.
- Mohammady M, Pourghasemi HR, Pradhan B. 2012. Landslide susceptibility mapping at Golestan Province, Iran: a comparison between frequency ratio, Dempster–Shafer, and weights-of-evidence models. J Asian Earth Sci. 61:221–236. doi:10.1016/j.jseaes.2012.10.005.
- Moharir KN, Pande CB, Gautam VK, Singh SK, Rane NL. 2023. Integration of hydrogeological data, GIS and AHP techniques applied to delineate groundwater potential zones in sandstone, limestone and shales rocks of the Damoh district, (MP) central India. Environ Res. 228:115832. doi:10.1016/j.envres.2023.115832.
- Moiwo JP, Yang Y, Li H, Han S, Yang Y. 2010. Impact of water resource exploitation on the hydrology and water storage in Baiyangdian Lake. Hydrol Processes. 24(21):3026–3039. doi:10.1002/hyp.7716.
- Mukherjee I, Singh UK. 2018. Groundwater fluoride contamination, probable release, and containment mechanisms: a review on Indian context. Environ Geochem Health. 40(6):2259–2301. doi:10.1007/s10653-018-0096-x.
- Murmu P, Kumar M, Lal D, Sonker I, Singh SK. 2019. Delineation of groundwater potential zones using geospatial techniques and analytical hierarchy process in Dumka district, Jharkhand, India. Groundwater Sustain Dev. 9:100239. doi:10.1016/j.gsd.2019.100239.
- Naghibi SA, Pourghasemi HR, Dixon BM. 2015. GIS-based groundwater potential mapping using boosted regression tree, classification and regression tree, and random forest machine learning models in Iran. Environ Monit Assess. 188(1):44. doi:10.1007/s10661-015-5049-6.
- Naghibi SA, Vafakhah M, Hashemi H, Pradhan B, Alavi SJ. 2018. Groundwater augmentation through the site selection of floodwater spreading using a data mining approach (case study: mashhad Plain, Iran). Water. 10(10):1405. doi:10.3390/w10101405.
- Naidoo S, Olaniran AO. 2014. Treated Wastewater Effluent as a Source of Microbial Pollution of Surface Water Resources. Int J Environ Res Public Health. 11(1):249–270. doi:10.3390/ijerph110100249.
- Pande CB, Moharir KN, Panneerselvam B, Singh SK, Elbeltagi A, Pham QB, Varade AM, Rajesh J. 2021. Delineation of groundwater potential zones for sustainable development and planning using analytical hierarchy process (AHP), and MIF techniques. Appl Water Sci. 11(12):1–20. doi:10.1007/s13201-021-01522-1.
- Pandey HK, Singh VK, Singh SK. 2022. Multi-criteria decision making and Dempster-Shafer model–based delineation of groundwater prospect zones from a semi-arid environment. Environ Sci Pollut Res. :1–19.
- Paneerselvam B, Ravichandran N, Li P, Thomas M, Charoenlerkthawin W, Bidorn B. 2023. Machine learning approach to evaluate the groundwater quality and human health risk for sustainable drinking and irrigation purposes in South India. Chemosphere. 336:139228. doi:10.1016/j.chemosphere.2023.139228.
- Panneerselvam B, Karuppannan S, Muniraj K. 2020. Evaluation of drinking and irrigation suitability of groundwater with special emphasizing the health risk posed by nitrate contamination using nitrate pollution index (NPI) and human health risk assessment (HHRA). Hum Ecolog Risk Assess International J. 27(5):1324–1348. doi:10.1080/10807039.2020.1833300.
- Panneerselvam B, Muniraj K, Duraisamy K, Pande C, Karuppannan S, Thomas M. 2023. An integrated approach to explore the suitability of nitrate-contaminated groundwater for drinking purposes in a semiarid region of India. Environ Geochem Health. 45(3):647–663. doi:10.1007/s10653-022-01237-5.
- Panneerselvam B, Muniraj K, Pande C, Ravichandran N. 2023. Prediction and evaluation of groundwater characteristics using the radial basic model in Semi-arid region, India. Inter J Environ Analyt Chem. 103(6):1377–1393. doi:10.1080/03067319.2021.1873316.
- Park S, Hamm S-Y, Jeon H-T, Kim J. 2017. Evaluation of logistic regression and multivariate adaptive regression spline models for groundwater potential mapping using R and GIS. Sustainability. 9(7):1157. doi:10.3390/su9071157.
- Pourtaghi ZS, Pourghasemi HR. 2014. GIS-based groundwater spring potential assessment and mapping in the Birjand Township, southern Khorasan Province, Iran. Hydrogeol J. 22(3):643–662. doi:10.1007/s10040-013-1089-6.
- Roy P, Pal SC, Chakrabortty R, Chowdhuri I, Saha A, Shit M. 2022. Climate change and groundwater overdraft impacts on agricultural drought in India: vulnerability assessment, food security measures and policy recommendation. Sci Total Environ. 849:157850. doi:10.1016/j.scitotenv.2022.157850.
- Ruidas D, Pal SC, Islam T, Md AR, Saha A. 2022. Hydrogeochemical evaluation of groundwater aquifers and associated health hazard risk mapping using ensemble data driven model in a water scares plateau region of Eastern India. Expo Health. 15(1):113–131. doi:10.1007/s12403-022-00480-6.
- Saha S. 2017. Groundwater potential mapping using analytical hierarchical process: a study on Md. Bazar Block of Birbhum District, West Bengal. Spat Inf Res. 25(4):615–626. doi:10.1007/s41324-017-0127-1.
- Sankar K, Karunanidhi D, Kalaivanan K, Subramani T, Shanthi D, Balamurugan P. 2023. Integrated hydrogeophysical and GIS based demarcation of groundwater potential and vulnerability zones in a hard rock and sedimentary terrain of Southern India. Chemosphere. 316:137305. doi:10.1016/j.chemosphere.2022.137305.
- Saaty TL. 1980. The analytical hierarchy process, planning, priority. Pittsburgh: RWS publications. New York, NY: McGraw-Hill.
- Saaty TL. 1990a. Eigenvector and logarithmic least squares. Eur J Oper Res. 48(1):156–160. doi:10.1016/0377-2217(90)90073-K.
- Saaty TL. 1990b. How to make a decision: the analytic hierarchy process. Eur J Oper Res. 48(1):9–26. doi:10.1016/0377-2217(90)90057-I.
- Senapati U, Das TK. 2021. Assessment of basin-scale groundwater potentiality mapping in drought-prone upper Dwarakeshwar River basin, West Bengal, India, using GIS-based AHP techniques. Arab J Geosci. 14(11):960. doi:10.1007/s12517-021-07316-8.
- Shaji E, Santosh M, Sarath KV, Prakash P, Deepchand V, Divya BV. 2021. Arsenic contamination of groundwater: a global synopsis with focus on the Indian Peninsula. Geosci Front. 12(3):101079. doi:10.1016/j.gsf.2020.08.015.
- Shao Z, Huq M, Cai B, Altan O, Li Y. 2020. Integrated remote sensing and GIS approach using Fuzzy-AHP to delineate and identify groundwater potential zones in semi-arid Shanxi Province, China. Environ Modell Softw. 134:104868. doi:10.1016/j.envsoft.2020.104868.
- Shelar RS, Shinde SP, Pande CB, Moharir KN, Orimoloye IR, Mishra AP, Varade AM. 2022. Sub-watershed prioritization of Koyna river basin in India using multi criteria analytical hierarchical process, remote sensing and GIS techniques. Phys Chem Earth Parts A/B/C. 128:103219. doi:10.1016/j.pce.2022.103219.
- Shiferaw B, Reddy VR, Wani SP. 2008. Watershed externalities, shifting cropping patterns and groundwater depletion in Indian semi-arid villages: the effect of alternative water pricing policies. Ecol Econ. 67(2):327–340. doi:10.1016/j.ecolecon.2008.05.011.
- Sikakwe GU. 2023. Mineral exploration employing drones, contemporary geological satellite remote sensing and geographical information system (GIS) procedures: a review. Remote Sens Appl: soc Environ. 31:100988. doi:10.1016/j.rsase.2023.100988.
- Strahler AN. 1952. Hypsometric (area-altitude) analysis of erosional topography. Geol Soc America Bull. 63(11):1117. doi:10.1130/0016-7606(1952)63[1117:HAAOET]2.0.CO;2.
- Suryanarayana C, Sudheer C, Mahammood V, Panigrahi BK. 2014. An integrated wavelet-support vector machine for groundwater level prediction in Visakhapatnam India. Neurocomputing. 145:324–335. doi:10.1016/j.neucom.2014.05.026.
- Swetha TV, Gopinath G, Thrivikramji KP, Jesiya NP. 2017. Geospatial and MCDM tool mix for identification of potential groundwater prospects in a tropical river basin, Kerala. Environ Earth Sci. 76(12):428. doi:10.1007/s12665-017-6749-8.
- Tahmassebipoor N, Rahmati O, Noormohamadi F, Lee S. 2015. Spatial analysis of groundwater potential using weights-of-evidence and evidential belief function models and remote sensing. Arab J Geosci. 9(1):79. doi:10.1007/s12517-015-2166-z.
- Thakur JK, Singh SK, Ekanthalu VS. 2017. Integrating remote sensing, geographic information systems and global positioning system techniques with hydrological modeling. Appl Water Sci. 7(4):1595–1608. doi:10.1007/s13201-016-0384-5.
- Torabi Haghighi A, Abou Zaki N, Rossi PM, Noori R, Hekmatzadeh AA, Saremi H, Kløve B. 2020. Unsustainability syndrome—from meteorological to agricultural drought in arid and semi-arid regions. Water. 12(3):838. doi:10.3390/w12030838.
- Tucker GE, Catani F, Rinaldo A, Bras RL. 2001. Statistical analysis of drainage density from digital terrain data. Geomorphology. 36(3-4):187–202. doi:10.1016/S0169-555X(00)00056-8.
- Wang Y, Li R, Wu X, Yan Y, Wei C, Luo M, Xiao Y, Zhang Y. 2023. Evaluation of groundwater quality for drinking and irrigation purposes using GIS-Based IWQI, EWQI and HHR model. Water. 15(12):2233. doi:10.3390/w15122233.
- Yesilnacar MI, Gulluoglu MS. 2008. Hydrochemical characteristics and the effects of irrigation on groundwater quality in Harran Plain, GAP Project, Turkey. Environ Geol. 54(1):183–196. doi:10.1007/s00254-007-0804-9.