
 ?Mathematical formulae have been encoded as MathML and are displayed in this HTML version using MathJax in order to improve their display. Uncheck the box to turn MathJax off. This feature requires Javascript. Click on a formula to zoom.
Abstract
Currently, the inversion of remote sensing satellite images of water environment indicators mostly stays in the indicators with active optical characteristics, while there is less research on the inversion of most water quality indicators with non-optical activity properties, weak scattering and absorption of optical radiation, the size of their concentration has little effect on the spectral characteristics of the water body, such as TOC(Total Organic Carbon). In this paper, based on Pingzhai Reservoir, a dammed river in the karst mountainous area, the inversion model of TOC concentration was established based on BP neural network (BPNN) and sentinel-2 satellite remote sensing images. The results showed that the single bands with high correlation with the measured TOC concentration data were two vegetation red-edge bands B6 (740 nm) and B7 (783 nm) and one NIR band B8 (842 nm), and finally b7, b6 + b7, b7 + b8, b7 × b8 were selected as the input layers of BPNN for modeling through the combination of the bands, and their Pearson’s coefficients were −0.667, −0.656, −0.655, − 0.675.The inverse model established could reach a minimum RMSE of 0.235 mg/L and a maximum R2 of 0.889, which was superior to that of the conventional empirical model. Demonstrate the feasibility of a TOC inversion method based on Sentinel-2 data and BPNN to monitor TOC concentrations in Pingzhai Reservoir. The study successfully established a BP neural network inversion model of TOC concentration in Pingzhai Reservoir with low error, meanwhile, we analyzed the correlation between common water quality indicators and TOC in the reservoir, in which TOC showed significant positive correlation with WT and significant negative correlation with TN and EC, with Pearson’s coefficients of 0.655, −0.666, and −0.393, respectively. The article provides scientific theoretical foundation and technical support for water quality protection of water sources.
1. Introduction
Total organic carbon (TOC) is the total amount of organic carbon present in a water body and consists of organic matter containing elemental carbon. In water bodies, organic carbon can come from natural sources, such as decomposition products of plants, animal remains and excreta, or from anthropogenic activities, such as wastewater discharge and the use of agricultural fertilizers.
TOC is an important indicator in water quality assessment and monitoring and reflects the extent and distribution of organic pollutants in a water body (Wang et al. Citation2019). Higher TOC concentrations may indicate the presence of organic pollutants that maypotentially impact aquatic ecosystems and human health (Fu G et al. Citation2020). Therefore, monitoring and analyzing TOC concentrations in water bodies can help assess the health of water bodies and guide environmental protection and water resource management efforts. Conventional TOC measurements usually involve field sampling and the oxidation of organic carbon in water samples to carbon dioxide via a TOC analyzer, and the concentration of TOC is determined by measuring the amount of carbon dioxide produced (Qing-bo et al. Citation2022). Determining the concentration of TOC using traditional methods has the disadvantages of being time-consuming, costly, and unable to sample continuously. With the development of remote sensing technology and the continuous use of remote sensing satellites in various countries, ground information can be obtained continuously and over a large area, and the inversion of water quality parameters through remote sensing satellite images has received increasing attention from scholars at China and other countries.
At present, Yunfang Zhu et al. (Citation2017) established a BPNN inversion model for Chla in Lake Taihu with R2 as high as 0.968 by using different band combinations of GF-1 WFV satellite remote sensing images and finally taking band combinations with higher correlation coefficients, such as b4/b3, b4/b2, b4/b1 and b4/(b1 + b2 + b3), as the input layer. BPNN, or BP neural network, is a form of supervised learning that mimics the human process of neuron activation and transmission by mapping input data to output data through connections and computations between multiple layers of neurons. Moreover, the proposed model was compared with the established band ratio model to determine the feasibility of the BP neural network for inland lake inversion of water quality parameters and for improving its accuracy. In her study, BPNN was also used for the construction of inversion models and achieved high accuracy. Siyuan Wang and others (Wang S et al. Citation2022) used four rivers in the alpine region of the Tibetan Plateau, namely, the Yarlung Tsangpo, Lancang, Jinsha, and Nujiang Rivers, as the study area and combined Sentinel-2 satellite data from different seasons with field-measured data. Several regression methods and physical models have been proposed to monitor several important water environment indicators, such as turbidity (Turb), total nitrogen (TN), total phosphorus (TP), and total organic matter (TOC), in rivers to capture the spatial heterogeneity of alpine water environments. In his study, the same sentinel-2 remote sensing imagery was used with some success for inverse modeling of selected non-optically active water quality parameters in highland rivers. Based on Sentinel-3 OLCI images and measured transparency values synchronized with images, Jiang Lingling et al. (Ling-ling et al. Citation2022) established a hybrid band model of transparency inversion in the Bohai Sea with B6 (560 nm) and B7 (620 nm) as sensitivity factors, which provides a reliable theoretical basis for remote sensing estimations of ocean transparency, and in her research, she utilized Pearson’s coefficient to find the bands with higher correlation with water quality parameters to construct the inversion model, and finally successfully constructed the Bohai Sea transparency inversion model. With the continuous development of "3S"(RS, GIS, GPS) technology and the continuous application of various remote sensing satellites, the inversion of water quality parameters in inland water bodies has been developed from suspended solids (Cheng et al. Citation2023), Chla (Wang J et al. Citation2023), transparency (Cui et al. Citation2022) to ammonia nitrogen (Dong et al. Citation2020), COD (Ai-min et al. Citation2023), total phosphorus and total nitrogen (Shang et al. Citation2021) and other indices, and the study area has also been developed from inland lakes (Zhou S et al. Citation2023) and rivers (Zhu X et al. Citation2023) to areas such as oceans (Jiang Z et al. Citation2022). However, there are fewer studies on remote sensing inversion of water body TOC concentrations in karst plateau lakes, and exploring the spectral reflectance characteristics of karst wetland water bodies and capturing their sensitive spectral bands are key to estimating water body parameters using remote sensing (Fu B et al. Citation2023).
To summarize, in the field of remote sensing water quality index inversion, there has been continuous development and progress in terms of the data source, study area, number of inversion indices, and inversion accuracy, but there are fewer studies on the inversion of organic and inorganic carbon in water. Moreover, the Pingzhai Reservoir is located in the high-elevation and humid Guizhou Karst region, where carbonates are widely distributed, the water body is alkaline, and the water body is highly sensitive to nutrients (Yan Zou et al. Citation2023); moreover, phenomena such as domestic life around the reservoir and agricultural pollution can lead to eutrophication of the water body (Jie et al. Citation2021). Therefore, the purpose of this article is to identify bands and combinations of bands with high correlation coefficients with the TOC concentration in water bodies through Sentinel-2 remote sensing satellite images and field measurement data, establish an inverse model of the TOC concentration in the Pingzhai Reservoir through the BP neural network, and simulate and calculate the TOC concentration in the Pingzhai Reservoir to provide theoretical and technological support for the management of water resources in water source areas as well as for the safety of water quality.
2. Materials and methods
2.1. Overview of the study area
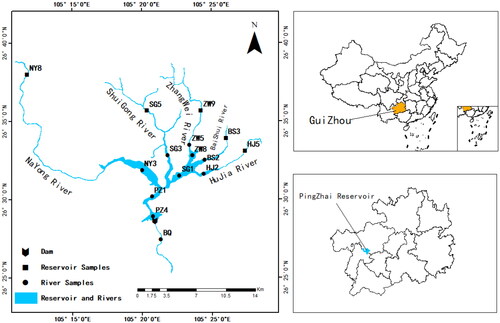
Pingzhai Reservoir is located in the karstic mountainous area in northwestern Guizhou Province. The reservoir has geographic coordinates of 105°17'57″∼105°20'50″, 26°28′ 27″∼26° 34′ 28″ at the junction of Zhijin County, Nayong County and the Liuzhi Special Zone and is the headwater reservoir of the Qianzhong Water Conservancy Hub Project. Pingzhai Reservoir is located in a karst area, where about a quarter of the world’s population relies on karst water to a greater or lesser extent, and more than 100 million people live in karst areas in southern China alone. Karst water plays an important role in providing water and maintaining ecological balance, but the thin soil layer in karst areas, coupled with highly developed karst fissures and underground river piping systems, make karst aquifers extremely vulnerable to pollution (Musgrove et al. Citation2016). As one of the drinking water reservoirs in Guizhou Province, it is particularly important to maintain and protect its water quality, and TOC concentration in lakes is an important indicator for monitoring the discharge of organic pollutants. Therefore, it is important to determine the concentration of TOC in Pingzhai Reservoir. The Pingzhai Reservoir is dammed by the Nayong River, Shuigong River, Zhangwei River, Baishui River and Hujia River, with a total basin area of 834.45 km2, undulating terrain, slopes between 0° and 69°, elevations of 1,182–2,291 m, a normal storage level of 1,331 m, and a capacity of 1,089 m3. The Pingzhai Reservoir is located in the subtropical monsoon climate zone and has an average annual temperature of 14 °C and an average annual rainfall of 1,053.5 mm. The exposed strata in the reservoir area are dominated by Permian and Triassic systems, including the Longtan Formation (P3l), Yelang Formation (T1y), and Guanling Formation (T2g). The lithologies of the reservoir area are mainly cherts, dolomitic cherts and dolomites. The population distribution in the watershed is relatively dense, and the main townships include Zhangjiawan township, Baixing township, and Jichang township. Anthropogenic activities are the main source of water quality degradation (Aswathy et al. Citation2021), and similarly the activities of residents living along the riverbanks have inevitably impacted the Pingzhai Reservoir. In Yongrong Zhang’s study (Zhang Y et al. Citation2020), quantitative modeling showed that animal feces and human activities, such as straw burning in corn cultivation and coal mining along the banks of the river, were the factors that had the greatest impact on the water environment of the Pingzhai Reservoir.
2.2. Field measurement data
Based on the accessibility of the five confluent rivers of Pingzhai Reservoir and the mountain shadows at 45° solar altitude angle calculated by Arcgis and DEM data of the study area, a total of 15 sampling points were selected based on the principles of avoiding mountain shadows as much as possible and average distribution, and the locations are shown in . Water sample collection was carried out on November 19, 2022. During the collection process, the weather was good, clear and breezy; a boat was used to use a handheld GPS instrument to locate the water samples; a 500 ml polyethylene bottle was used for water sample collection approximately 0.5 m below the surface of the water surface at the location of the sampling point; and the water body pH, water temperature (WT), electrical conductance (EC) and dissolved oxygen (DO) were measured in the field using a WTW Multi3430 portable multiparameter water quality analyzer that has been repeatedly corrected in the laboratory using standard solutions to ensure its accuracy with an accuracy of 0.001 pH unit, 0.01 °C, 1μs/cm, and 0.01 mg/L, respectively.
Figure 1. Location of the Pingzhai Reservoir.
The collected water samples were put into polyethylene sampling bottles precleaned with deionized water and brought back to the laboratory for analysis. The TOC concentration was determined by the Total Organic Carbon Analyzer of Shimadzu Corporation (TOC-LCPH/CPN) via the “oxidative combustion infrared analysis,” and the maximum permissible error of the instrument was ±5%. Chla measurements were made by first filtering the water samples using a 0.45 μm filter membrane and freeze-thawing three times. The extract is then centrifuged and placed in a cold (−20 °C) refrigerator for 24 h before being filtered through a GF/F glass fiber membrane for Chla measurement. The filter membrane and extract were removed with 90% acetone (10 ml), and the supernatant was removed and placed in a cuvette. The absorbance was then measured using an RF-5301 spectrophotometer (Shimadzu, Japan). The concentration of Chla was calculated according to the Ministry of Environmental Protection. The formula is as EquationEquation (1)(1)
(1) . TN in water is determined by oxidizing ammonia, nitrite and most of the organic nitrogen compounds in water samples to nitrate in alkaline medium at 120 ∼ 124 °C using potassium persulfate as oxidizing agent. And then measured with the CleverChem Petro automatic petrochemical water quality analyzer of Germany DeChem-Tech Company, the instrument has been measured by the standard solution to get the total nitrogen standard curve for water quality analysis. The R2 of the standard curve of total nitrogen for water quality analysis was 0.9999.
(1)
(1)
where A630, A647, A664 and A750 are the absorbance at the wavelength of 630, 647, 664 and 750 nm, respectively. V1 and V2 are the volumes of the extract after constant volume and the water sample, and L is the optical path of the colorimeter.
2.3. Remote sensing data acquisition and processing
Sentinel-2 is a group of satellites developed and operated by the European Space Agency (ESA) to provide high-resolution, multispectral image data for surface observation with a revisit time of 5 days. It is equipped with a high-resolution multispectral imager, which makes Sentinel-2 widely applicable in the fields of monitoring vegetation, land use, vegetation health, water quality, agriculture, forest management, etc. The Sentinel-2 satellites can capture information in visible and near-infrared light through multiple wavelength bands, and it has 13 wavelength bands, including visible, near-infrared and shortwave infrared bands, etc. It covers the frequency band from 440 nanometers to 2200 nanometers. The Sentinel-2 data were obtained through the Copernicus-Open Access Center (https://scihub.copernicus.eu/). According to the information related to the data presented by the ESA, the Level 2 A data were preprocessed by radiometric correction, geometric correction and atmospheric correction by ESA, and the pixel values are ground reflectance data that can be used directly. Due to the cloudy and rainy weather in Guizhou Province, fewer effective remote sensing data are acquired; the remote sensing image data were acquired on November 19, 2022, the sampling date, which includes 60.22% cloud cover and 7.53% cloud shadow, and the area of the Pingzhai Reservoir is completely covered by clouds. Therefore, Sentinel-2 Level 2 A image data from November 2, 2022, which are quasisynchronized with the sampling date, are used in this article ().
Table 1. Parameters for each band of the Sentinel-2.
2.4. BP neural network
The backpropagation neural network (BPNN) is a common artificial neural network model. A BPNN usually consists of multiple layers divided into input, hidden and output layers. Each neuron is connected to all neurons in the previous layer, and each connection has a weight value at each connection (Zhang D et al. Citation2018). The training process of the BP neural network involves two phases: forward propagation and backpropagation. In the forward propagation phase, the network accepts the input data, calculates it by the weight value and passes it layer by layer to generate the final output. Then, the error between the output and the actual target is calculated, and optimization algorithms such as gradient descent are used in the back propagation order to adjust the weights to minimize the error (Wang J et al. Citation2021; He et al. Citation2021; Luan et al. Citation2022). The process of establishing the BP neural network is shown in . In this experiment, the input layer of the BPNN is the band or combination of bands with high correlation with the TOC concentration, and the output layer is the TOC concentration, so as to train the TOC inversion model.
Figure 2. BP neural network building process.
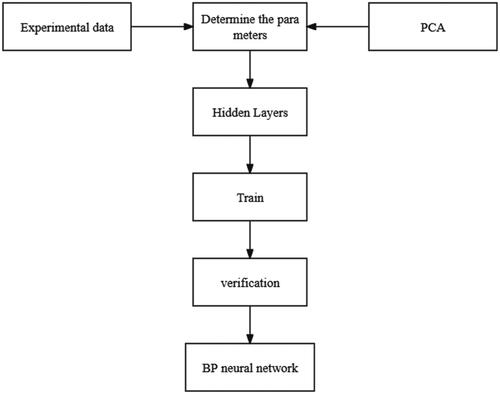
In this article, a neural network was constructed with MATLAB R2020a software. The number of intermediate layers is not exactly specified or calculated, the different numbers of intermediate layers will have an impact on the training of the model, which was determined in the study using empirical formula EquationEquation (2)(2)
(2) (Meng et al. Citation2023) in this article, and the final network structure was determined to be 4-10-1.
(2)
(2)
where nl is the number of layers in the hidden layer, n is the number of input layer layers, m is the number of output layers, and k is an integer between 1 and 10.
2.5. Evaluation of the accuracy of the BP neural network model
In this article, two indicators, RMSE (root mean square error) and R2 (coefficient of determination), were used to evaluate the accuracy and stability of the TOC concentration inversion model after model construction. The calculation formula is as follows:
(3)
(3)
(4)
(4)
where RMSE is the root mean square error, R2 is the coefficient of determination, Xmodel is the model-predicted value, XTOC is the measured TOC concentration at the sampling point, n is the total number of samples, and i is the sample number.
3. Results
3.1. Correlation analysis
The inversion of water quality indicators in inland water bodies is often carried out using bands in the visible to near-infrared range; therefore, this article used the b1–b8 bands of the Sentinel-2 MSI for analysis and research. The Pearson correlation coefficients of the eight bands and the measured TOC concentration data were analyzed using SPSS (), in which the b6, b7, and b8 bands had better correlations, with Pearson correlation coefficients of −0.643, −0.668, and −0.628, respectively, whereas the correlations of the b1, b2, b3, b4, and b5 bands were not good, with Pearson correlation coefficients of −0.301, −0.268, −0.414, −0.391, and −0.572, respectively.
Figure 3. Pearson correlation coefficients of sentinle-2 1-8 bands with TOC concentrations.
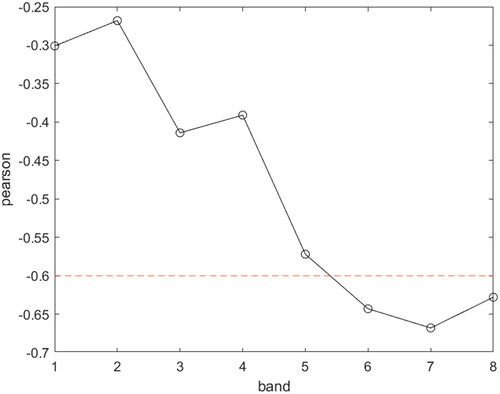
At the same time, this article tries to carry out different band combinations through the bands with higher correlation coefficients in an attempt to improve the correlation between the two; the band combinations b7 × b8 and b6 + b7 achieved greater correlation with the measured data, with Pearson’s correlation coefficients of −0.675 and −0.657, respectively, and the correlation coefficients of the single band and the combination of the bands are shown in .
Table 2. Pearson’s correlation coefficients of single band and band combinations with TOC concentrations.
3.2. Construction and validation of BPNN inversion models
In this article, we aim to establish an inversion model of TOC concentration with high accuracy and thus select b6 × b7, b7 × b8, and b7 + b8, which have the largest correlation coefficients, and the b7 band as the input layer of the BP neural network. Among the 15 sampling points, 9 sampling points, which were considered to be located in different watersheds, were selected to obtain their corresponding reflectance as the input layer, and the measured TOC concentration values (mg/L) corresponding to the sampling points were used as the output layer.
The intermediate layer of the BP neural network was repeatedly tested by EquationEquation (2)(2)
(2) , and it was finally determined that a hidden layer of 10 had better results, and the structure of the neural network was determined to be 4-10-1. Finally, the network was trained with MATLAB, and an inverse model of the TOC concentration was obtained.
Finally, after repeated training, the minimum RMSE (root mean square error) of the TOC concentration inversion model reaches 0.23548, and the maximum R2 (coefficient of determination) reaches 0.88952; these values can be used to predict the TOC concentration more accurately.
3.3. Empirical model
Based on the results of correlation analysis, B7 and B7 × B8 with the highest correlation were selected as independent variables in this paper in an attempt to construct an optimal TOC inversion model for Pingzhai Reservoir. In other scholars’ attempts to model TOC inversion for lakes and reservoirs in different regions, exponential, power function, linear, quadratic and multiple regression models showed good accuracy and stability (Kutser et al. Citation2015; Bonelli et al. Citation2022; Loaiza et al. Citation2023; Quevedo-Castro et al. Citation2024), especially in the study of Abdelmalik (Citation2018) TOC quadratic inversion modeling had an R2 as high as 0.985 and SEE (Standard Error of Estimation) is 0.909, which has better results. Therefore, in this article, five functions, namely, exponential, power, linear, quadratic as well as multiple regression functions are selected for modeling. The accuracy and stability of the empirical models were also judged using RMSE and R2, and the results are shown in . By comparison, the quadratic model among the models is the most effective, with the highest R2 0.457 and the lowest RMSE 0.330 mg/L in comparison with the other models.
Table 3. TOC concentration inversion empirical model parameters.
3.4. Comparison of different model prediction results
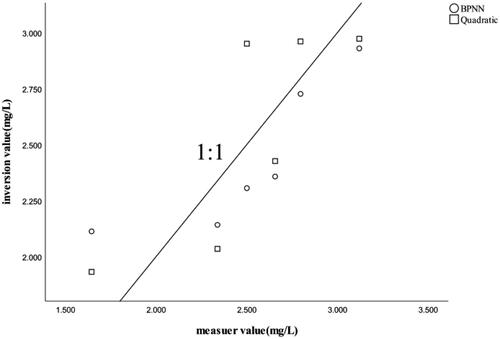
Simulation of the validation set using the established BP neural network inversion model. At the same time, predictions were made using the single-band quadratic model, which is the best performing of the empirical models. The results are shown in .
Table 4. Comparison of BPNN and quadratic TOC concentration inversion modeling results.
It can be seen that the BP neural network inversion results are better than the quadratic inversion model. The average relative error in the BP neural network inversion results is 9.37%, while the average relative error in the quadratic model inversion results is 11.06%. shows a scatter plot of the results of the two.
Figure 4. Scatterplot of simulated values of BPNN versus quadratic TOC concentration inversion models.
3.5. Spatial distribution of TOC in the Pingzhai Reservoir
Using the same period of Sentinel-2 Level 2 A data, a mask was used to extract the Pingzhai Reservoir area and obtain the corresponding bands, and the BPNN TOC concentration inversion model was used to simulate and calculate the total TOC concentration in the Pingzhai Reservoir, which was 0.5316 ∼ 3.3186 mg/L. The spatial distribution of the symbols in ArcGIS software was determined for rendering, as shown in .
Figure 5. BPNN TOC concentration inversion model simulation results.
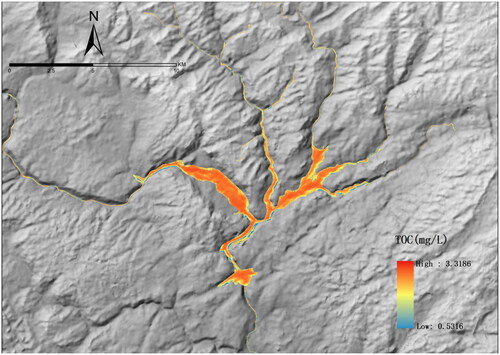
The results show that the Pingzhai Reservoir generally has higher TOC concentrations in the more open center of the reservoir area and lower TOC concentrations upstream of each inlet river. This is mainly because the center of the reservoir area is deep and has a wide and slow water flow rate, and the five rivers converge into the reservoir area because of the accumulation of organic carbon, which results in high TOC concentrations. On the other hand, the Shuigong River, Hujia River and Baishui River, which are narrower, have faster flow speeds, do not easily accumulate and have lower TOC concentrations.
4. Discussion
The change in TOC concentration in a water body is influenced by a variety of factors, and the TOC concentration data and related physical and chemical indicators of the water body are used for correlation analysis; the results are shown in . The TOC concentration was significantly negatively correlated with TN and EC, the water temperature was significantly positively correlated, and the Chla concentration, pH, and DO were not significantly positively correlated. We will interpret four water quality parameters that have high correlation with TOC concentration in Pingzhai Reservoir, which are WT, EC, TN, and Chla.
Table 5. Correlation of TOC concentration with other water quality parameters.
4.1. Relationship between water temperature and TOC
The extremely positive correlation which pearson’s coefficient of −0.655 between the TOC concentration and water temperature indicates that temperature is an important factor affecting the TOC concentration, which is the same result obtained by Fu et al. (Citation2022) in the study conducted on the relationship between water quality parameters and hydrometeorological factors, where the water temperature has a greater impact on both optically active and non-optical water quality indicators, becoming one of the factors that have a more prominent impact on the water quality indicators, and therefore, TOC receives a greater impact from the water temperature. As the same time, it is also a same results of studies related to the biological carbon pumping effect of karst rivers carried out by Han Cuihong et al. (Citation2020), on the Pingzhai Reservoir and Hongfeng Lake, when the water temperature is high, the biological carbon pumping effect of the reservoir is stronger, and aquatic organisms absorb and utilize more inorganic carbon to form organic carbon. Water temperature can affect the TOC concentration by influencing the photosynthesis and carbon sequestration efficiency of aquatic plants and animals. A higher temperature increases the activity of carbonic anhydrase in aquatic phytoplankton and plants, and the ability of algae and microorganisms to absorb and utilize inorganic carbon to form organic carbon increases, which enhances the concentration of TOC (Zhang Z et al. Citation2013).
4.2. Relationship between electrical conductance and TOC
A significant negative correlation was observed between the rate of arrival and TOC concentration with a Pearson’s coefficient of −0.393. The EC is a water quality parameter reflecting the difficulty of determining charge mobility and is usually related to the concentration of salt in the water body as well as the concentration of other soluble substances. concentration of other soluble substances. In the study area, more precipitation in summer results in more obvious dilution effects; additionally, more photosynthesis and metabolism by aquatic plants increase the TOC concentration in the water body; and the consumption of nutrient salts during the growth of aquatic plants decreases the conductivity of the water body. At the same time the EC will change dynamically with the change of water temperature (Wiejaczka, Citation2015), so the TOC concentration and EC are significantly negatively correlated.
4.3. Relationship between total nitrogen and TOC
There was a highly significant negative correlation between TN and TOC concentrations with a Pearson’s coefficient of −0.666. Nitrogen is a nutrient that is highly needed for plant growth, and a reasonable nitrogen content has a greater impact on plant growth (Teng W et al. Citation2017). Huang Mingyu et al. (Huang MY et al. Citation2021) reported a significant positive correlation between TOC concentration and total nitrogen (TN) in a study of the distribution of total organic carbon in the Erhai Sea in 2021; this finding was inconsistent with the conclusion that the TOC concentration in the Pingzhai Reservoir exhibited a significant negative correlation with TN. This may be because Pingzhai Reservoir is in a state of high eutrophication, and in China, according to the surface water urban environmental functions and protection objectives, surface water according to the functional size is divided into I-V five categories, Pingzhai Reservoir, total nitrogen has exceeded the V water standards (2.0 mg/L), which is, becoming one of the main pollution factors (Jie et al. Citation2021). The mean total nitrogen concentration in the present study was measured to be 3.588 mg/l. Usually, nitrogen can promote the growth of algae in water bodies, but excessive nitrogen cannot promote the growth of algae well; thus, an increase in nitrogen content cannot have a more prominent effect on the growth of algae, and thus, an increase in total nitrogen does not have a large effect on the concentration of total organic carbon (TOC) in the Pingzhai Reservoir.
4.4. Relationship between Chla and TOC
There was a non-significant positive correlation between Chla and TOC concentration with a Pearson’s coefficient of 0.271. Zhang et al. (Zhang Z et al. Citation2013) reported a negative correlation between Chla and TOC concentration in their study of East Lake in 2013, which produced different conclusions from the positive correlation between TOC concentration and Chla concentration in the Pingzhai Reservoir. Similarly, Jiang Yeqing et al.(Jiang Y et al. Citation2022) noted that the carbon in the water body is not immediately affected by biological activities and that a certain amount of time is needed to produce the effect of aquatic plant activities on the carbon in the water body; therefore, the present paper showed that the Chla concentration in this article did not significantly correlate with the TOC concentration, possibly because of the lag effect of the Chla concentration on the TOC concentration. At the same time, it may also be affected by stronger karst development, complex geology of the hydrological environment and greater changes in aquatic plants due to recent and increasing eutrophication (Li Y et al. Citation2022).
5. Conclusion
Pingzhai Reservoir is the drinking water reservoir of Qianzhong Water Conservancy Hub, which is of great significance to the drinking water safety and ecological environment of Guizhou Province. In this study, a high-precision TOC concentration inversion model was successfully constructed using Sentinel-2 satellite remote sensing images and BPNN, which proved the potential application of multispectral satellite remote sensing images and neural networks in water environmental protection of karst plateau lakes. The following conclusions can be drawn.
Water samples were collected and correlation analyzed in Pingzhai Reservoir. The experimental results showed that the TOC concentration in the karst plateau lakes had high correlation with the vegetation red edge bands B6 (740 nm) and B7 (783 nm) and the NIR band B8 (842 nm) of Sentinel-2 MSI. A TOC concentration inversion model was built using B7, B7 + B8, B6 × B7, and B7 × B8 as input layers, and the model had an R2 of 0.889 and an RMSE of 0.235 mg/L. Five empirical models were also constructed using the best correlation, B7 and B7 × B8, and the best result was the quadratic model for a single band, which had an R2 of 0.457 and an RMSE of 0.330. The BP neural network model was overall better than the empirical model.
The relationship between TOC and other common water quality parameters was analyzed and explained by correlation analysis, in which TOC became significantly positively correlated with WT, and showed significant negative correlation with EC and TN, and their Pearson’s coefficients were 0.655, −0.666, and −0.393, respectively.
Through the BPNN TOC concentration inversion model, the TOC concentration map of Pingzhai Reservoir was successfully constructed, and its distribution characteristics and influencing factors were analyzed. Although this article successfully established a TOC concentration inversion model with high accuracy, there are still some limitations in the establishment of water quality inversion model for karst plateau lakes, due to the cloudy and rainy weather in Guizhou region, the remote sensing satellite images generally contain high cloudiness (Huang DH et al. Citation2021), therefore, the remote sensing images used in this article have a slightly larger distance between the date of acquisition and the actual sampling date, which may have an impact on the accuracy of the model establishment. At the same time, due to the large terrain undulation and complex environment leads to fewer sampling points. And in terms of model construction, the model needs to be improved again in the future in terms of model mechanism and functionality.
Authors’ contributions
Rukai Xie, Zhongfa Zhou, Jie Kong designed the research; Rukai Xie, Kong Jie, Yan Zou, Fuqiang Zhang, Li Li, Yanbi Wang, Cui Wang and Caixia Ding performed the field experiments and analyzed the data; Zhongfa Zhou provided financial and equipment. The first draft of the manuscript was written by Rukai Xie and all authors commented on previous versions of the manuscript. All authors read and approved the final manuscript.
Data availability of statement
All data generated or analyzed during this study are included in this published article.
Disclosure statement
No potential conflict of interest was reported by the author(s)
Additional information
Funding
References
- Abdelmalik KW. 2018. Role of statistical remote sensing for Inland water quality parameters prediction. Egyptian J Remote Sens Space Sci. 21(2):193–200. doi: 10.1016/j.ejrs.2016.12.002.
- Ai-Min L, Meng F, Guang-Duo Q, Hai-Long W, You-Cheng X. 2023. Water quality parameter COD retrieved from remote sensing based on convolutional neural network model. Spectrosc Spect Anal. 43(2):651–656.
- Aswathy TS, Achu AL, Francis S, Gopinath G, Joseph S, Surendran U, Sunil PS. 2021. Assessment of water quality in a tropical Ramsar wetland of southern India in the wake of COVID-19. Remote Sens Appl. 23:100604. doi: 10.1016/j.rsase.2021.100604.
- Bonelli AG, Loisel H, Jorge DSF, Mangin A, d‘Andon OF, Vantrepotte V. 2022. A new method to estimate the dissolved organic carbon concentration from remote sensing in the global open ocean. Remote Sens Environ. 281:113227. doi: 10.1016/j.rse.2022.113227.
- Cheng YU, Yi TANG, Yang PAN, Hong-Chen YI, Gu Y-p, Feng ZHU, Shi J-y 2023. Inversion of suspended sediment concentration in rivers of Suzhou based on UAV remote sensing and ensemble learning. China Environ Sci. 43(10):5235.
- Cui Y, Yan Z, Wang J, Hao S, Liu Y. 2022. Deep learning–based remote sensing estimation of water transparency in shallow lakes by combining Landsat 8 and Sentinel 2 images. Environ Sci Pollut Res Int. 29(3):4401–4413. doi: 10.1007/s11356-021-16004-9.
- Cuihong HAN, Hailong SUN, Yu WEI, Qian BAO, Hao YAN., others. 2020. Spatiotemporal variations of hydrochemistry in karst dammed rivers and carbon fertilization effect of biological carbon pump: a case study of Pingzhai Reservoir and Lake Hongfeng in Guizhou Province. J Lake Sci. 32(6):1683–1694. doi: 10.18307/2020.0610.
- Dong G, Hu Z, Liu X, Fu Y, Zhang W. 2020. Spatio-temporal variation of total nitrogen and ammonia nitrogen in the water source of the middle route of the South-to-North Water Diversion Project. Water. 12(9):2615. doi: 10.3390/w12092615.
- Fu G, Chen H, Zhang H, Bi W, Yang Y. 2020. Measurement of total organic carbon concentration in seawater based on ultraviolet three-dimensional fluorescence. Yi Qi Yi Biao Xue Bao/Chin J Sci Inst. 41:192–198.
- Fu B, Lao Z, Liang Y, Sun J, He X, Deng T, He W, Fan D, Gao E, Hou Q. 2022. Evaluating optically and non-optically active water quality and its response relationship to hydro-meteorology using multi-source data in Poyang Lake, China. Ecol Indic. 145:109675. doi: 10.1016/j.ecolind.2022.109675.
- Fu B, Li S, Lao Z, Yuan B, Liang Y, He W, Sun W, He H. 2023. Multi-sensor and multi-platform retrieval of water chlorophyll a concentration in karst wetlands using transfer learning frameworks with ASD, UAV, and Planet CubeSate reflectance data. Sci Total Environ. 901:165963. doi: 10.1016/j.scitotenv.2023.165963.
- He Y, Gong Z, Zheng Y, Zhang Y. 2021. Inland reservoir water quality inversion and eutrophication evaluation using BP neural network and remote sensing imagery: a case study of Dashahe reservoir. Water. 13(20):2844. doi: 10.3390/w13202844.
- Huang MY, Dou S, Yang S, Gao D, Zhang K, Dong Q. 2021. Spatial–temporal distribution characteristics and influencing factors of total organic carbon in Erhai Lake. Environ Sci Surv. 40:17–24.
- Huang DH, Zhou ZF, Peng RW, Zhu M, Yin LJ, Zhang Y, Xiao DN, Li QX, Hu LW, Huang YY. 2021. Challenges and main research advances of low-altitude remote sensing for crops in southwest plateau mountains. J Guizhou Norm Univ. 39:51–59.
- Jiang Y, He K, Li Y, Qin M, Cui Z, Zhang Y, Yao Y, Chen X, Deng M, Gray A, et al. 2022. Driving factors of total organic carbon in Danjiangkou reservoir using generalized additive model. Water. 14(6):891. doi: 10.3390/w14060891.
- Jiang Z, Song Z, Bai Y, He X, Yu S, Zhang S, Gong F. 2022. Remote sensing of global sea surface pH based on massive underway data and machine learning. Remote Sens. 14(10):2366. doi: 10.3390/rs14102366.
- Jie K, Zhongfa Z, Yusheng D, Yi J, Shaohui L. 2021. Using fractal interpolation to evaluate eutrophication at Pingzhai reservoir in Guizhou province. J Irrig Drain. 40(1):123–130.
- Kutser T, Verpoorter C, Paavel B, Tranvik LJ. 2015. Estimating lake carbon fractions from remote sensing data. Remote Sens Environ. 157(SI):138–146. doi: 10.1016/j.rse.2014.05.020.
- Li Y, Zhou Z, Kong J, Wen C, Li S, Zhang Y, Xie J, Wang C. 2022. Monitoring chlorophyll-a concentration in karst plateau lakes using Sentinel 2 imagery from a case study of pingzhai reservoir in Guizhou, China. Eur J Remote Sens. 55(1):1–19. doi: 10.1080/22797254.2022.2079565.
- Ling-Ling J, Long-Xiao W, Lin W, Si-Wen G, Jian-Quan Y. 2022. Research on remote sensing retrieval of Bohai Sea transparency based on sentinel-3 OLCI image. Spectrosc Spect Anal. 42(4):1209–1216.
- Loaiza JG, Rangel-Peraza JG, Monjardín-Armenta SA, Bustos-Terrones YA, Bandala ER, Sanhouse-García AJ, Rentería-Guevara SA. 2023. Surface water quality assessment through remote sensing based on the Box-Cox transformation and linear regression. Water. 15(14):2606. doi: 10.3390/w15142606.
- Luan K, Li H, Wang J, Gao C, Pan Y, Zhu W, Xu H, Qiu Z, Qiu C. 2022. Quantitative inversion method of surface suspended sand concentration in Yangtze Estuary based on selected hyperspectral remote sensing bands. Sustainability. 14(20):13076. doi: 10.3390/su142013076.
- Meng D, Mao J, Li W, Zhu S, Gao H. 2023. An integrated framework for remote sensing assessment of the trophic state of large lakes. Remote Sens. 15(17):4238. doi: 10.3390/rs15174238.
- Musgrove M, Opsahl SP, Mahler BJ, Herrington C, Sample TL, Banta JR. 2016. Source, variability, and transformation of nitrate in a regional karst aquifer: Edwards aquifer, central Texas. Sci Total Environ. 568:457–469. doi: 10.1016/j.scitotenv.2016.05.201.
- Qing-Bo L, Zhi-Qi B, Hou-Xin C, Jia-Ye L, Zhong-Kai S. 2022. Detection of total organic carbon in surface water based on UV-Vis spectroscopy. Spectrosc Spect Anal. 42(11):3423–3427.
- Quevedo-Castro A, Monjardín-Armenta SA, Plata-Rocha W, Rangel-Peraza JG. 2024. Implementation of remote sensing algorithms to estimate TOC, Chl-a, and TDS in a tropical water body; Sanalona reservoir, Sinaloa, Mexico. Environ Monit Assess. 196(2):175. doi: 10.1007/s10661-024-12305-x.
- Shang W, Jin S, He Y, Zhang Y, Li J. 2021. Spatial–temporal variations of total nitrogen and phosphorus in Poyang, Dongting and Taihu Lakes from Landsat-8 Data. Water. 13(12):1704. doi: 10.3390/w13121704.
- Teng W, Xue HE, Tong Y-p 2017. Transgenic approaches for improving use efficiency of nitrogen, phosphorus and potassium in crops. J Integ Agric. 16(12):2657–2673. doi: 10.1016/S2095-3119(17)61709-X.
- Wang C-F, Hu Z-L, Yang Z-J, Dan Y, Zhao P, Hao W-C, Nie X-F, Nie R, Xu LD, Liu DF. 2019. Analysis of total organic carbon source differences between new and old cascade reservoirs using carbon and nitrogen isotopes. Huan Jing ke Xue = Huanjing Kexue. 40(7):3039–3048.
- Wang S, Shen M, Liu W, Ma Y, Shi H, Zhang J, Liu D. 2022. Developing remote sensing methods for monitoring water quality of alpine rivers on the Tibetan Plateau. GISci Remote Sens. 59(1):1384–1405. doi: 10.1080/15481603.2022.2116078.
- Wang J, Tang J, Wang W, Wang Y, Wang Z. 2023. Quantitative retrieval of chlorophyll-a concentrations in the Bohai–Yellow sea using GOCI surface reflectance products. Remote Sensing. 15(22):5285. doi: 10.3390/rs15225285.
- Wang J, Wang W, Hu Y, Tian S, Liu D. 2021. Soil moisture and salinity inversion based on new remote sensing index and neural network at a salina-alkaline wetland. Water. 13(19):2762. doi: 10.3390/w13192762.
- Wiejaczka L. 2015. Reservoir-triggered distortion in the relation between water conductivity and river temperature. Water Resour. 42(3):362–370. doi: 10.1134/S0097807815030070.
- Yan Zou, Zhongfa Zhou, Jie Kong, Yongliu Li, Cui Wang, Chaocheng Wen, Jiangting Xie. 2023. Variation characteristics and influence mechanisms of TOC and TN in Karst reservoirs and inlet rivers. Earth Environ. 51(3):255.
- Zhang D, Lin J, Peng Q, Wang D, Yang T, Sorooshian S, Liu X, Zhuang J. 2018. Modeling and simulating of reservoir operation using the artificial neural network, support vector regression, deep learning algorithm. J Hydrol. 565:720–736. doi: 10.1016/j.jhydrol.2018.08.050.
- Zhang Y, Zhou Z, Zhang H, Dan Y. 2020. Quantifying the impact of human activities on water quality based on spatialization of social data: a case study of the Pingzhai Reservoir Basin. Water Supply. 20(2):688–699. doi: 10.2166/ws.2020.001.
- Zhang, Z, Meng P, Xu G, He Y, Zhang Z, Jiang Y. 2013. Temporal and spatial distribution of total organic carbon and its influence factors in East Lake. Environ Sci Technol. 36(6):110–114.
- Zhou S, Xiao M, Zhang J, Huang Y, Jin Z, Xiong B. 2023. Inversion of water quality by remote-sensing monitoring based on machine learning in complex freshwater environments. DWT. 291:20–31. doi: 10.5004/dwt.2023.29473.
- Zhu X, Wen Y, Li X, Yan F, Zhao S. 2023. Remote sensing inversion of typical water quality parameters of a complex river network: A case study of Qidong’s rivers. Sustainability. 15(8):6948. doi: 10.3390/su15086948.
- Zhu YF, Zhu L, Li JG, Chen Y, Zhang Y, Hou H, Ju X, Zhang Y. 2017. The study of inversion of chlorophyll a in Taihu based on GF-1 WFV image and BP neural network. Acta Sci Circum. 37(1):130–137.