
Abstract
Although glomerular filtration rate (GFR) in children can be measured using a gold-standard technique following injection of an exogenous marker, this invasive and cumbersome technique is not widely available and GFR is commonly estimated using serum levels of endogenous markers. Creatinine, urea, cystatin C, beta-trace protein, and beta-2 microglobulin are well-established endogenous markers of kidney function. These markers differ in site of production and effects of diet and medication, as well as renal-tubular handling and extra-renal elimination. For each marker, different methods are available for measurement. Importantly, the measurements of creatinine and cystatin C have recently been standardized with the introduction of international reference standards. In order to allow estimation of GFR from serum marker concentrations, different equations for estimated GFR (eGFR) have been developed in children, using simple or more complex regression strategies with gold standard GFR measurements as a dependent variable. As a rule, estimation strategies relying on more than one marker – either by calculating the average of single parameter equations or by using more complex equations incorporating several parameters – outperform eGFR estimations using only a single marker. This in-depth review will discuss the physiology, measurement and clinical use of creatinine, urea, cystatin C, beta-trace protein, and beta-2 microglobulin in children. It will also address the generation of eGFR equations in children and provide an overview of currently available eGFR equations for the pediatric age group.
Introduction
Knowledge about glomerular filtration rate (GFR) in children is essential for the identification of renal disease, for monitoring of the effect of interventions and disease progression, as well as for adequate drug dosing and monitoring of drug toxicity.
GFR describes the rate of fluid passage across the glomerular membrane. As the rate of glomerular filtration depends strongly on the blood flow through the renal arteries, an increase in cardiac output with physical growth is associated with an increase in GFR. Therefore, absolute GFR (in mL/min) in adults is much higher than in children. To correct for differences in body size, GFR in children is normalized to the body surface area of an average adult, i.e. 1.73 m2 and expressed in mL/min/1.73 m2.
Besides renal blood flow, the number of functioning nephrons is another important determinant of GFR. During fetal development, nephrons are formed until 32–36 weeks of gestation [Citation1], when the maximum number of nephrons has been formed. Although term neonates have the same number of nephrons as adults, their GFR is only around 20 mL/min/1.73 m2 [Citation2]. Maturation of the nephrons leads to a rapid rise in GFR in the first weeks of life [Citation3]. Between the age of 1 and 2 years, GFR reaches adult levels () [Citation4]. Premature neonates, who are born before nephrogenesis has been completed, have lower renal mass at birth. In these children, nephrogenesis continues for up to 40 days post-partum and leads to an increase in renal function [Citation5,Citation6]; still, extremely premature neonates may fail to achieve a normal number of nephrons.
Figure 1. Development of GFR with age. Presentation of 5th and 95th percentile of GFR measured by inulin clearance in healthy children. Data derived from Brodehl et al. [Citation4].
![Figure 1. Development of GFR with age. Presentation of 5th and 95th percentile of GFR measured by inulin clearance in healthy children. Data derived from Brodehl et al. [Citation4].](/cms/asset/36caa715-2fd7-47e0-956a-db30f6075b55/ilab_a_1427041_f0001_b.jpg)
As in adults, GFR in children can be measured by injecting an exogenous marker, which is inert and excreted exclusively via glomerular filtration. The golden standard technique for GFR measurement is the inulin clearance. During continuous infusion of inulin, a polyfructosan with a molecular weight of ca. 5000 Da, the GFR is calculated from inulin serum concentrations and inulin excretion in timed urine collections [Citation7]. This is a cumbersome procedure, and in particular timed urine collections pose a special problem in children who may not be continent. As an alternative, plasma disappearance techniques following a single injection of one of several exogenous markers, i.e. inulin [Citation8], iohexol [Citation9], 51Cr-EDTA [Citation10], 99mTc-DTPA [Citation11], and iothalamate [Citation12], can be used to measure GFR. Soveri et al. [Citation13] recently published a systematic review comparing the different techniques for measuring GFR and concluded that the plasma clearance of 51Cr-EDTA, iohexol and inulin is sufficiently accurate to measure GFR, while 99mTc-DTPA and iothalmate are only sufficiently accurate if performed as renal clearance with urine collection. While inulin is no longer available in many countries, iohexol, a radiocontrast agent administered at very low dose, is increasingly used. It can even be measured in capillary blood samples [Citation14,Citation15].
In clinical practice, GFR is often measured by creatinine clearance by relating serum creatinine levels to timed urinary creatinine excretion. Even in adults, where incontinence is no major issue, endogenous creatinine clearance is insufficiently accurate [Citation13] and should be abandoned [Citation16]. Instead, estimated GFR (eGFR) based on serum concentrations of endogenous markers is the recommended approach in international guidelines [Citation17,Citation18].
The scope of this review is to characterize endogenous markers of GFR currently available for clinical practice in pediatric populations. These markers will be explored for their biochemical and physiological characteristics relevant for the pediatric age group. Special emphasis will be given on how these markers can be used to estimate GFR in children.
Physiology of endogenous markers for kidney function
GFR can be estimated using endogenous serum markers. An ideal endogenous marker has the following properties:
Constant production rate;
High glomerular sieving coefficient, i.e. free passage across the glomerular wall [Citation19];
No protein binding;
Excretion exclusively by glomerular filtration, i.e. no extra-renal metabolism and no renal tubular secretion or re-absorption of the intact molecule;
Accurate measurement by automated assays at acceptable cost.
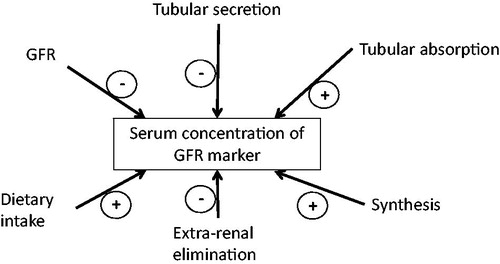
The serum concentration is determined by GFR, analytical variation, calibration of the assay as well as renal tubular and extra-renal mechanisms involved in accretion or elimination of the marker ().
Figure 2. Factors influencing serum concentrations of endogenous eGFR markers.
Several endogenous markers have been shown to meet many of the requirements for an endogenous GFR marker. Their characteristics are summarized in and will be discussed in more detail below.
Table 1. Characteristics of endogenous marker for kidney function.
Creatinine
Physiology
Creatinine is the most commonly used marker in children and adults alike. Creatinine originates from the creatine/phosphocreatine pathway. Creatine is synthesized in the kidneys and the liver [Citation20] and stored mainly in striated muscle cells [Citation21,Citation22], where it is phosphorylated to phosphocreatine by creatine kinase. In turn, phosphocreatine is used to phosphorylate ADP into ATP when energy demand is high. Both creatine and phosphocreatine spontaneously degrade to creatinine. Besides endogenous creatinine production, dietary intake of cooked meat and fish may contribute to the creatinine pool and affect serum creatinine levels. This also applies to creatine supplements [Citation23,Citation24].
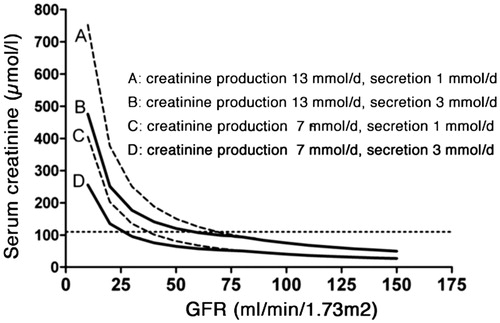
Creatinine is a small molecule with a molecular weight of 113 Da and an iso-electric point of 8.74. Creatinine is freely filtered across the glomerular membrane, making glomerular filtration the principal route of elimination. However, creatinine is also excreted by tubular secretion, the level of which is inversely related to GFR [Citation25,Citation26]. Drugs known to inhibit tubular creatinine secretion are trimethoprim, cimetidine, and fenofibrate. Their use may lead to higher creatinine concentrations that do not indicate a deterioration of glomerular filtration. As a result of tubular creatinine secretion, the rise in serum creatinine may be blunted until GFR has almost halved, a phenomenon denoted as “creatinine-blind range”. This is most prominent in children who have low muscle mass and physiologically low serum creatinine levels (). Conversely, if urine leaks into the abdomen or the perirenal space, creatinine will be re-absorbed and lead to falsely elevated serum concentrations [Citation27]. In patients with severe kidney failure, gut creatininase also contributes to creatinine excretion [Citation28], which can be inhibited by antibiotic therapy and lead to a rise in serum creatinine [Citation18].
Figure 3. Serum creatinine versus GFR for different rates of creatinine production and tubular secretion. By courtesy of Professor Jack F. M. Wetzels, Nijmegen (modified).
The volume of distribution of creatinine is total body water [Citation29]. Therefore, creatinine serum concentrations lag behind acute changes in GFR. This is most marked at low GFR when it may take several days until a new steady-state has been reached () [Citation30].
Figure 4. Model of changes in serum creatinine. Acute decrease in GFR by 25, 50 or 75% at 24 h. (a) baseline GFR 100 mL/min/1.73 m2, (b) baseline GFR 50 mL/min/1.73 m2. From Slort et al. [Citation30], used with permission.
![Figure 4. Model of changes in serum creatinine. Acute decrease in GFR by 25, 50 or 75% at 24 h. (a) baseline GFR 100 mL/min/1.73 m2, (b) baseline GFR 50 mL/min/1.73 m2. From Slort et al. [Citation30], used with permission.](/cms/asset/35946fd5-d96e-4bfb-8077-10d3bf5b6e8e/ilab_a_1427041_f0004_b.jpg)
Analytical methods
There are several methods of measuring creatinine. The most common and least expensive Jaffe method uses alkaline picrate, which changes to a red color in the presence of creatinine [Citation31]. This method is hampered by so-called noncreatinine chromogens, which are most relevant at the very low creatinine concentrations typically found in infants.
This problem is overcome when using enzymatic creatinine assays [Citation32–34]. Although comparative studies have shown that the enzymatic methods have less interference, the Jaffe method is still widely used, due to its low cost [Citation35–37].
Neonates in the first week of life have physiologically high serum bilirubin levels due to hemolysis of fetal erythrocytes, underdeveloped hepatic conjugating capacity and an increased enterohepatic cycle [Citation38]. Bilirubin absorbs light in roughly the same spectrum as the chromogens formed in the Jaffe reaction. In the alkaline milieu of the Jaffe reaction, bilirubin is oxidized to biliverdin, which causes a decrease in absorbance at the wavelength of 520 nm used to measure creatinine, while the creatinine-picrate chromogens cause an increase. This leads to underestimation of creatinine concentrations in patients with high bilirubin levels [Citation39]. This is even more so for premature infants. Fortunately enzymatic assays are far less subject to this interference [Citation40]. Therefore, the use of enzymatic tests for creatinine is mandatory in the neonatal period and should be used preferably in all children because of their lower muscle mass.
The SI unit of creatinine is µmol/L, while in many parts of the world, creatinine is reported in mg/dL (conversion SI × 0.0113 = mg/dL).
Reference values in children
Until the widespread implementation of isotope dilution mass spectroscopy (IDMS)-based calibration of creatinine measurement, reference values varied between hospitals. The use of the IDMS-based standard has allowed the establishment of uniform reference ranges over the whole age spectrum [Citation41]. Normal values for serum creatinine levels are highly age-dependent. Neonates have relatively high serum creatinine directly post-partum, reflecting maternal levels due to diaplacental exchange of creatinine [Citation42]. Serum creatinine then drops, reflecting low endogenous production in infancy, with the lowest normal values found at about 2 months of age. From then on serum creatinine levels rise steadily as a result of increasing muscle mass () [Citation43,Citation44]. Until puberty there is no clear gender-specific difference, while from the age of 14 normal values in male adolescents are higher than in females [Citation41]. As muscle mass in children is more closely linked to height as opposed to weight or body surface area [Citation45], eGFR equations based on creatinine use height as a correction factor.
Figure 5. Serum creatinine versus age. Data from Bökenkamp et al. [Citation43], used with permission.
![Figure 5. Serum creatinine versus age. Data from Bökenkamp et al. [Citation43], used with permission.](/cms/asset/c093ceb6-5b95-4e13-ab78-42f9118af582/ilab_a_1427041_f0005_b.jpg)
Unless detailed reference intervals per year of life are used, conversion of measured creatinine concentrations into a creatinine-based eGFR is mandatory for the recognition of impaired renal function in children [Citation17].
Considerations regarding the use in children
A major problem with estimating kidney function in the neonatal period is the diaplacental exchange of creatinine between mother and fetus. Because creatinine is a small molecule, it passes the placental wall freely, and there is a high correlation between maternal and neonatal serum levels [Citation42]. This precludes kidney function assessment using creatinine both in utero (using cord blood) [Citation46] and directly post-partum, when serum creatinine reflects the kidney function of the mother rather than the newborn. Creatinine is therefore a poor marker for acute kidney injury from perinatal asphyxia [Citation47]. It may take serial measurements during the first days of life to determine if the kidney function of a neonate is normal.
As in adults, muscle mass largely determines serum creatinine concentrations. This is most relevant for boys during adolescence. As the start of puberty varies by up to 5 years, purely age-related reference intervals may be misleading in patients with very early or late puberty. This may affect the early recognition of acute renal failure using the pediatric RIFLE (risk, injury, failure, loss, and end-stage renal failure) criteria [Citation48]. As the rise from a baseline creatinine concentration is one of the diagnostic criteria, early stages of acute kidney injury are easily missed if this crucial information is not available.
Other populations at risk when using creatinine are children with anorexia nervosa, malignancy, advanced liver disease or neuromuscular disease (e.g. muscle dystrophy, spina bifida) [Citation49]. Also in children after liver transplantation, GFR is overestimated when using creatinine [Citation50,Citation51]. This also applies to young children after transplantation of a kidney from an adult donor. These children have extremely low serum creatinine concentrations that could potentially lead to a delayed recognition of allograft dysfunction [Citation52]. In order not to miss early signs of kidney dysfunction in particular in young children, it is imperative to use the enzymatic creatinine assay and when reporting concentrations in mg/dL, to report with two instead of one decimal place, the latter being common practice in many laboratories.
As the volume of distribution of creatinine is the intra- and extracellular space, there is a considerable time lag until establishment of a new steady state after acute changes in kidney function () [Citation30]. This is most marked in newborns in which total body water may be up to 75% of body weight as opposed to older children (around 60% of total body weight) [Citation53].
Urea
Physiology
Urea is formed in the urea cycle, a series of enzymatic steps to neutralize ammonia, which is released with degradation of amino acids [Citation54]. It is a small nitrogen containing compound, with a molecular weight of 60 Da. Due to its small size, it passes the glomerular barrier freely, making the concentration of urea in the initial filtrate virtually identical to that of serum, which is one of the pre-requisites of a GFR marker. However, the walls of some segments of the renal tubules are also permeable to urea, resulting in complex tubular handling [Citation55]. Urea reabsorption is by a facilitated passive process through urea transporters on the apical membrane. Expression of the urea transporters in the thin descending limb of Henle and the medullary collecting duct is increased by antidiuretic hormone and leads to increased urea reabsorption in anti-diuresis. Therefore, urea clearance is directly related to urine flow and varies by some 300% between anti-diuresis and maximal urine dilution [Citation56]. Other extra renal factors affecting its serum levels include dietary protein intake (+), internal bleeding (+), glucocorticosteroid treatment (+), catabolic state (+), and intestinal excretion (−) [Citation57,Citation58].
Urea is found both intra- and extracellularly; its volume of distribution is total body water.
Analytical methods
Urea can be measured using a direct colorization or an enzymatic method. In the Fearon method, urea gives a bright yellow color after addition of diacetyl monoxime, which turns orange after oxidation [Citation59,Citation60]. Enzymatic methods use urease to break down urea into ammonium, which in turn is measured either by direct colorization methods of ammonium or by the rate of decline of NADH after adding glutamate dehydrogenase (GLDH), catalyzing the reaction of 2-oxoglutaric acid, ammonium and NADH to l-glutamaric acid and NAD+ [Citation61].
The SI unit of urea is mmol/L while in many parts of the world urea is reported in mg/dL (conversion SI ×6.006 = mg/dL). Others report blood urea nitrogen (BUN) in mg/dL, where only the nitrogen content of urea is given (conversion SI ×2.8 = mg/dL).
Reference values in children
Several papers containing age-specific reference values of serum urea have been published [Citation62,Citation63]. Unlike creatinine, serum urea levels are not clearly age-related but rather reflect fluid and protein intake and metabolism. Urea concentrations are slightly lower in growing children, in particular in newborns, compared to adults [Citation64].
Considerations regarding the use in children
As with creatinine, serum levels directly post-partum are closely related to maternal values due to diaplacental exchange. Also, since the fetus depends on diaplacental urea exchange for growth, serum levels directly after birth are more indicative of the neonate’s metabolic rate than its kidney function [Citation65]. As described above, volume depletion increases renal tubular uptake, causing an exaggerated rise in serum urea [Citation66]. This can be used to distinguish between renal and pre-renal acute renal failure [Citation67]. Volume depletion due to diminished intake or gastrointestinal losses is far more prevalent in children than in adults [Citation68]. This makes urea even less suitable as a marker of GFR in pediatric populations.
Cystatin C
Physiology
Cystatin C is a low molecular weight protein of 13.3 kDa with an iso-electric point of 9.2. It is part of the cystatin family of anti-proteinases. In the extracellular compartment, cystatin C forms tight, reversible bonds with cysteine proteinases, thereby neutralizing their proteolytic activity [Citation69,Citation70]. In the past, cystatin C was also denoted as γ-CSF, γ-trace, post-γ-protein, or post-γ-globulin [Citation71] until it became clear that its properties placed it in the cystatin family [Citation72].
Cystatin C is produced by nearly all nucleated cells [Citation73] and has been found in all body fluids. This explains the clinical observation by Andersen et al. [Citation74] that inclusion of body cell mass improves the predictive performance of an eGFR equation. The highest concentrations were found in cerebrospinal fluid [Citation75]. Unlike other members of the cystatin family, cystatin C is not found intracellularly. Therefore, its volume of distribution is limited to the extracellular space. This leads to a higher sensitivity for changes in GFR compared to creatinine whose volume of distribution is total body water [Citation30]. In line with this, serial measurements showed higher intra-individual variability of cystatin C compared to creatinine, where a higher inter-individual variability was found [Citation76]. This results in higher sensitivity of cystatin C compared to creatinine for the early recognition of acute kidney injury reported by a large number [Citation77–80], but not all studies, on this subject [Citation30,Citation81,Citation82].
Cystatin C is not protein-bound. Due to its small size and positive charge, it passes the glomerular membrane easily with a sieving coefficient of 0.84 [Citation83].
Tenstad et al. reported that the renal extraction rate of radiolabeled cystatin C in rats was 94% of the 51Cr-EDTA clearance [Citation84]. Like other low-molecular weight proteins [Citation85], filtered cystatin C is reabsorbed in the proximal tubule by megalin–cubulin receptor-mediated endocytosis and catabolized intracellularly [Citation84]. Therefore, concentrations in the urine are very low [Citation84] unless there is significant tubulointerstitial damage [Citation86,Citation87]. Nephrotic range proteinuria leads to saturation of the re-absorptive capacity for cystatin C (and other low-molecular weight proteins), resulting in spilling of these proteins, which disappears when the nephrotic syndrome is in remission [Citation88].
Therefore, cystatin C is suitable as a marker of GFR only when measured in serum and it is not possible to calculate a “cystatin C clearance” in analogy to the creatinine clearance by using a timed urine collection.
Because it is encoded by a house-keeping gene, cystatin C synthesis is not regulated [Citation89]; its mean production rate is 0.117 mg/min/1.73 m2 [Citation90]. Still, glucocorticosteroids have been shown to increase cystatin C concentrations in a dose-dependent manner [Citation91–93] by induction of the promotor of the cystatin C gene [Citation94]. Hyperthyroidism leads to higher cystatin C levels, while the opposite is true for the hypothyroid state [Citation95]. These changes disappear after normalization of thyroid hormone concentrations and have little effect on the performance of cystatin C for the diagnosis of acute kidney injury [Citation30,Citation96,Citation97]. Epidemiological studies in adults showed a correlation between cystatin C levels and obesity and smoking [Citation98]. Although cystatin C is not an acute phase reactant, as demonstrated in patients undergoing surgery [Citation99] and during febrile illness [Citation100], serum concentrations are correlated with C-reactive protein [Citation101], a well-established marker of micro-inflammation. As cystatin C is a predictor of cardiovascular and all-cause mortality independent of kidney function [Citation102], micro-inflammation may be the common denominator of these findings [Citation101], possibly as the result of impaired renal filtration of cytokines with comparable size to cystatin C [Citation103].
Although elimination of cystatin C is largely through glomerular filtration, there is also a constant extrarenal clearance of 22 mL/min/1.73m2 [Citation84,Citation90], which accounts for the observation that cystatin C concentrations do not exceed 7 mg/L even in anephric patients [Citation104].
Ca. 10% of Swedish patients harbor a polymorphism in the cystatin C promotor that leads to ca. 0.05 mg/L lower cystatin C serum concentrations [Citation105]. In US children, median cystatin C in nonHispanic blacks is 0.045 mg/L, and in Mexican Americans, 0.02 mg/L lower than in a white reference population [Citation106].
Analytical method
There are several methods for measuring serum concentrations of cystatin C. Particle enhanced immunoassays use beads coated with anti-cystatin C antibodies for turbidometric (PETIA) or nephelometric (PENIA) measurement [Citation107,Citation108] or an immunofluorescence-based assay [Citation109]. Some data suggest that the PENIA and the immunofluorescence assay are more accurate than the PETIA assays [Citation110–112].
Until 2010, no standardized calibrator was available for the different cystatin C assays. This precluded direct comparison of cystatin C measurements performed by different assays [Citation113]. This problem has been solved by the generation of the IFCC-certified calibrator ERM-DA471, which is now used by all manufacturers of cystatin C assays [Citation114]. A recent initiative to optimize the performance of six commercially available PETIA and PENIA assays has greatly reduced the variability among these assays and helped to further standardize cystatin C measurement [Citation115].
For different cystatin C assays, interference of bilirubin, lipids and hemoglobin at normal levels are not problematic [Citation116], while Akbas et al. reported interference of hyperlipidemia exceeding 1000 mg/dL on a Siemens nephelometer [Citation117]. Therefore, an equation has been developed to correct measured cystatin C levels for the effect of triglycerides [Citation118].
Reference values in children
Although cystatin C does not cross the placental barrier [Citation46], the highest serum concentrations of cystatin C are found in the neonatal period, and the levels slowly decrease during the first year of life () [Citation43]. This reflects the maturation of GFR in this period (). After the age of one year, cystatin C concentrations stabilize and are similar to those in adults [Citation43,Citation119]. While most studies found no gender differences with cystatin C levels [Citation43,Citation112], Groesbeck et al. observed 0.092 mg/L higher cystatin C concentrations in females. They also noted higher cystatin C levels around the peak growth spurt (i.e. 12 years in girls, 14 years in boys) [Citation106].
Figure 6. Serum cystatin C versus age. Grey area indicates reference range (DAKO PETIA, calibration 1998) First published by Data from Bökenkamp et al. [Citation43], used with permission.
![Figure 6. Serum cystatin C versus age. Grey area indicates reference range (DAKO PETIA, calibration 1998) First published by Data from Bökenkamp et al. [Citation43], used with permission.](/cms/asset/b66a4daa-a98a-4eac-852d-a2bbb31fff32/ilab_a_1427041_f0006_b.jpg)
As the calibration of cystatin C assays has changed with time [Citation120], only reference ranges established using the IFCC calibrator [Citation114] are applicable today. IFCC calibrated reference values for the first year of life in premature infants have been published by Nakashima et al., and range from a mean of 1.776 mg/L in the first month to 0.9660 mg/L between 12 and 14 months [Citation121]. They found no correlation between gestational age and serum concentrations, suggesting the data might be extrapolated to term neonates as well. A recent study among healthy children aged 4–17 years in Greece [Citation122] showed mean cystatin C levels of 0.79 mg/L, which is comparable with Groesbeck’s data of 0.76 mg/L before puberty and 0.82 mg/L in adolescents [Citation106].
Considerations regarding the use in children
Unlike creatinine and urea, there is no correlation between maternal and neonatal serum cystatin C concentrations, which suggests that there is little to no transplacental exchange of cystatin C [Citation123]. Therefore, cystatin C concentrations in cord blood can be used to assess kidney function of the fetus [Citation46] and the newborn. It may be particularly useful for the diagnosis of acute kidney injury following perinatal asphyxia [Citation47].
Like the other markers, cystatin C can be measured in very small sample volumes, which is particularly important for small children. As venipuncture may be challenging in small children, cystatin C measurement in capillary samples has been explored. Although promising results were reported in adults [Citation124], this could not be reproduced in children, in whom the capillary samples yielded lower cystatin C concentrations than paired venous samples [Citation125].
As noted earlier, serum creatinine is a poor predictor of acute kidney injury in children. Although there are little data on children using cystatin C in this setting [Citation80], it may be a more sensitive marker due to its smaller volume of distribution and the constant reference range in children older than 2 years of age.
Cystatin C has been shown to be a more accurate marker than creatinine in specific pediatric populations such as children with active malignancy [Citation126], neural tube defects [Citation127], and post-liver transplant [Citation128]. This can be explained since these are all populations in which muscle mass is diminished.
Beta-trace protein
Physiology
Beta-trace protein (BTP), also known as lipocalin-type prostaglandin D synthase, is a small glycoprotein of 190 amino acids with a molecular weight ranging from 20 to 31 kDa, depending on the degree of N-glycosylation [Citation129].
BTP is synthesized mainly in the central nervous system by glial cells and the choroid plexus and forms one of the principal constituents of the cerebrospinal fluid [Citation130]. It catalyzes the reaction from prostaglandin H2 to prostaglandin D2, which plays a central role in nociception, temperature and sleep regulation. It is also involved in the transport of lipophilic molecules such as bilirubin, thyroid hormones, retinoid, and amyloid-beta [Citation131–133].
The highest concentrations of BTP are observed in cerebrospinal fluid, making it a marker for distinguishing between cerebrospinal fluid leak and other bodily fluids [Citation134]. Decreased cerebrospinal fluid concentrations were reported in bacterial meningitis, while concentrations in viral meningoencephalitis were normal [Citation135]. Serum BTP originates from resorption of cerebrospinal fluid [Citation136]. Subsequently, the liver eliminates BTP molecules with smaller carbohydrate residues, reducing the molecular weight range of BTP in serum to 26–29 kDa [Citation137]. Additionally, there is evidence for BTP originating from kidneys, genital organs and the heart, as summarized in an extensive review about BTP by Filler et al. [Citation138] Although it is the largest of the three low-molecular weight protein GFR markers, BTP is eliminated almost exclusively via the kidneys [Citation139], and serum BTP concentrations are closely linked to GFR [Citation130,Citation140–142].
While urinary excretion of all low-molecular weight proteins increases with declining GFR due to impaired tubular reabsorption, as mentioned earlier, urinary BTP outperforms the other markers as an early marker of impaired kidney function. In a study by Donadio et al., urinary excretion of BTP was inversely related to GFR and was already increased when GFR fell below 90 mL/min/1.73m2 [Citation143]. The authors hypothesize that the reabsorption capacity for BTP is lower than for the other markers. As loss of nephrons leads to increased BTP filtration in the remaining nephrons due to increased serum levels and hyperfiltration, this causes overflow at the tubular level [Citation144]. Of note, this is a different mechanism than the concept underlying inulin or creatinine clearance using timed urine and simultaneous plasma sampling.
Glucocorticoids have been shown to decrease serum BTP concentrations in a dose-dependent manner [Citation145]. The presence of a certain single nuclear polymorphism upstream of the BTP gene locus has been associated with 5% higher BTP concentrations [Citation146].
Because of its large molecular size, BTP does not cross conventional hemodialysis membranes. This makes it a useful marker of residual renal function in dialysis patients as opposed to urea and creatinine, which are eliminated by dialysis [Citation147]. Because of the larger pore size, BTP crosses high-flux or super high-flux membranes and is less suited as a marker of residual renal function in these dialysis modalities [Citation148].
Analytical methods
The most commonly used method for BTP measurement is by PENIA, as described previously for cystatin C. Alternative methods are enzyme-linked immunosorbent assay (ELISA) and immunofluorescence [Citation137]. It should be noted that there is no international calibrator for BTP measurement, which hampers comparison of measurements performed with different assays.
Reference values in children
As with the other markers, BTP serum levels are highest directly after birth in both term and preterm infants [Citation149]. These levels drop markedly in the first days after birth and more gradually in the first two years. From 2 years of age, reference values using the Siemens PENIA assay stabilize around 0.7 mg/L (upper limit 1.0 mg/L) and are not affected by age or sex [Citation130,Citation140]. However, a trend towards decreasing values with age is found and in adult populations, lower mean values of 0.56 mg/L have been described [Citation150].
Considerations regarding the use in children
Although not formally tested, it is very likely that the findings showing absence of diaplacental exchange of cystatin C and beta-2 microglobulin [Citation46] can be extrapolated to BTP. This is supported by a study in which BTP concentrations in venous and arterial umbilical cord blood were identical, which suggested that there was no diaplacental exchange, placental synthesis or degradation of BTP [Citation151]. Also with regard to general pediatric patient populations, BTP appears to perform comparably to cystatin C and beta-2 microglobulin [Citation140]. In pediatric patients with neural tube defects, BTP is more closely correlated to GFR than creatinine, but is outperformed by cystatin C [Citation127]. Little is known about the accuracy of BTP in other specific pediatric populations such as those with malignancy and transplanted patients.
Beta-2-microglobulin
Physiology
Beta-2-microglobulin (B2M) is a small protein with a molecular weight of 11.8 kDa [Citation152]. Being the beta chain of the major histocompatibility complex (MHC), it is found on the surface membrane of nearly all nucleated cells [Citation153]. It is shed during membrane turnover and can be detected in various body fluids, most notably in serum and synovial fluid [Citation154,Citation155]. Unbound B2M passes the glomerular wall with a high sieving coefficient [Citation156,Citation157]. Like other low-molecular weight proteins, it is reabsorbed and catabolized in the proximal tubules [Citation158]. Therefore, elevated concentrations of B2M in urine are indicative of tubular dysfunction [Citation159].
Originating from the MHC, serum B2M concentrations not only reflect renal function but also are linked to viral infections [Citation160,Citation161], inflammation [Citation155] and various types of malignancy [Citation162,Citation163], where elevated levels have been reported. The ratio of cystatin C and B2M in simultaneous blood samples has been proposed as a diagnostic parameter for post-transplant lymphoproliferative disease [Citation164]. Glucocorticosteroids decrease B2M concentrations in a dose dependent manner [Citation93]. These extrarenal factors impair the usefulness of B2M as a marker of GFR.
Unlike the other low-molecular weight protein markers of GFR, which are considered nontoxic, severe chronic elevation of B2M in dialysis patients leads to the development of amyloidosis [Citation165]. Therefore, modern dialysis techniques aim at removing not only small solutes but also larger molecules like B2M.
Analytical methods
Like the other low-molecular weight protein markers, B2M can be measured in serum using PENIA or PETIA [Citation166,Citation167]. Alternatively, ELISA assays can be used [Citation168]. As for BTP, there is no international calibrator, which hampers comparison of measurements performed with different assays.
Reference values in children
For B2M too, the highest serum concentrations are found in early infancy and decrease in the first two years of life. Several authors report a constant reference range of 1.19–2.25 mg/L for both genders from 2 years of age [Citation140,Citation169], while others found decreasing concentrations with a slope of −0.034 mg/L/year between the ages of 2 and 18 years [Citation170]. The global reference range in this publication was comparable (i.e. 1.0–2.3 mg/L) to the other reports, however.
Considerations regarding the use in children
Like cystatin C, B2M does not cross the placental barrier and can therefore be used as a parameter of fetal renal function [Citation46]. Several authors have demonstrated that B2M measured in cord blood can be used to predict poor kidney function in fetuses with severe bilateral hydronephrosis [Citation171,Citation172].
Although serum B2M has been used as a tool for evaluation of kidney function in pediatric populations with malignancy in research settings [Citation173], it is unclear whether there are added benefits of B2M compared to other markers in these specific pediatric populations.
Estimation of GFR from endogenous marker concentrations
Considerations regarding the development of eGFR equations
While marker concentrations refer to upper limits of the reference range to distinguish between normal and diminished kidney function, the concept of eGFR aims at further quantifying the degree of renal dysfunction and classification of chronic kidney disease (CKD) using the CKD-staging system [Citation18]. It also provides a quantitative measure of changes in kidney function and can be used for dose calculation of drugs eliminated by the kidneys.
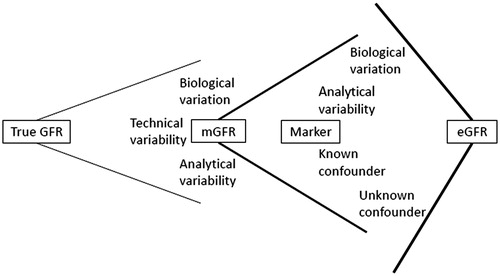
These equations are developed using the correlation between measured GFR (mGFR) based on a gold standard technique and simultaneous marker concentrations, anthropometric data, and potential other covariates that reflect extra-renal factors affecting marker concentration, such as gender, underlying diagnosis or the use of specific medication (). While a number of confounders are known and can potentially be corrected for, other factors are unknown and introduce bias and variability depending on the population studied. Therefore, any given eGFR equation reflects the analytical method and the population used for its generation, which may not be applicable to other populations, and most importantly, to a specific patient [Citation174,Citation175]. This underscores the need for thorough external validation and also explains the large number of eGFR equations published in the last three decades, starting off with the Modification of Diet in Renal Disease (MDRD) equation [Citation176] which was the first to replace the older Cockcroft–Gault equation [Citation177].
Figure 7. Relationship between true GFR, measured GFR, marker concentration and estimated GFR.
Important parameters when assessing comparability and applicability of eGFR equations are therefore
Method of gold-standard GFR measurement [Citation13]
Assay (incl calibration) used for marker measurement
Mean GFR
Age
Race
Gender
Underlying disease
Other known confounders
Clearly, the size of the development cohort affects the robustness of coefficients found and today often widely exceeds 1000 individuals. In children, however, numbers are often smaller because of the invasiveness of the gold standard GFR measurement. Some high-risk populations, such as premature babies, may not be available at all for such studies. Although there are a number of studies exploring endogenous markers in premature infants [Citation178], only very few used a gold standard clearance, and all had exceedingly low participant numbers [Citation179].
Performance of individual eGFR equations is judged by several parameters: (i) bias (i.e. mean or median of the difference between eGFR and mGFR) or %prediction error (i.e. mean or median (eGFR–mGFR)/mGFR ×100%), (ii) precision measured as the scatter of the bias or as absolute %prediction error (i.e. mean or median |(eGFR – mGFR)|/mGFR ×100%) and (iii) accuracy PX, which describes the proportion of eGFR results within ± X % of mGFR. Bias and accuracy of the eGFR compared to mGFR are visualized using Bland-Altman graphs that plot the index mGFR versus the difference of mGFR and eGFR [Citation180]. Performance in the classification according to CKD stages can be assessed using receiver-operating characteristics (ROC) plots [Citation181].
To be acceptable for clinical use, P30 accuracy should be at least 80% [Citation13]. This means that at an eGFR of 100 mL/min/1.73 m2, there is a 20% probability of mGFR being below 70 or above 130 mL/min/1.73 m2). Modern pediatric eGFR equations [Citation112] have P30 around 90% and P10 up to 45%. This illustrates the shortcomings of eGFR and the need to perform mGFR measurements when exact knowledge of GFR is required. It should be borne in mind, however, that part of this imprecision reflects variability in mGFR measurement rather than the eGFR. As shown by Soveri et al. [Citation13], P30 of different mGFR methods compared to renal inulin clearance – the “true” gold standard – ranged from 86 to 97% with P10 of 50–72%. Also, in 8% of repeated mGFR measurements in an adult population, the difference between both tests exceeded 30% [Citation182]. Therefore, agreement between mGFR and the optimal eGFR equation cannot exceed the rates reported in Soveri’s meta-analysis [Citation13], i.e. P30 above 90% and P10 above 50–60%. While the former goal has been achieved by the most sophisticated equations, the latter has not been reached yet. Andersen et al. relying on a smaller reported difference between mGFR measurements in a pediatric population [Citation183], estimate the maximum P10 accuracy rate that can be achieved to be 86% [Citation74]. However, this does not account for the added imprecision for each additional variable. The realistic maximum accuracy is therefore likely lower.
Another aspect to be considered when looking at eGFR is the reciprocal relationship between the concentration of the GFR marker and mGFR (). Most eGFR equations were established and perform best in patients with a moderate degree of renal dysfunction, while these equations fail in patients with normal GFR [Citation174]. Laboratory variability at marker concentrations in the low normal range (a typical finding with serum creatinine in children) results in exaggerated variability of eGFR. This also precludes obtaining the diagnosis of increased GFR (“hyperfiltration”) using eGFR equations [Citation184], particularly in children with low muscle mass [Citation185].
Statistical approach to the development of eGFR equations
The first eGFR equations in children were established using univariate linear regression that related the reciprocal of the marker concentration to mGFR.
(i)
where y is either 1 or height, x is the marker concentration and a and b are the respective coefficients calculated by linear regression analysis.
As height is most closely related to muscle mass in children and adolescents, height was introduced to correct for changes in creatinine production with growth [Citation45,Citation186–188], while for the low molecular weight proteins, 1 is used [Citation145,Citation189–191].
This was extended to multiple linear regression to allow additional covariates to be included in the equation [Citation187,Citation192,Citation193].
(ii)
where y is either 1 or height, x is the marker concentration, z is another covariate such as age or weight, and a, b, and c are the respective coefficients calculated by linear regression analysis.
As the relationship between mGFR and the reciprocal of the marker concentration is not perfectly linear, more recent approaches performed multiple linear regression analysis on logarithmic data [Citation112,Citation115,Citation194–197].
(iii)
which can be transformed to
where y is either 1 or height, x is the serum concentration of the marker, a, b, and c are the coefficients calculated by linear regression analysis, and E is a fixed term for extra-renal elimination of the marker [Citation115].
Recent adult eGFR equations also include knots, i.e. different exponents at different marker concentrations [Citation198,Citation199], while other equations use different exponents in specific diagnosis groups [Citation200].
Pottel et al. uses an entirely different approach for the development of eGFR equations. His concept is based on the idea that median GFR in a healthy population corresponds to the median marker concentration in the same population, which in case of creatinine may change considerably with growth, reflecting changes in body composition [Citation44]. Using age-specific reference values for IDMS-calibrated creatinine at 1-year intervals, he estimates GFR by multiplying median normal GFR (i.e. 107.3 mL/min/1.73m2 for children older than 2 years) with the ratio of median normal creatinine for age and sex (Q) and the observed creatinine [Citation201,Citation202].
(iv) eGFR = ai/(xi/Qi)
where ai is the median GFR found in the healthy peer population of the individual, xi is the individual’s marker concentration, and Qi is the median reference value in the healthy peer population.
This approach has been externally validated for children, and it performed comparably to the height-dependent Schwartz equation [Citation190,Citation203]. By using narrow age-related reference values in other age groups, this concept has been extended to the full age spectrum (FAS) [Citation204]. This also solves the problem of discrepant results yielded by different eGFR equations (i.e. the pediatric Schwartz compared to the adult Chronic Kidney Disease Epidemiology Collaboration (CKD-EPI) or MDRD equations) at transition from adolescence to young adulthood [Citation205].
Standardization of measurements
One of the reasons for the wide array of eGFR equations using the same parameters lies in a lack of standardization, both of the mGFR measurement [Citation13,Citation14,Citation206] and the measurement of the endogenous markers. Considerable efforts have been made to standardize creatinine [Citation35,Citation207] and cystatin C measurements [Citation114,Citation115]. Since standardization, reproducibility of equations has improved [Citation208–210].
eGFR equations in children
During the last 30 years, a large number of different eGFR equations have been developed for children that use one or several of the endogenous markers of GFR discussed in this review. A selection of equations, which were developed at least in part in pediatric populations, is presented in [Citation112,Citation115,Citation141,Citation145,Citation191,Citation196,Citation197,Citation201,Citation202,Citation204,Citation211–218]. With respect to creatinine and cystatin C, we have restricted our selection to equations using current IFCC calibrated assays in order to provide clinically useful rather than historical information. More equations have been developed in adult populations, some of which have been shown to perform well in pediatric populations as well [Citation199].
Table 2. eGFR Equations based on different endogenous markers.
One consideration regarding the use of eGFR equations in children is the need of anthropometric data, i.e. height, for most creatinine-based equations. The fact that these data are not readily available to the clinical laboratory forms an obstacle to direct reporting of eGFR by the laboratory. Here, the height-independent Pottel approach using the FAS-age equation and cystatin C-based equations is clearly advantageous [Citation49].
Combination of markers
As the extra-renal metabolism of the different endogenous markers involves different tissues and pathways, it is not surprising that a combination of markers into one single eGFR equation [Citation112,Citation198,Citation219] or the average of the results of separate one-parameter eGFR equations significantly improves predictive performance [Citation49,Citation220,Citation221]. Both approaches yield comparable results with regard to bias and accuracy. Still, the “Lund approach”, which was proposed by Anders Grubb, compares a creatinine- and a cystatin C- based eGFR, and uses the average of both estimates [Citation222], offers several advantages over the use of more complex equations. (i) It draws the clinician’s attention to discrepant results of the two estimates, which can be a clue for yet unrecognized pathology [Citation27,Citation223]. (ii) In this situation, a motivated choice for one of the two equations may be more accurate than using the average. (iii) Analyzing concordance between both eGFR estimates adds confidence to the accuracy of the estimates: If the difference between the estimates is less than 30%, this indicates a P30 accuracy of the average exceeding 92% and a P10 accuracy exceeding 45% [Citation49]. (iv) If the cystatin C-based eGFR is more than 40% lower than the creatinine-based eGFR (in the absence of neuromuscular disease, high-dose glucocorticoids or untreated hypothyroidism), this may suggest the presence of the recently postulated “shrunken pore syndrome” in which changes in the size selectivity of the glomerular filtration barrier lead to retention of the larger low-molecular weight protein markers in excess of creatinine [Citation224]. This condition has been associated with higher mortality in adults [Citation103].
Summary and conclusion
As in the adult population, estimation of GFR from endogenous markers in children is an important method to aid recognition and follow-up of renal dysfunction. Because of physiologically low creatinine levels, enzymatic assays are mandatory at younger ages, without which diagnosis of early stages of renal injury may be missed. Age-related changes in creatinine production have to be considered when using this marker. Therefore, correction for age or height is necessary and has been incorporated in pediatric creatinine-based eGFR equations. Because it is independent of muscle mass, cystatin C can be used without anthropometric data. The combination of both markers, either in one single equation or by calculating the average of a creatinine- and a cystatin C-based eGFR, improves accuracy of eGFR prediction. The role of B2M and BTP in pediatrics still needs to be defined. Their renal characteristics show considerable overlap with cystatin C, while extra-renal influences differ so that a combination with the other markers of kidney function may be useful. When an exact measurement of GFR is required, eGFR lacks accuracy and a gold standard measurement should be performed. Here, iohexol plasma clearance is a well-characterized technique without radiation exposure.
| Abbreviations | ||
| B2M | = | beta-2-microglobulin |
| BTP | = | beta-trace protein |
| CKD | = | chronic kidney disease |
| CKD-EPI | = | Chronic Kidney Disease Epidemiology Collaboration |
| eGFR | = | estimated GFR |
| ELISA | = | enzyme-linked immunosorbent assay |
| FAS | = | full age spectrum |
| GFR | = | glomerular filtration rate |
| IDMS | = | isotope dilution mass spectroscopy |
| MDRD | = | Modification of Diet in Renal Disease |
| mGFR | = | measured GFR |
| MHC | = | major histocompatibility complex |
| PENIA | = | particle enhanced nephelometric immunoassay |
| PETIA | = | particle enhanced turbidometric immunoassay |
| ROC | = | receiver-operating characteristics |
Disclosure statement
On behalf of all authors, the corresponding author declares that there are no conflicts of interest.
Arend Bökenkamp has received speaker’s fees from Siemens Healthcare.
References
- Hinchliffe SA, Sargent PH, Howard CV, et al. Human intrauterine renal growth expressed in absolute number of glomeruli assessed by the disector method and Cavalieri principle. Lab Invest. 1991;64:777–784.
- Hoseini R, Otukesh H, Rahimzadeh N, et al. Glomerular function in neonates. Iran J Kidney Dis. 2012;6:166–172.
- Rubin MI, Bruck E, Rapoport M. Maturation of renal function in childhood; clearance studies. J Clin Invest. 1949;28:1144–1162.
- Brodehl J, Gellissen K, Weber HP. Postnatal development of tubular phosphate reabsorption. Clin Nephrol. 1982;17:163–171.
- Black MJ, Sutherland MR, Gubhaju L, et al. When birth comes early: effects on nephrogenesis. Nephrology (Carlton). 2013;18:180–182.
- Charlton JR, Springsteen CH, Carmody JB. Nephron number and its determinants in early life: a primer. Pediatr Nephrol. 2014;29:2299–2308.
- Brodehl J, Gellissen K. Endogenous renal transport of free amino acids in infancy and childhood. Pediatrics. 1968;42:395–404.
- van Rossum LK, Cransberg K, de Rijke YB, et al. Determination of inulin clearance by single injection or infusion in children. Pediatr Nephrol. 2005;20:777–781.
- Schwartz GJ, Furth S, Cole SR, et al. Glomerular filtration rate via plasma iohexol disappearance: pilot study for chronic kidney disease in children. Kidney Int. 2006;69:2070–2077.
- Chantler C, Garnett ES, Parsons V, et al. Glomerular filtration rate measurement in man by the single injection methods using 51Cr-EDTA. Clin Sci. 1969;37:169–180.
- Mulligan JS, Blue PW, Hasbargen JA. Methods for measuring GFR with technetium-99m-DTPA: an analysis of several common methods. J Nucl Med. 1990;31:1211–1219.
- Dowling TC, Frye RF, Fraley DS, et al. Comparison of iothalamate clearance methods for measuring GFR. Pharmacotherapy. 1999;19:943–950.
- Soveri I, Berg UB, Björk J, et al. Measuring GFR: a systematic review. Am J Kidney Dis. 2014;64:411–424.
- Delanaye P, Ebert N, Melsom T, et al. Iohexol plasma clearance for measuring glomerular filtration rate in clinical practice and research: a review. Part 1: How to measure glomerular filtration rate with iohexol? Clin Kidney J. 2016;9:682–699.
- Salvador CL, Tøndel C, Mørkrid L, et al. Glomerular filtration rate measured by iohexol clearance: a comparison of venous samples and capillary blood spots. Scand J Clin Lab Invest. 2015;75:710–716.
- Herget-Rosenthal S, Bökenkamp A, Hofmann W. How to estimate GFR-serum creatinine, serum cystatin C or equations?. Clin Biochem. 2007;40:153–161.
- National Kidney Foundation. K/DOQI clinical practice guidelines for chronic kidney disease: evaluation, classification, and stratification. Am J Kidney Dis. 2002;39:S1–S266.
- KDIGO CKD Work Group. KDIGO 2012 clinical practice guideline for the evaluation and management of chronic kidney disease. Kidney Int Suppl. 2013;3:1–150.
- Deen WM, Lazzara MJ, Myers BD. Structural determinants of glomerular permeability. Am J Physiol Renal Physiol. 2001;281:F579–F596.
- Wyss M, Kaddurah-Daouk R. Creatine and creatinine metabolism. Physiol Rev. 2000;80:1107–1213.
- Kushmerick MJ, Moerland TS, Wiseman RW. Mammalian skeletal muscle fibers distinguished by contents of phosphocreatine, ATP, and Pi. Proc Natl Acad Sci USA. 1992;89:7521–7525.
- Sant’Ana Pereira JA, Sargeant AJ, Rademaker AC, et al. Myosin heavy chain isoform expression and high energy phosphate content in human muscle fibres at rest and post-exercise. J Physiol. 1996;496: 583–588.
- Baxmann AC, Ahmed MS, Marques NC, et al. Influence of muscle mass and physical activity on serum and urinary creatinine and serum cystatin C. Clin J Am Soc Nephrol. 2008;3:348–354.
- Jacobsen FK, Christensen CK, Mogensen CE, et al. Pronounced increase in serum creatinine concentration after eating cooked meat. Br Med J. 1979;1:1049–1050.
- Shemesh O, Golbetz H, Kriss JP, et al. Limitations of creatinine as a filtration marker in glomerulopathic patients. Kidney Int. 1985;28:830–838.
- Ciarimboli G, Lancaster CS, Schlatter E, et al. Proximal tubular secretion of creatinine by organic cation transporter OCT2 in cancer patients. Clin Cancer Res. 2012;18:1101–1108.
- Schreuder MF, Swinkels DW, Kortmann BB, et al. Discrepant results of serum creatinine and cystatin C as a clue to urine leakage after renal transplantation. Transplantation. 2009;88:596–597.
- Hankins DA, Babb AL, Uvelli DA, et al. Creatinine degradation I: the kinetics of creatinine removal in patients with chronic kidney disease. Int J Artif Organs. 1981;4:35–39.
- Schloerb PR. Total body water distribution of creatinine and urea in nephrectomized dogs. Am J Physiol. 1960;199:661–665.
- Slort PR, Ozden N, Pape L, et al. Comparing cystatin C and creatinine in the diagnosis of pediatric acute renal allograft dysfunction. Pediatr Nephrol. 2012;27:843–849.
- Husdan H, Rapoport A. Estimation of creatinine by the Jaffe reaction. A comparison of three methods. Clin Chem. 1968;14:222–238.
- Moss GA, Bondar RJ, Buzzelli DM. Kinetic enzymatic method for determining serum creatinine. Clin Chem. 1975;21:1422–1426.
- Ogawa J, Nirdnoy W, Tabata M, et al. A new enzymatic method for the measurement of creatinine involving a novel ATP-dependent enzyme, N-methylhydantoin amidohydrolase. Biosci Biotechnol Biochem. 1995;59:2292–2294.
- Suzuki M, Yoshida M. A new enzymatic serum creatinine measurement based on an endogenous creatine-eliminating system. Clin Chim Acta. 1984;143:147–155.
- Panteghini M. Enzymatic assays for creatinine: time for action. Scand J Clin Lab Invest Suppl. 2008;241:84–88.
- Greenberg N, Roberts WL, Bachmann LM, et al. Specificity characteristics of 7 commercial creatinine measurement procedures by enzymatic and Jaffe method principles. Clin Chem. 2012;58:391–401.
- Schmidt RL, Straseski JA, Raphael KL, et al. A risk assessment of the Jaffe vs enzymatic method for creatinine measurement in an outpatient population. PLoS One. 2015;10:e0143205.
- Maisels MJ. Neonatal jaundice. Pediatr Rev. 2006;27:443–454.
- Knapp ML, Hadid O. Investigations into negative interference by jaundiced plasma in kinetic Jaffe methods for plasma creatinine determination. Ann Clin Biochem. 1987;24:85–97.
- Nah H, Lee SG, Lee KS, et al. Evaluation of bilirubin interference and accuracy of six creatinine assays compared with isotope dilution-liquid chromatography mass spectrometry. Clin Biochem. 2016;49:274–281.
- Pottel H, Vrydags N, Mahieu B, et al. Establishing age/sex related serum creatinine reference intervals from hospital laboratory data based on different statistical methods. Clin Chim Acta. 2008;396:49–55.
- Hodari AA, Mariona FG, Houlihan RT, et al. Creatinine transport in the maternal-fetal complex. Obstet Gynecol. 1973;41:47–55.
- Bökenkamp A, Domanetzki M, Zinck R, et al. Reference values for cystatin C serum concentrations in children. Pediatr Nephrol. 1998;12:125–129.
- Pottel H, Mottaghy FM, Zaman Z, et al. On the relationship between glomerular filtration rate and serum creatinine in children. Pediatr Nephrol. 2010;25:927–934.
- Schwartz GJ, Haycock GB, Edelmann CM, et al. A simple estimate of glomerular filtration rate in children derived from body length and plasma creatinine. Pediatrics. 1976;58:259–263.
- Bökenkamp A, Dieterich C, Dressler F, et al. Fetal serum concentrations of cystatin C and beta2-microglobulin as predictors of postnatal kidney function. Am J Obstet Gynecol. 2001;185:468–475.
- Treiber M, Gorenjak M, Pecovnik Balon B. Serum cystatin-C as a marker of acute kidney injury in the newborn after perinatal hypoxia/asphyxia. Ther Apher Dial. 2014;18:57–67.
- Plötz FB, Bouma AB, van Wijk JA, et al. Pediatric acute kidney injury in the ICU: an independent evaluation of pRIFLE criteria. Intensive Care Med. 2008;34:1713–1717.
- den Bakker E, Gemke R, van Wijk JAE, et al. Accurate eGFR reporting for children without anthropometric data. Clin Chim Acta. 2017;474:38–43.
- Mention K, Lahoche-Manucci A, Bonnevalle M, et al. Renal function outcome in pediatric liver transplant recipients. Pediatr Transplant. 2005;9:201–207.
- Kaliciński P, Szymczak M, Smirska E, et al. Longitudinal study of renal function in pediatric liver transplant recipients. Ann Transplant. 2005;10:53–58.
- Bunchman TE, Fryd DS, Sibley RK, et al. Manifestations of renal allograft rejection in small children receiving adult kidneys. Pediatr Nephrol. 1990;4:255–258.
- Morgenstern BZ, Mahoney DW, Warady BA. Estimating total body water in children on the basis of height and weight: a reevaluation of the formulas of Mellits and Cheek. J Am Soc Nephrol. 2002;13:1884–1888.
- Jackson MJ, Beaudet AL, O’Brien WE. Mammalian urea cycle enzymes. Annu Rev Genet. 1986;20:431–464.
- Weiner ID, Mitch WE, Sands JM. Urea and ammonia metabolism and the control of renal nitrogen excretion. Clin J Am Soc Nephrol. 2015;10:1444–1458.
- Bagnasco SM. Role and regulation of urea transporters. Pflugers Arch. 2005;450:217–226.
- Kida Y, Ueda H, Tanaka H, et al. Estimation of protein intake using urinary urea nitrogen in patients with early-stage liver cirrhosis. Hepatol Int. 2007;1:382–386.
- Feinfeld DA, Bargouthi H, Niaz Q, et al. Massive and disproportionate elevation of blood urea nitrogen in acute azotemia. Int Urol Nephrol. 2002;34:143–145.
- Fearon WR. The carbamido diacetyl reaction: a test for citrulline. Biochem J. 1939;33:902–907.
- Evans RT. Manual and automated methods for measuring urea based on a modification of its reaction with diacetyl monoxime and thiosemicarbazide. J Clin Pathol. 1968;21:527–529.
- Kimura S, Iyama S, Yamaguchi Y, et al. New enzymatic assay for serum urea nitrogen using urea amidolyase. J Clin Lab Anal. 2003;17:52–56.
- Lai DS, Chen SC, Chang YH, et al. Pediatric reference intervals for several biochemical analytes in school children in Central Taiwan. J Formos Med Assoc. 2009;108:957–963.
- Ridefelt P, Aldrimer M, Rödöö PO, et al. Population-based pediatric reference intervals for general clinical chemistry analytes on the Abbott Architect ci8200 instrument. Clin Chem Lab Med. 2012;50:845–851.
- Jagarinec N, Flegar-Mestrić Z, Surina B, et al. Pediatric reference intervals for 34 biochemical analytes in urban school children and adolescents. Clin Chem Lab Med. 1998;36:327–337.
- Gresham EL, Simons PS, Battaglia FC. Maternal-fetal urea concentration difference in man: metabolic significance. J Pediatr. 1971;79:809–811.
- Hayajneh WA, Jdaitawi H, Al Shurman A, et al. Comparison of clinical associations and laboratory abnormalities in children with moderate and severe dehydration. J Pediatr Gastroenterol Nutr. 2010;50:290–294.
- Carvounis CP, Nisar S, Guro-Razuman S. Significance of the fractional excretion of urea in the differential diagnosis of acute renal failure. Kidney Int. 2002;62:2223–2229.
- Guarino A, Ashkenazi S, Gendrel D, et al. European Society for Pediatric Gastroenterology, Hepatology, and Nutrition/European Society for Pediatric Infectious Diseases evidence-based guidelines for the management of acute gastroenteritis in children in Europe: update 2014. J Pediatr Gastroenterol Nutr. 2014;59:132–152.
- Turk V, Bode W. The cystatins: protein inhibitors of cysteine proteinases. FEBS Lett. 1991;285:213–219.
- Abrahamson M, Ritonja A, Brown MA, et al. Identification of the probable inhibitory reactive sites of the cysteine proteinase inhibitors human cystatin C and chicken cystatin. J Biol Chem. 1987;262:9688–9694.
- Mussap M, Plebani M. Biochemistry and clinical role of human cystatin C. Crit Rev Clin Lab Sci. 2004;41:467–550.
- Barrett AJ, Davies ME, Grubb A. The place of human gamma-trace (cystatin C) amongst the cysteine proteinase inhibitors. Biochem Biophys Res Commun. 1984;120:631–636.
- Newman DJ. Cystatin C. Ann Clin Biochem. 2002;39:89–104.
- Andersen TB. Estimating renal function in children: a new GFR-model based on serum cystatin C and body cell mass. Dan Med J 2012;59:B4486.
- Löfberg H, Grubb AO. Quantitation of gamma-trace in human biological fluids: indications for production in the central nervous system. Scand J Clin Lab Invest. 1979;39:619–626.
- Keevil BG, Kilpatrick ES, Nichols SP, et al. Biological variation of cystatin C: implications for the assessment of glomerular filtration rate. Clin Chem. 1998;44:1535–1539.
- Herget-Rosenthal S, Marggraf G, Hüsing J, et al. Early detection of acute renal failure by serum cystatin C. Kidney Int. 2004;66:1115–1122.
- Benöhr P, Grenz A, Hartmann JT, et al. Cystatin C – a marker for assessment of the glomerular filtration rate in patients with cisplatin chemotherapy. Kidney Blood Press Res. 2006;29:32–35.
- Zhang Z, Lu B, Sheng X, et al. Cystatin C in prediction of acute kidney injury: a systemic review and meta-analysis. Am J Kidney Dis. 2011;58:356–365.
- Volpon LC, Sugo EK, Carlotti AP. Diagnostic and prognostic value of serum cystatin C in critically ill children with acute kidney injury. Pediatr Crit Care Med. 2015;16:e125–e131.
- Rickli H, Benou K, Ammann P, et al. Time course of serial cystatin C levels in comparison with serum creatinine after application of radiocontrast media. Clin Nephrol. 2004;61:98–102.
- Poletti PA, Saudan P, Platon A, et al. I.v. N-acetylcysteine and emergency CT: use of serum creatinine and cystatin C as markers of radiocontrast nephrotoxicity. Am J Roentgenol. 2007;189:687–692.
- Bökenkamp A, Ciarimboli G, Kilian I, et al. Determination of the glomerular sieving coefficient for cystatin C in the perfused-fixed rat kidney model. Pediatr Nephrol. 1998;12:C34–C212.
- Tenstad O, Roald AB, Grubb A, et al. Renal handling of radiolabelled human cystatin C in the rat. Scand J Clin Lab Invest. 1996;56:409–414.
- Maack T, Johnson V, Kau ST, et al. Renal filtration, transport, and metabolism of low-molecular-weight proteins: a review. Kidney Int. 1979;16:251–270.
- Jacobsson B, Lignelid H, Bergerheim US. Transthyretin and cystatin C are catabolized in proximal tubular epithelial cells and the proteins are not useful as markers for renal cell carcinomas. Histopathology. 1995;26:559–564.
- Uchida K, Gotoh A. Measurement of cystatin-C and creatinine in urine. Clin Chim Acta. 2002;323:121–128.
- Herget-Rosenthal S, van Wijk JA, Bröcker-Preuss M, et al. Increased urinary cystatin C reflects structural and functional renal tubular impairment independent of glomerular filtration rate. Clin Biochem. 2007;40:946–951.
- Abrahamson M, Olafsson I, Palsdottir A, et al. Structure and expression of the human cystatin C gene. Biochem J. 1990;268:287–294.
- Sjöström P, Tidman M, Jones I. Determination of the production rate and non-renal clearance of cystatin C and estimation of the glomerular filtration rate from the serum concentration of cystatin C in humans. Scand J Clin Lab Invest. 2005;65:111–124.
- Risch L, Herklotz R, Blumberg A, et al. Effects of glucocorticoid immunosuppression on serum cystatin C concentrations in renal transplant patients. Clin Chem. 2001;47:2055–2059.
- Risch L, Saely C, Reist U, et al. Course of glomerular filtration rate markers in patients receiving high-dose glucocorticoids following subarachnoidal hemorrhage. Clin Chim Acta. 2005;360:205–207.
- Bökenkamp A, Laarman CA, Braam KI, et al. Effect of corticosteroid therapy on low-molecular weight protein markers of kidney function. Clin Chem. 2007;53:2219–2221.
- Bjarnadóttir M, Grubb A, Olafsson I. Promoter-mediated, dexamethasone-induced increase in cystatin C production by HeLa cells. Scand J Clin Lab Invest. 1995;55:617–623.
- Fricker M, Wiesli P, Brändle M, et al. Impact of thyroid dysfunction on serum cystatin C. Kidney Int. 2003;63:1944–1947.
- Schanz M, Pannes D, Dippon J, et al. The influence of thyroid function, inflammation, and obesity on risk prediction of acute kidney injury by cystatin C in the emergency department. Kidney Blood Press Res. 2016;41:604–613.
- Wang F, Pan W, Wang H, et al. The impacts of thyroid function on the diagnostic accuracy of cystatin C to detect acute kidney injury in ICU patients: a prospective, observational study. Crit Care. 2014;18:R9.
- Knight EL, Verhave JC, Spiegelman D, et al. Factors influencing serum cystatin C levels other than renal function and the impact on renal function measurement. Kidney Int. 2004;65:1416–1421.
- Grubb A, Björk J, Nyman U, et al. Cystatin C, a marker for successful aging and glomerular filtration rate, is not influenced by inflammation. Scand J Clin Lab Invest. 2011;71:145–149.
- Randers E, Kristensen JH, Erlandsen EJ, et al. Serum cystatin C as a marker of the renal function. Scand J Clin Lab Invest. 1998;58:585–592.
- Bökenkamp A, Herget-Rosenthal S, Bökenkamp R. Cystatin C, kidney function and cardiovascular disease. Pediatr Nephrol. 2006;21:1223–1230.
- Shlipak MG, Sarnak MJ, Katz R, et al. Cystatin C and the risk of death and cardiovascular events among elderly persons. N Engl J Med. 2005;352:2049–2060.
- Dardashti A, Nozohoor S, Grubb A, et al. Shrunken Pore Syndrome is associated with a sharp rise in mortality in patients undergoing elective coronary artery bypass grafting. Scand J Clin Lab Invest. 2016;76:74–81.
- Bökenkamp A, Ciarimboli G, Dieterich C. Cystatin C in a rat model of end-stage renal failure. Ren Fail. 2001;23:431–438.
- Loew M, Hoffmann MM, Koenig W, et al. Genotype and plasma concentration of cystatin C in patients with coronary heart disease and risk for secondary cardiovascular events. Arterioscler Thromb Vasc Biol. 2005;25:1470–1474.
- Groesbeck D, Köttgen A, Parekh R, et al. Age, gender, and race effects on cystatin C levels in US adolescents. Clin J Am Soc Nephrol. 2008;3:1777–1785.
- Kyhse-Andersen J, Schmidt C, Nordin G, et al. Serum cystatin C, determined by a rapid, automated particle-enhanced turbidimetric method, is a better marker than serum creatinine for glomerular filtration rate. Clin Chem. 1994;40:1921–1926.
- Finney H, Newman DJ, Gruber W, et al. Initial evaluation of cystatin C measurement by particle-enhanced immunonephelometry on the Behring nephelometer systems (BNA, BN II). Clin Chem. 1997;43:1016–1022.
- Ristiniemi N, Qin QP, Postnikov A, et al. Dry-reagent double-monoclonal assay for cystatin C. Clin Chem. 2010;56:1424–1431.
- Ristiniemi N, Savage C, Bruun L, et al. Evaluation of a new immunoassay for cystatin C, based on a double monoclonal principle, in men with normal and impaired renal function. Nephrol Dial Transplant. 2012;27:682–687.
- Yang SK, Liu J, Zhang XM, et al. Diagnostic accuracy of serum cystatin C for the evaluation of renal dysfunction in diabetic patients: a meta-analysis. Ther Apher Dial. 2016;20:579–587.
- Schwartz GJ, Schneider MF, Maier PS, et al. Improved equations estimating GFR in children with chronic kidney disease using an immunonephelometric determination of cystatin C. Kidney Int. 2012;82:445–453.
- Allegaert K, Mekahli D, van den Anker J. Cystatin C in newborns: a promising renal biomarker in search for standardization and validation. J Matern Fetal Neonatal Med. 2015;28:1833–1838.
- Grubb A, Blirup-Jensen S, Lindström V, et al. First certified reference material for cystatin C in human serum ERM-DA471/IFCC. Clin Chem Lab Med. 2010;48:1619–1621.
- Grubb A, Horio M, Hansson LO, et al. Generation of a new cystatin C-based estimating equation for glomerular filtration rate by use of 7 assays standardized to the international calibrator. Clin Chem. 2014;60:974–986.
- Delanaye P, Pieroni L, Abshoff C, et al. Analytical study of three cystatin C assays and their impact on cystatin C-based GFR-prediction equations. Clin Chim Acta. 2008;398:118–124.
- Akbas N, Gonzalez G, Devaraj S. Evaluation of the lipid interference for siemens BN ProSpec cystatin C assay using pediatric samples. Ann Clin Lab Sci. 2015;45:562–564.
- Witzel SH, Butts K, Filler G. Elevated triglycerides may affect cystatin C recovery. Clin Biochem. 2014;47:676–678.
- Finney H, Newman DJ, Thakkar H, et al. Reference ranges for plasma cystatin C and creatinine measurements in premature infants, neonates, and older children. Arch Dis Child. 2000;82:71–75.
- Bökenkamp A, Dieterich C, Schumann G. Pediatric reference values for cystatin C revisited. Pediatr Nephrol. 1999;13:367–368.
- Nakashima T, Inoue H, Fujiyoshi J, et al. Longitudinal analysis of serum cystatin C for estimating the glomerular filtration rate in preterm infants. Pediatr Nephrol. 2016;31:983–989.
- Marmarinos A, Garoufi A, Panagoulia A, et al. Cystatin-C levels in healthy children and adolescents: influence of age, gender, body mass index and blood pressure. Clin Biochem. 2016;49:150–153.
- Cataldi L, Mussap M, Bertelli L, et al. Cystatin C in healthy women at term pregnancy and in their infant newborns: relationship between maternal and neonatal serum levels and reference values. Am J Perinatol. 1999;16:287–295.
- Kort SA, Bouman AA, Blankenstein MA, et al. Cystatin C can be measured reliably in capillary blood samples. Clin Chem. 2005;51:903–904.
- van Deutekom AW, Zur B, van Wijk JA, et al. Measurement of cystatin C in capillary blood samples in pediatric patients. Clin Biochem. 2010;43:335–337.
- Blufpand HN, Tromp J, Abbink FC, et al. Cystatin C more accurately detects mildly impaired renal function than creatinine in children receiving treatment for malignancy. Pediatr Blood Cancer. 2011;57:262–267.
- Pham-Huy A, Leonard M, Lepage N, et al. Measuring glomerular filtration rate with cystatin C and beta-trace protein in children with spina bifida. J Urol. 2003;169:2312–2315.
- Brinkert F, Kemper MJ, Briem-Richter A, et al. High prevalence of renal dysfunction in children after liver transplantation: non-invasive diagnosis using a cystatin C-based equation. Nephrol Dial Transplant. 2011;26:1407–1412.
- Urade Y, Hayaishi O. Biochemical, structural, genetic, physiological, and pathophysiological features of lipocalin-type prostaglandin D synthase. Biochim Biophys Acta. 2000;1482:259–271.
- Bökenkamp A, Franke I, Schlieber M, et al. Beta-trace protein – a marker of kidney function in children: “Original research communication-clinical investigation”. Clin Biochem. 2007;40:969–975.
- Tanaka T, Urade Y, Kimura H, et al. Lipocalin-type prostaglandin D synthase (beta-trace) is a newly recognized type of retinoid transporter. J Biol Chem. 1997;272:15789–15795.
- Beuckmann CT, Aoyagi M, Okazaki I, et al. Binding of biliverdin, bilirubin, and thyroid hormones to lipocalin-type prostaglandin D synthase. Biochemistry. 1999;38:8006–8013.
- Kanekiyo T, Ban T, Aritake K, et al. Lipocalin-type prostaglandin D synthase/beta-trace is a major amyloid beta-chaperone in human cerebrospinal fluid. Proc Natl Acad Sci USA. 2007;104:6412–6417.
- van der Wielen N, Gemke Q, Rinkel R, et al. Failure to thrive related to nasal encephalocele in a toddler: a diagnostic challenge. J Pediatr Neurol. 2016;14:039–042.
- Tumani H, Reiber H, Nau R, et al. Beta-trace protein concentration in cerebrospinal fluid is decreased in patients with bacterial meningitis. Neurosci Lett. 1998;242:5–8.
- Hoffmann A, Nimtz M, Conradt HS. Molecular characterization of beta-trace protein in human serum and urine: a potential diagnostic marker for renal diseases. Glycobiology. 1997;7:499–506.
- White CA, Ghazan-Shahi S, Adams MA. β-Trace protein: a marker of GFR and other biological pathways. Am J Kidney Dis. 2015;65:131–146.
- Filler G, Kusserow C, Lopes L, et al. Beta-trace protein as a marker of GFR-history, indications, and future research. Clin Biochem. 2014;47:1188–1194.
- Olsson JE, Link H, Nosslin B. Metabolic studies on 125I-labelled beta-trace protein, with special reference to synthesis within the central nervous system. J Neurochem. 1973;21:1153–1159.
- Filler G, Priem F, Lepage N, et al. Beta-trace protein, cystatin C, beta(2)-microglobulin, and creatinine compared for detecting impaired glomerular filtration rates in children. Clin Chem. 2002;48:729–736.
- Witzel SH, Huang SH, Braam B, et al. Estimation of GFR using β-trace protein in children. Clin J Am Soc Nephrol. 2015;10:401–409.
- Inker LA, Tighiouart H, Coresh J, et al. GFR Estimation Using β-Trace Protein and β2-Microglobulin in CKD. Am J Kidney Dis. 2016;67:40–48.
- Donadio C, Bozzoli L. Urinary β-trace protein: a unique biomarker to screen early glomerular filtration rate impairment. Medicine (Baltimore). 2016;95:e5553.
- Donadio C. Serum and urinary markers of early impairment of GFR in chronic kidney disease patients: diagnostic accuracy of urinary β-trace protein. Am J Physiol Renal Physiol. 2010;299:F1407–F1423.
- Abbink FC, Laarman CA, Braam KI, et al. Beta-trace protein is not superior to cystatin C for the estimation of GFR in patients receiving corticosteroids. Clin Biochem. 2008;41:299–305.
- Tin A, Astor BC, Boerwinkle E, et al. Genome-wide significant locus of beta-trace protein, a novel kidney function biomarker, identified in European and African Americans. Nephrol Dial Transplant. 2013;28:1497–1504.
- Wong J, Sridharan S, Berdeprado J, et al. Predicting residual kidney function in hemodialysis patients using serum β-trace protein and β2-microglobulin. Kidney Int. 2016;89:1090–1098.
- Donadio C, Tognotti D, Caponi L, et al. β-trace protein is highly removed during haemodialysis with high-flux and super high-flux membranes. BMC Nephrol. 2017;18:68.
- Bariciak E, Yasin A, Harrold J, et al. Preliminary reference intervals for cystatin C and beta-trace protein in preterm and term neonates. Clin Biochem. 2011;44:1156–1159.
- Donadio C, Lucchesi A, Ardini M, et al. Serum levels of beta-trace protein and glomerular filtration rate – preliminary results. J Pharm Biomed Anal. 2003;32:1099–1104.
- Kristensen K, Strevens H, Lindström V, et al. Increased plasma levels of beta2-microglobulin, cystatin C and beta-trace protein in term pregnancy are not due to utero-placental production. Scand J Clin Lab Invest. 2008;68:649–653.
- Drüeke TB, Massy ZA. Beta2-microglobulin. Semin Dial. 2009;22:378–380.
- Grey HM, Kubo RT, Colon SM, et al. The small subunit of HL-A antigens is beta 2-microglobulin. J Exp Med. 1973;138:1608–1612.
- Li L, Dong M, Wang XG. The implication and significance of Beta 2 microglobulin: a conservative multifunctional regulator. Chin Med J. 2016;129:448–455.
- Walters MT, Stevenson FK, Goswami R, et al. Comparison of serum and synovial fluid concentrations of beta 2-microglobulin and C reactive protein in relation to clinical disease activity and synovial inflammation in rheumatoid arthritis. Ann Rheum Dis. 1989;48:905–911.
- Gauthier C, Nguyen-Simonnet H, Vincent C, et al. Renal tubular absorption of beta 2 microglobulin. Kidney Int. 1984;26:170–175.
- Norden AG, Lapsley M, Lee PJ, et al. Glomerular protein sieving and implications for renal failure in Fanconi syndrome. Kidney Int. 2001;60:1885–1892.
- Karlsson FA, Groth T, Sege K, et al. Turnover in humans of beta 2-microglobulin: the constant chain of HLA-antigens. Eur J Clin Invest. 1980;10:293–300.
- Berggård I, Bearn AG. Isolation and properties of a low molecular weight beta-2-globulin occurring in human biological fluids. J Biol Chem. 1968;243:4095–4103.
- Cooper EH, Forbes MA, Hambling MH. Serum beta 2-microglobulin and C reactive protein concentrations in viral infections. J Clin Pathol. 1984;37:1140–1143.
- Fahey JL, Taylor JM, Detels R, et al. The prognostic value of cellular and serologic markers in infection with human immunodeficiency virus type 1. N Engl J Med. 1990;322:166–172.
- Teasdale C, Mander AM, Fifield R, et al. Serum beta2-microglobulin in controls and cancer patients. Clin Chim Acta. 1977;78:135–143.
- Mazher N, Ahmad N, Iqbal Z. Correlation of patterns of bone marrow infiltration and biochemical factors in non-Hodgkin lymphoma. Pak J Med Sci. 2017;33:462–465.
- Bökenkamp A, Grabensee A, Stoffel-Wagner B, et al. The beta2-microglobulin/cystatin C ratio – a potential marker of post-transplant lymphoproliferative disease. Clin Nephrol. 2002;58:417–422.
- Flöge J, Granolleras C, Shaldon S, et al. Dialysis-associated amyloidosis and beta-2-microglobulin. Contrib Nephrol. 1988;61:27–36.
- Mátrai Z, Németh J, Miklós K, et al. Serum beta2-microglobulin measured by immunonephelometry: expression patterns and reference intervals in healthy adults. Clin Chem Lab Med. 2009;47:585–589.
- Bernard AM, Vyskocil A, Lauwerys RR. Determination of beta 2-microglobulin in human urine and serum by latex immunoassay. Clin Chem. 1981;27:832–837.
- Zerbini CA, Anderson JJ, Kane KA, et al. Beta 2 microglobulin serum levels and prediction of survival in AL amyloidosis. Amyloid. 2002;9:242–246.
- Kelly J, Raizman JE, Bevilacqua V, et al. Complex reference value distributions and partitioned reference intervals across the pediatric age range for 14 specialized biochemical markers in the CALIPER cohort of healthy community children and adolescents. Clin Chim Acta. 2015;450:196–202.
- Ikezumi Y, Honda M, Matsuyama T, et al. Establishment of a normal reference value for serum β2 microglobulin in Japanese children: reevaluation of its clinical usefulness. Clin Exp Nephrol. 2013;17:99–105.
- Dommergues M, Muller F, Ngo S, et al. Fetal serum beta2-microglobulin predicts postnatal renal function in bilateral uropathies. Kidney Int. 2000;58:312–316.
- Spaggiari E, Faure G, Dreux S, et al. Sequential fetal serum β2-microglobulin to predict postnatal renal function in bilateral or low urinary tract obstruction. Ultrasound Obstet Gynecol. 2017;49:617–622.
- Musiol K, Sobol-Milejska G, Nowotka Ł, et al. Renal function in children treated for central nervous system malignancies. Childs Nerv Syst. 2016;32:1431–1440.
- Rule AD, Bergstralh EJ, Slezak JM, et al. Glomerular filtration rate estimated by cystatin C among different clinical presentations. Kidney Int. 2006;69:399–405.
- de Souza V, Cochat P, Rabilloud M, et al. Accuracy of different equations in estimating GFR in pediatric kidney transplant recipients. Clin J Am Soc Nephrol. 2015;10:463–470.
- Levey AS, Coresh J, Greene T, et al. Using standardized serum creatinine values in the modification of diet in renal disease study equation for estimating glomerular filtration rate. Ann Intern Med. 2006;145:247–254.
- Cockcroft DW, Gault MH. Prediction of creatinine clearance from serum creatinine. Nephron. 1976;16:31–41.
- Filler G, Guerrero-Kanan R, Alvarez-Elías AC. Assessment of glomerular filtration rate in the neonate: is creatinine the best tool? Curr Opin Pediatr. 2016;28:173–179.
- Abitbol CL, Seeherunvong W, Galarza MG, et al. Neonatal kidney size and function in preterm infants: what is a true estimate of glomerular filtration rate? J Pediatr. 2014;164:1026–1031.e2.
- Krouwer JS. Why Bland-Altman plots should use X, not (Y + X)/2 when X is a reference method. Stat Med. 2008;27:778–780.
- Zweig MH. ROC plots display test accuracy, but are still limited by the study design. Clin Chem. 1993;39:1345–1346.
- Kwong YT, Stevens LA, Selvin E, et al. Imprecision of urinary iothalamate clearance as a gold-standard measure of GFR decreases the diagnostic accuracy of kidney function estimating equations. Am J Kidney Dis. 2010;56:39–49.
- Brochner-Mortensen J, Christoffersen J. Single injection (51Cr)EDTA plasma clearance determination in children using capillary blood samples. Scand J Clin Lab Invest. 1977;37:631–633.
- Perrin N, Berg UB. Estimated glomerular filtration rates cannot replace measured GFR in type 1 diabetes patients with hyperfiltration. Acta Paediatr. 2015;104:730–737.
- Braat E, Hoste L, De Waele L, et al. Renal function in children and adolescents with Duchenne muscular dystrophy. Neuromuscul Disord. 2015;25:381–387.
- Schwartz GJ, Feld LG, Langford DJ. A simple estimate of glomerular filtration rate in full-term infants during the first year of life. J Pediatr. 1984;104:849–854.
- Schwartz GJ, Gauthier B. A simple estimate of glomerular filtration rate in adolescent boys. J Pediatr. 1985;106:522–526.
- Counahan R, Chantler C, Ghazali S, et al. Estimation of glomerular filtration rate from plasma creatinine concentration in children. Arch Dis Child. 1976;51:875–878.
- Bökenkamp A, Domanetzki M, Zinck R, et al. Cystatin C – a new marker of glomerular filtration rate in children independent of age and height. Pediatrics. 1998;101:875–881.
- Uemura O, Nagai T, Ishikura K, et al. Creatinine-based equation to estimate the glomerular filtration rate in Japanese children and adolescents with chronic kidney disease. Clin Exp Nephrol. 2014;18:626–633.
- Ikezumi Y, Uemura O, Nagai T, et al. Beta-2 microglobulin-based equation for estimating glomerular filtration rates in Japanese children and adolescents. Clin Exp Nephrol. 2015;19:450–457.
- Léger F, Bouissou F, Coulais Y, et al. Estimation of glomerular filtration rate in children. Pediatr Nephrol. 2002;17:903–907.
- Brandt JR, Wong C, Jones DR, et al. Glomerular filtration rate in children with solid tumors: normative values and a new method for estimation. Pediatr Hematol Oncol. 2003;20:309–318.
- Filler G, Lepage N. Should the Schwartz formula for estimation of GFR be replaced by cystatin C formula? Pediatr Nephrol. 2003;18:981–985.
- Grubb A, Nyman U, Björk J, et al. Simple cystatin C-based prediction equations for glomerular filtration rate compared with the modification of diet in renal disease prediction equation for adults and the Schwartz and the Counahan-Barratt prediction equations for children. Clin Chem. 2005;51:1420–1431.
- Benlamri A, Nadarajah R, Yasin A, et al. Development of a beta-trace protein based formula for estimation of glomerular filtration rate. Pediatr Nephrol. 2010;25:485–490.
- Millisor VE, Roberts JK, Sun Y, et al. Derivation of new equations to estimate glomerular filtration rate in pediatric oncology patients. Pediatr Nephrol. 2017;32:1575–1584.
- Inker LA, Schmid CH, Tighiouart H, et al. Estimating glomerular filtration rate from serum creatinine and cystatin C. N Engl J Med. 2012;367:20–29.
- Nyman U, Björk J, Lindström V, et al. The Lund-Malmö creatinine-based glomerular filtration rate prediction equation for adults also performs well in children. Scand J Clin Lab Invest. 2008;68:568–576.
- Zappitelli M, Parvex P, Joseph L, et al. Derivation and validation of cystatin C-based prediction equations for GFR in children. Am J Kidney Dis. 2006;48:221–230.
- Pottel H, Hoste L, Martens F. A simple height-independent equation for estimating glomerular filtration rate in children. Pediatr Nephrol. 2012;27:973–979.
- Hoste L, Dubourg L, Selistre L, et al. A new equation to estimate the glomerular filtration rate in children, adolescents and young adults. Nephrol Dial Transplant. 2014;29:1082–1091.
- Blufpand HN, Westland R, van Wijk JA, et al. Height-independent estimation of glomerular filtration rate in children: an alternative to the Schwartz equation. J Pediatr. 2013;163:1722–1727.
- Pottel H, Hoste L, Dubourg L, et al. An estimated glomerular filtration rate equation for the full age spectrum. Nephrol Dial Transplant. 2016;31:798–806.
- Selistre L, De Souza V, Cochat P, et al. GFR estimation in adolescents and young adults. J Am Soc Nephrol. 2012;23:989–996.
- Delanaye P, Melsom T, Ebert N, et al. Iohexol plasma clearance for measuring glomerular filtration rate in clinical practice and research: a review. Part 2: why to measure glomerular filtration rate with iohexol? Clin Kidney J. 2016;9:700–704.
- Myers GL, Miller WG, Coresh J, et al. Recommendations for improving serum creatinine measurement: a report from the Laboratory Working Group of the National Kidney Disease Education Program. Clin Chem. 2006;52:5–18.
- Delanaye P, Cavalier E, Cristol JP, et al. Calibration and precision of serum creatinine and plasma cystatin C measurement: impact on the estimation of glomerular filtration rate. J Nephrol. 2014;27:467–475.
- Bargnoux AS, Piéroni L, Cristol JP, et al. Multicenter evaluation of cystatin C measurement after assay standardization. Clin Chem. 2017;63:833–841.
- Ebert N, Delanaye P, Shlipak M, et al. Cystatin C standardization decreases assay variation and improves assessment of glomerular filtration rate. Clin Chim Acta. 2016;456:115–121.
- Schwartz GJ, Work DF. Measurement and estimation of GFR in children and adolescents. Clin J Am Soc Nephrol. 2009;4:1832–1843.
- Hari P, Biswas B, Pandey R, et al. Updated height- and creatinine-based equation and its validation for estimation of glomerular filtration rate in children from developing countries. Clin Exp Nephrol. 2012;16:697–705.
- Nagai T, Uemura O, Ishikura K, et al. Creatinine-based equations to estimate glomerular filtration rate in Japanese children aged between 2 and 11 years old with chronic kidney disease. Clin Exp Nephrol. 2013;17:877–881.
- Uemura O, Nagai T, Ishikura K, et al. Cystatin C-based equation for estimating glomerular filtration rate in Japanese children and adolescents. Clin Exp Nephrol. 2014;18:718–725.
- Pottel H, Delanaye P, Schaeffner E, et al. Estimating glomerular filtration rate for the full age spectrum from serum creatinine and cystatin C. Nephrol Dial Transplant. 2017;32:497–507.
- De Souza VC, Rabilloud M, Cochat P, et al. Schwartz formula: is one k-coefficient adequate for all children? PLoS One. 2012;7:e53439.
- Berg UB, Nyman U, Bäck R, et al. New standardized cystatin C and creatinine GFR equations in children validated with inulin clearance. Pediatr Nephrol. 2015;30:1317–1326.
- Chehade H, Cachat F, Jannot AS, et al. New combined serum creatinine and cystatin C quadratic formula for GFR assessment in children. Clin J Am Soc Nephrol. 2014;9:54–63.
- Bouvet Y, Bouissou F, Coulais Y, et al. GFR is better estimated by considering both serum cystatin C and creatinine levels. Pediatr Nephrol. 2006;21:1299–1306.
- Leion F, Hegbrant J, den Bakker E, et al. Estimating glomerular filtration rate (GFR) in children. The average between a cystatin C- and a creatinine-based equation improves estimation of GFR in both children and adults and enables diagnosing Shrunken Pore Syndrome. Scand J Clin Lab Invest. 2017;77:338–344.
- Grubb A, Nyman U, Björk J. Improved estimation of glomerular filtration rate (GFR) by comparison of eGFRcystatin C and eGFRcreatinine. Scand J Clin Lab Invest. 2012;72:73–77.
- Grubb A. Non-invasive estimation of glomerular filtration rate (GFR). The Lund model: Simultaneous use of cystatin C- and creatinine-based GFR-prediction equations, clinical data and an internal quality check. Scand J Clin Lab Invest. 2010;70:65–70.
- van Roij KG, van der Horst HJ, Hubeek I, et al. Discrepant results of serum creatinine and cystatin C in a urological patient. Clin Chem. 2017;63:812–814.
- Grubb A, Lindström V, Jonsson M, et al. Reduction in glomerular pore size is not restricted to pregnant women. Evidence for a new syndrome: ‘Shrunken pore syndrome’. Scand J Clin Lab Invest. 2015;75:333–340.