
Abstract
Formaldehyde is a reactive aldehyde naturally present in all plant and animal tissues and a critical component of the one-carbon metabolism pathway. It is also a high production volume chemical used in the manufacture of numerous products. Formaldehyde is also one of the most well-studied chemicals with respect to environmental fate, biology, and toxicology—including carcinogenic potential, and mode of action (MOA). In 2006, a published MOA for formaldehyde-induced nasal tumors in rats concluded that nasal tumors were most likely driven by cytotoxicity and regenerative cell proliferation, with possible contributions from direct genotoxicity. In the past 15 years, new research has better informed the MOA with the publication of in vivo genotoxicity assays, toxicogenomic analyses, and development of ultra-sensitive methods to measure endogenous and exogenous formaldehyde-induced DNA adducts. Herein, we review and update the MOA for nasal tumors, with particular emphasis on the numerous studies published since 2006. These new studies further underscore the involvement of cytotoxicity and regenerative cell proliferation, and further inform the genotoxic potential of inhaled formaldehyde. The data lend additional support for the use of mechanistic data for the derivation of toxicity criteria and/or scientifically supported approaches for low-dose extrapolation for the risk assessment of formaldehyde.
1. Introduction
Formaldehyde is a reactive aldehyde present endogenously in all tissues. It is generated in both the cytoplasm and the nucleus as part of normal cellular processes, including the one-carbon metabolic pathway (IARC Citation2006; Walport et al. Citation2016). Formaldehyde is also a high production volume chemical used in the manufacture of numerous products including urea-formaldehyde, phenol-formaldehyde, and melamine-formaldehyde resins and serves as an adhesive in the production of particle board, medium-density fiberboard, and plywood (Salthammer et al. Citation2010; U.S. EPA Citation2019). Due to its commercial importance, it is one of the most well-studied compounds with respect to toxicology, carcinogenicity, and mechanism of action. In addition to the extensive amount of published toxicological and mechanistic research, considerable effort has been expended integrating these data for the purpose of setting safety standards for formaldehyde (Andersen et al. Citation2019).
In laboratory rodents, inhalation of formaldehyde has clearly been shown to induce site of contact tumors in the nasal cavity, but not in the lung or any other organs (Kerns et al. Citation1983). In humans, occupational exposure to formaldehyde has been linked to nasopharyngeal cancer (NPC) and lymphohematopoietic (LHP) cancers (Hauptmann et al. Citation2003, Citation2004; Beane Freeman et al. Citation2009); however, these epidemiology studies have generally shown weak and/or inconsistent relationships (Marsh and Youk Citation2005; Marsh et al. Citation2010; Checkoway et al. Citation2015; Mohner et al. Citation2019). Moreover, these associations have typically involved peak exposure metrics, a variable and poorly characterized exposure metric (Checkoway et al. Citation2019), that, as will be shown herein, is inconsistent with animal evidence for the requirement of prolonged exposure to cytotoxic concentrations of formaldehyde to induce cancer.
The current cancer toxicity criteria for formaldehyde in U.S. EPA’s Integrated Risk Information System (IRIS) database was developed in 1987 and is based on nasal tumors in rodents and a default assumed linear relationship between exposure and cancer risk. The 1 in 10,000 extra cancer risk listed in IRIS is 6.5 ppb; for reference, typical indoor formaldehyde levels are ≤80 ppb, outdoor urban air concentrations are 10–50 ppb, and outdoor rural air concentrations are 1–10 ppb (Salthammer Citation2013). As discussed in this review, a considerable amount of formaldehyde research was conducted from the 1980s to early 2000s at the Chemical Industry Institute of Toxicology (CIIT) and subsequently at the Hamner Institutes for Health Sciences to inform the risk assessment of nasal tumors. This culminated in one of the first biologically-based dose-response models for predicting chemical-specific cancer risk, namely formaldehyde-induced nasal tumors (Conolly et al. Citation2003, Citation2004). However, a 2010 U.S. EPA draft assessment for formaldehyde proposed new toxicity criteria based on the combined risk of NPC and LHP from the aforementioned controversial epidemiological data and the assumption of a linear relationship between formaldehyde exposure and such cancers (U.S. EPA Citation2010). The proposed 1 in 10,000 extra risk for cancer is 0.8 ppb (U.S. EPA Citation2010), which is ∼10-fold lower than the current IRIS value (see above); however, this draft assessment has never been finalized.
The U.S. EPA’s reliance on uncertain epidemiology data, the lack of mechanistic support for systemic effects, and default assumptions about a linear relationship between formaldehyde exposure and cancer risk was criticized in a National Academy of Science review of U.S. EPA’s draft assessment (NAS Citation2011), and underscored the need for additional research on both portal of entry and systemic cancer risk of inhaled formaldehyde. With regard to portal of entry effects, the most recently published peer-reviewed manuscript describing the mode of action (MOA)Footnote1 for formaldehyde-induced nasal tumors in rats was conducted over a decade ago (McGregor et al. Citation2006), and concluded that the MOA was most likely driven by cytotoxicity and regenerative cell proliferation, with possible contributions from direct genotoxicity. In the 14 years since the McGregor et al. (Citation2006) evaluation, new research has addressed some of the data gaps in the MOA and human relevance of rat nasal tumors. Herein, we review the MOA literature, with particular emphasis on updating the MOA and human relevance evaluation of formaldehyde-induced nasal tumors in rats using methods consistent with established MOA and human relevance frameworks (Sonich-Mullin et al. Citation2001; Meek et al. Citation2003; U.S. EPA Citation2005; Boobis et al. Citation2006, Citation2008; Meek, Palermo et al. Citation2014). This work is highly relevant as the U.S. EPA has designated formaldehyde as a high-priority substance for risk evaluation under the Toxic Substances Control Act (TSCA) (U.S. EPA Citation2019), a process that recommends that MOA or adverse outcome pathway (AOP) analyses be included as part of a risk evaluation (U.S. EPA Citation2017).
2. Methods
2.1. Literature search/review
The primary literature considered for this evaluation included literature obtained via search engines, review of literature cited in draft and final regulatory reviews such as U.S. EPA (Citation2010) and ECHA (Citation2019), and “reference harvesting.” Literature searches were conducted using the National Library of Medicine’s PubMed and Embase® search engines. For searches specific to the in vivo genotoxicity of formaldehyde, inclusion criteria included in vivo genotoxicity studies in mammals (including controlled human exposures) and were limited to articles published in the English language. Query details are included in Supplemental Table S1.
Table 1. Nasal tumor incidence in formaldehyde inhalation studies.
2.2. Study quality scoring
A critical uncertainty identified in previous MOA analyses of formaldehyde is whether genotoxicity is an initiating event or the result of prolonged increased cell proliferation. Because in vivo genotoxicity assays have the potential to address this important data gap, study quality was assessed for in vivo genotoxicity studies using scoring criteria described under TSCA (U.S. EPA Citation2018). A total of 817 studies were initially identified in the literature search described above, of which 23 studies were considered relevant by searching abstracts and titles. Of these, 16 studies were found to contain potentially relevant data and were therefore subject to TSCA scoring. Titles and abstracts were screened by two reviewers to identify a list of potentially relevant studies. Articles were then reviewed to confirm relevance and then scored independently by two reviewers. Discrepancies in scoring were subsequently discussed and addressed to reach consensus scores for all relevant studies.
2.3. Mode of Action Analysis
Prior to conducting an updated MOA analysis, the data identified from the literature searching were organized according to several factors identified by Eastmond (Citation2012) as influencing regulatory decisions on whether a chemical acts through a mutagenic or nonmutagenic MOA: (1) the nature of the tumors of interest, (2) the mutational spectrum of the tumors, (3) chemical properties of the carcinogen, (4) dosimetry and toxicokinetics, and (5) an evaluation of the in vivo genotoxicity. In addition, a previously published MOA for formaldehyde-induced nasal tumors (McGregor et al. Citation2006) was evaluated and updated based on data collected over the past decade. The application of the identified data into the MOA and human relevance analysis herein followed established frameworks (Sonich-Mullin et al. Citation2001; Meek et al. Citation2003; U.S. EPA Citation2005; Boobis et al. Citation2006, Citation2008; Meek, Boobis et al. Citation2014; Meek, Palermo et al. Citation2014).
3. Results
3.1. Carcinogenicity of formaldehyde
Mode of action analysis is most frequently conducted for the purpose of assessing the human relevance of tumors observed in rodents and for informing the most appropriate quantitative approaches for developing safe exposure levels (U.S. EPA Citation2005). Formaldehyde has been controversially linked to NPC and leukemia in occupational settings (Hauptmann et al. Citation2003; Citation2004; Marsh and Youk Citation2005; Beane Freeman et al. Citation2009; Marsh et al. Citation2010; Rhomberg et al. Citation2011; Checkoway et al. Citation2015, Citation2019; Mohner et al. Citation2019). A statistical association of formaldehyde exposure with leukemia has not been consistently observed in retrospective epidemiology studies, and it has been suggested that any causal association postulated lacks biological plausibility (Heck and Casanova Citation2004; Swenberg et al. Citation2013). The present article therefore focuses on nasal tumors unequivocally associated with formaldehyde exposure to rodents.
3.1.1. Oral carcinogenicity of formaldehyde
The carcinogenicity of formaldehyde has been assessed in several animal bioassays. Two drinking water studies in rats found that chronic exposure up to 300 mg/kg-day was not carcinogenic to the gastrointestinal tract, nor did formaldehyde increase tumors in other organs (Til et al. Citation1989; Tobe et al. Citation1989). In the high dose groups, both studies reported treatment-related non-neoplastic lesions in the forestomach and glandular stomach indicative of cytotoxicity and regenerative hyperplasia. These proliferative effects were thought to explain neoplasms observed in the stomachs of rats exposed to formaldehyde after first being exposed 8 weeks to the mutagenic and carcinogenic nitrosamine N-methyl-N′-nitro-N-nitrosoguanidine (MNNG) (Takahashi et al. Citation1986), as formaldehyde alone does not increase the incidence of stomach tumors. A drinking water study conducted at the Ramazzini Institute (with exposures up to 1500 mg/L), published in two articles (Soffritti et al. Citation1989, Citation2002), reported hematopoietic malignancies in rats. Notably, both studies have been criticized by the Agency for Toxic Substances and Disease Registry and European Food Safety Authority (ATSDR Citation1999; EFSA Citation2006; Rhomberg et al. Citation2011), and the U.S. EPA draft assessment of formaldehyde (U.S. EPA Citation2010) does not mention these two articles in their section on chronic oral bioassays. Based on independent expert evaluations of leukemia and lymphoma diagnoses in studies conducted at the Ramazzini Institute, the U.S. EPA has decided not to rely on lymphomas and leukemias reported in several Ramazzini Institute studies for use in IRIS risk assessmentsFootnote2. Readers are referred to a National Toxicology Program (NTP) memo for more details on data quality findings related to the Ramazzini Institute (Malarkey and Bucher Citation2011).
3.1.2. Inhalation Carcinogenicity of formaldehyde
The only clear association between formaldehyde exposure and carcinogenicity arises from chronic inhalation studies in rats. Two large, multi-dose chronic inhalation bioassays for formaldehyde report tumors in the nasal passages of rats exposed to ≥6 ppm formaldehyde, with no evidence for carcinogenicity in the lower airways or in other tissues. The earlier study was conducted by Battelle, Columbus Laboratories, and submitted to the Chemical Industry Institute of Technology (Pavkov et al. Citation1982). Results from F344 rats were published first as a communication (Swenberg et al. Citation1980), and again (along with results in B6C3F1 mice) in a final report (Kerns et al. Citation1983). In these studies, rats and mice were exposed to ∼2, 6, or 14 ppm formaldehyde for 6 h/day for 5 days/week for 2 years, with sacrifices at 6, 12, 18, 24, 27, and 30 months. The majority of formaldehyde-induced tumors were observed in the rat nasal cavity; depicts the anatomical regions and the epithelial lining of the rat nasal cavity discussed herein. Squamous cell carcinomas (SCC) were observed in 2/235 (0.8%) rats at 6 ppm and 103/232 (44%) at 14 ppm.
Figure 1. Rat nasal passages, tumor response, and dosimetry. (A) Diagrams of rodent nasal cavity demonstrating prominent bone structures and epithelial lining of the rat nasal cavity (adapted from Alvites et al. 2018). Diagram of the various Levels (I–IV) of the sagittal section of the rat nasal cavity (adapted from Kerns et al. Citation1983). The lower portion shows coronal sections at LI, LII and LIII, where the white represents air passages (meatuses) including the lateral meatus (L) and medial meatus (MM); the black represents bone (lined by epithelium), with nasal turbinates (N), maxilloturbinates (MT) and septum (S) (adapted from Harkema et al. Citation2006; reprinted by Permission of SAGE Publications, Inc.). The red circle at LII corresponds to the tumor shown in C, whereas the shaded blue region corresponds to the CFD flux estimates in D. (B) Dose-response for nasal tumors two animal bioassays (data adapted from U.S. EPA (Citation2010)). Green vertical line represents the dose (ppm) at which formaldehyde would increase tumor “extra risk” by 10% (data plotted using BMDS v3.1). (C) H&E stained early squamous cell carcinoma (arrow) arising from the nasoturbinates of a rat exposed to 15 ppm formaldehyde (adapted from Swenberg et al. Citation1980). The red circle corresponds to the red circle in A. (D) Map of simulated formaldehyde flux along airway walls based on CFD modeling in rat nose (coronal section) at 252 ml/min airflow (reprinted from Kimbell et al. (Citation1993) with permission from Elsevier). M: maximum mass flux at walls.
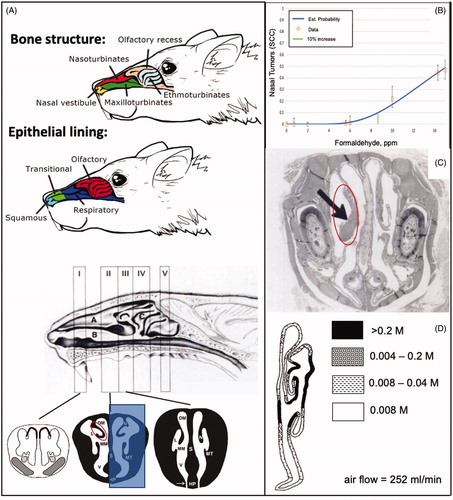
The second extensive formaldehyde inhalation study exposed F344 rats to 0.7, 2, 6, 10, and 15 ppm formaldehyde for 6 h/day 5 days per week for 2 years (Monticello et al. Citation1996). At study termination, 0/90, 0/90, 0/96, 1/90 (1%), 20/90 (22%), and 69/147 (47%) of rats had SCC in the 0, 0.7, 2, 6, 10, and 15 ppm groups, respectively. Together, Kerns et al. (Citation1983) and Monticello et al. (Citation1996) provide a well-defined dose-response for nasal SCC induction in rats (, ), as they provide overlapping dose ranges and consistent tumor responses.
Additional studies have shown nasal tumors in rats following repeat dose inhalation exposure to ≥6 ppm formaldehyde; however, many of these studies have fewer exposure concentrations, fewer animals per treatment group, or are less than two years in duration (). As such, they are considered to provide supporting information. One inhalation study of particular note explored the carcinogenicity of formaldehyde in rats with injured or intact mucosa (Woutersen et al. Citation1989). Specifically, Wistar rats were exposed to 0.1, 1, or 10 ppm formaldehyde 6 h/day for 5 days per week for 28 months. Nasal tissue damage was induced bilaterally in some rats by electrocoagulation to initiate regenerative hyperplasia prior to the start of formaldehyde exposure. In the control, 0.1, and 1 ppm groups, no more than one animal per condition (damaged or undamaged nose) exhibited SCC. Likewise, only one rat with undamaged mucosa developed SCC following exposure to 10 ppm formaldehyde. In contrast, 15/58 (26%) of rats with damaged mucosa developed nasal SCC. Woutersen et al. (Citation1989) concluded that tissue damage was an important contributing factor to nasal tumor response. This role of tissue damage is discussed further throughout this article.
Mice appear to be more resistant to formaldehyde, as inhalation studies in mice have shown limited evidence of nasal carcinogenicity. Exposure of mice to up to 163 ppm formaldehyde for 1 h/day for 3 days per week for up to 35 weeks did not result in nasal tumors, nor did additional exposure up to 224 ppm result in nasal tumors (Horton et al. Citation1963). Male and female B6C3F1 mice exposed chronically (6 h/day, 5 days per week for 2 years) to 2, 6, or 15 ppm formaldehyde showed limited evidence of carcinogenicity. Specifically, nasal tumors were only observed in two males (2/240) exposed to 14 ppm formaldehyde (Swenberg et al. Citation1980; Kerns et al. Citation1983) (). The much weaker response in mice is likely due to reduced tissue exposure in mice as a result of irritant induced reflex apnea (bradypnea), which is reported to result in a time-weighted average inhaled formaldehyde dose in mice approximately half of that in rats at exposure to 15 ppm (Chang et al. Citation1981, Citation1983; Chang and Barrow Citation1984). Hamsters chronically exposed to up to 10 ppm formaldehyde did not develop nasal tumors ().
In summary, the only tumors unequivocally associated with formaldehyde exposure in animals are nasal tumors in rats following inhalation exposure to ≥6 ppm formaldehyde. The balance of this review will therefore focus on evaluation of the MOA and human relevance of rat nasal tumors, and the application of this evaluation to inform approaches for the quantitative development of safe exposure levels to formaldehyde.
3.1.3. Mapping of nasal tumors in rats
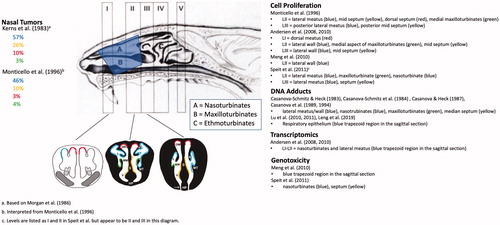
The majority of nasal tumors in rats occurred in the anterior portions of the nasal cavity, primarily in Levels I-III. The location of SCC in the nasal cavity from the Kerns et al. (Citation1983) bioassay was subsequently described more precisely in terms of the specific structures in the nasal passages (Morgan et al. Citation1986). As shown in , the nasal septum of rats generally provides a flat medial surface for each nasal passage, whereas the lateral wall of each nasal passage has a more complex surface structure, including bony turbinates that effectively create multiple lateral surfaces. Formaldehyde-induced tumors tended to arise on these turbinates and adjacent lateral walls; depicts an early SCC on the nasal turbinate (left side in photomicrograph). attempts to color code the “hot spots” for SCC using information from Morgan et al. (Citation1986) and Monticello et al. (Citation1996). The majority of SCC occurred on the anterior lateral meatus, followed by the posterior lateral meatus, anterior mid-septum, anterior dorsal septum, and anterior maxilloturbinates.
Figure 2. Mapping of regions of various effects of formaldehyde exposure and tissue collection regions. The percentage of nasal SCC in the rat cancer bioassays are shown on the left and color coded to the levels and anatomical regions (left air passage) shown in the middle diagram. Tissue harvest locations from select studies are listed on the right along with color coding to the levels and anatomical regions (right nasal passage) shown in the middle diagram. The shaded blue trapezoid region corresponds to tissue harvested for select assays listed on the right. Diagram of the sagittal section of the rat nasal cavity and coronal sections are adapted from Kerns et al. (Citation1983) and Harkema et al. (Citation2006), (reprinted by Permission of SAGE Publications, Inc.) respectively. See legend of for acronyms. Note: these color codings are interpretations by the authors based on the reported data and are for illustrative purposes only.
3.1.4. Mapping of squamous metaplasia and cell proliferation in rat nasal cavity
Formaldehyde carcinogenicity was accompanied by cytotoxicity, squamous metaplasia, and increased cell proliferation. Squamous metaplasia is indicative of prior or ongoing irritation and toxicity to the mucosa, and is an adaptive transformation of transitional and respiratory epithelium to multilayered squamous epithelium that is more resistant to physical and chemical injury (Miller and Cesta, Citation2014; Renne et al. Citation2009). As shown in , transitional and respiratory epithelium normally line the proximal portions of the nasal cavity. Repeated injury such as exposure to formaldehyde can induce a conversion of these epithelial linings to more protective squamous epithelium such as that lining the most anterior portions of the nose (nasal vestibule).
As described in Kerns et al. (Citation1983), squamous metaplasia was observed at LI following exposure to 2, 6, and 14 ppm at all time points evaluated. At LII, squamous metaplasia was observed following exposure to 6 and 14 ppm, whereas squamous metaplasia was present in levels I–V at 14 ppm. Monticello et al. (Citation1996) observed only minimal squamous metaplasia in the anterior portions of the nasal cavity of rats exposed to 6 ppm formaldehyde, and no such lesions in rats exposed to 0.7 or 2 ppm formaldehyde. In mice, squamous metaplasia was only observed at 14 ppm and only in LII after 18 and 24 months of exposure (Kerns et al. Citation1983). As previously noted, the muted toxicity and tumorigenic response in mice is likely due to reduced tissue exposure as a result of bradypnea (Chang et al. Citation1981, Citation1983; Chang and Barrow Citation1984).
As noted in the NTP Atlas of nonneoplastic lesions, squamous metaplasia and hyperplasia of the transitional and respiratory epithelium increase the number of cells but are not necessarily indicative of increased cellular regeneration (Miller and Cesta, Citation2014). While there is a burst of cell proliferation to repair acutely damaged mucosae and during the transition to squamous epithelium, this transient increase in proliferation may subside depending on subsequent levels of damage. Mucosae that have transitioned to the squamous epithelium in treated animals will have greater cellularity (e.g. hyperplasia) than transitional and respiratory epithelium in the same location of control animals, but may not necessarily be experiencing increased cell turnover resulting from cell loss. Thus, while exposure to ≥2 ppm formaldehyde increases squamous metaplasia and hyperplasia observed by standard H&E staining, other methods are needed to assess cell turnover in the nasal epithelium.
Monticello et al. (Citation1996) measured cell proliferation via osmotic pump administration of [methyl-3H]thymidine prior to interim sacrifices at 3, 6, 12, and 18 months of exposure to formaldehyde. Cell proliferation data were collected in seven anatomical regions of the nasal cavity (six are depicted in the right side of LII and LIII in ). Statistically significant increases in unit length labeling index (ULLI) were apparent in the 10 and 15 ppm groups at 3, 6, 12, and 18 months of exposure, whereas no significant increases were apparent in the 0.7, 2, or 6 ppm groups at any of these timepoints (). Cell proliferation data following shorter-term formaldehyde exposure were reported earlier using i.p. injection of labeled thymidine (Monticello et al. Citation1991). Although different labeling approaches can result in different labeling kinetics (Wood et al. Citation2015), the combined data are nonetheless critical for informing MOA and are depicted in . In shorter-term exposures (≤42 days), increased cell proliferation can also be observed at 6 ppm, with the largest increases in the lateral meatus and maxilloturbinates. Overall patterns presented in are (1) sustained increases in cell turnover occur above 6 ppm, and (2) increased cell turnover diminishes over time.
Figure 3. Cell proliferation in rat nasal tissue following subchronic and chronic inhalation exposure to formaldehyde. (A) Unit length labeling index in various regions of the nasal cavity following inhalation exposure to 0.7–15 ppm formaldehyde for 3–18 months (administration of [3H]thymidine by osmotic pumps). Data from Monticello et al. (Citation1996). (B) Unit length labeling index in various regions of the nasal cavity following inhalation exposure to 0.7–15 ppm formaldehyde for 1–42 days (administration of [3H]thymidine by i.p. injection). Data from Monticello et al. (Citation1991). ALM: anterior lateral meatus; PLM: posterior lateral meatus; AMS: anterior mid-septum; PMS: posterior mid-septum; MMX: medial maxilloturbinate.
![Figure 3. Cell proliferation in rat nasal tissue following subchronic and chronic inhalation exposure to formaldehyde. (A) Unit length labeling index in various regions of the nasal cavity following inhalation exposure to 0.7–15 ppm formaldehyde for 3–18 months (administration of [3H]thymidine by osmotic pumps). Data from Monticello et al. (Citation1996). (B) Unit length labeling index in various regions of the nasal cavity following inhalation exposure to 0.7–15 ppm formaldehyde for 1–42 days (administration of [3H]thymidine by i.p. injection). Data from Monticello et al. (Citation1991). ALM: anterior lateral meatus; PLM: posterior lateral meatus; AMS: anterior mid-septum; PMS: posterior mid-septum; MMX: medial maxilloturbinate.](/cms/asset/3ab408e8-7bdf-4923-ae11-af1d4dd831bd/itxc_a_1854679_f0003_c.jpg)
Monticello et al. (Citation1996) also demonstrated that, in addition to ULLI, the total number of cells present in a region was a likely contributing factor in carcinogenesis, as the correlation between tumor incidence and population-weighted ULLI (PWULLI) was ∼2-fold higher than ULLI alone. Indeed, the ULLI was comparable between the lateral meatus and medial maxillotrubinates (), yet the tumor response in the latter was much lower (, green region). However, the number of cells in the medial maxilloturbinates were ∼10% of those in the lateral meatus, resulting in large differences in PWULLI.
3.2. Key factors for MOA determinations
As described in the Methods, Eastmond (Citation2012) identified 10 factors influencing regulatory decisions regarding the MOA for carcinogens, with the most salient factors being: (1) the nature of the tumors of interest, (2) the mutational spectrum of the tumors, (3) chemical properties of the carcinogen, (4) toxicokinetics, (5) an evaluation of the in vivo genotoxicity (especially in target tissues), and (6) evidence for a non-genotoxic MOA. Below, we use the first five factors to organize critical mechanistic data prior to describing the updated MOA in Section 3.3 using the IPCS Framework.
3.2.1. Nature of tumors
The nature of the tumors of interest relates to the broader tumor pattern as well as specific information on the tumor type(s) of interest (Eastmond Citation2012). Mutagenic carcinogens tend to induce tumors in multiple species, multiple sexes, at multiple sites, by multiple routes, and often early in exposure (U.S. EPA Citation2007). With the exception of the hematopoietic tumors reported in the oral studies at the Ramazzini Institute (see above), formaldehyde has not been shown to be carcinogenic via multiple routes of exposure. Formaldehyde induced nasal tumors in both sexes of rats, but there was limited evidence of nasal tumors in male mice, and no nasal tumors were observed in hamsters. With regard to exposure duration, exposure to 10 ppm formaldehyde for 1 year was not carcinogenic (); however, 15 ppm formaldehyde induced nasal tumors in rats by 18 months of exposure (Swenberg et al. Citation1980; Kerns et al. Citation1983; Monticello et al. Citation1996). Taken together, the limited tumor sites, tumor lag time, and highly non-linear dose–response pattern for nasal tumors does not lend support to a mutagenic MOA. However, as will be discussed in subsequent sections, regional tissue doses of formaldehyde are highly variable, with some regions of the nasal cavity receiving much higher doses than others. Generally, those receiving higher doses exhibit the strongest carcinogenic response.
The predominant tumor type seen following inhalation exposure to formaldehyde in rats is nasal squamous cell carcinoma (SCC). Many chemical toxicants, when delivered via inhalation, result in “both non-neoplastic (e.g. inflammation, epithelial cell necrosis, epithelial hyperplasia/metaplasia) and neoplastic (e.g. squamous cell carcinoma) changes” (Harkema et al. Citation2006; Renne et al. Citation2009; Woutersen et al. Citation2010). Nasal SCC are characterized by destruction of the basement membrane, cellular atypia, mitoses, and varying degrees of invasive growth (Renne et al. Citation2009). Most of the rats in the Kerns et al. (Citation1983) bioassay exhibited a single nasal tumor, with over 50% of the tumors arising in the proximal regions of the nasal cavity with the remaining tumors showing a gradient diminishing in the more distal regions of the nasal cavity (Morgan et al. Citation1986). As discussed above, formaldehyde exposure also causes cytotoxicity and regenerative cell proliferation. These events are highly correlative with and believed to be required for the development of tumors after exposure to many substances, including formaldehyde (Feron et al. Citation2001).
3.2.2. Mutation Spectrum
Some cancer bioassays attempt to measure the mutation frequency of certain oncogenes in tumors that are determined to be treatment related (NTP Citation2013, Citation2014). This was not common at the time the formaldehyde cancer bioassays were conducted; however, tumor samples from F344 rats exposed to ≥10 ppm formaldehyde for 2 years were subsequently examined and reported to have p53 point mutations (Recio et al. Citation1992). Specifically, 5 of 11 sampled tumors had point mutations in codons within the coding region of p53 that have been shown to occur in various human tumors. Given that these mutations were observed in tumors from rats exposed to formaldehyde for two years, it is unclear whether these mutations were early drivers in the carcinogenic process or occurred later in the tumor development. However, as will be discussed later, no increase in p53 mutations in nasal tissues was observed after exposure up to 15 ppm formaldehyde for 13-weeks (Meng et al. Citation2010). Due to the rarity of spontaneous nasal tumors in rodents, Recio et al. (Citation1992) were unable to examine the mutation spectrum in tumors from unexposed rats. Such information might inform whether the mutations were likely due to the promotion of common preexisting mutations. As will be discussed in Section 3.2.5.2.1, the NTP recently conducted a study in p53 haploinsufficient mice and found no evidence of susceptibility to nasal tumor formation (Morgan et al. Citation2017).
3.2.3. Chemical properties
Formaldehyde is a small, water soluble, reactive aldehyde. Without any exogenous exposure, formaldehyde can be detected in blood and tissues at concentrations of ∼100 µM (Heck et al. Citation1985; Casanova et al. Citation1988). Sources of endogenous formaldehyde include N-, O-, and S-demethylation reactions, the one-carbon pool (or 1 C cycle), and DNA demethylation reactions (Heck and Casanova Citation2004; Walport et al. Citation2016). Natural exogenous sources of formaldehyde include foods, where both formaldehyde and methanol (which is metabolized to formaldehyde) are naturally present (IARC Citation2006). Formaldehyde (CH2O) reacts with water to form a product variably referred to as formaldehyde hydrate, formaldehyde acetal, methylene glycol, or methane diol. Formaldehyde also reacts with thiols (e.g. GSH, protein) and amines (amino acids and DNA bases). These reactions likely play an important role in the toxicity of formaldehyde. Notably, researchers have capitalized on the reactivity of formaldehyde (and reversibly bound formaldehyde) to generate stable moieties amenable to analytical detection (see below).
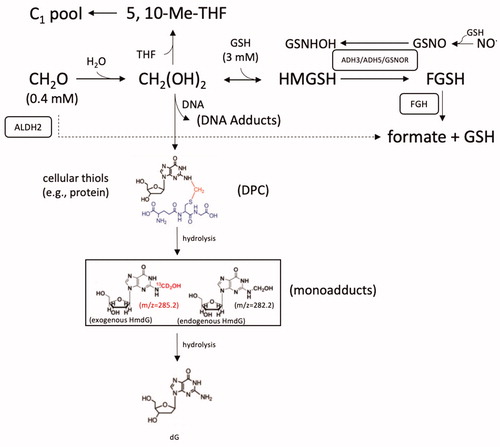
One likely contributor to the naturally occurring levels of formaldehyde present in blood and tissue is the 1 C cycle. Cleavage of serine to glycine by serine hydroxymethyltransferases liberates formaldehyde, which subsequently binds to tetrahydrofolate (THF) to form 5,10-methylene-THF (Tibbetts and Appling Citation2010; Burgos-Barragan et al. Citation2017). This latter metabolite then serves as a carbon source for methylation reactions or can be incorporated into amino acids, nucleotides, and other biomolecules that, in turn, are incorporated into macromolecular structures such as proteins and DNA (). Under certain circumstances, 5,10-methylene-THF can release formaldehyde (Burgos-Barragan et al. Citation2017).
Figure 4. Diagram of formaldehyde metabolism and select adduct formation. See text for various acronyms. Cofactors such oxidized and reduced nicotinamide adenine dinucleotide (NAD+ and NADH) are not shown for simplicity. Formaldehyde is shown crosslinking deoxyguanine (dG) and the cysteine in the tripeptide GSH as an example of relatively stable -N-Me-S- formaldehyde linkages that form between DNA and proteins (DPC). Such DPC have been shown to undergo hydrolysis to HmdG. Examples of mass differences between exogenous (m/z = 285.2) and endogenous (m/z = 282.2) HmdG (in box), which can also undergo hydrolysis back to dG. The mM levels of formaldehyde and GSH are from Andersen et al. (Citation2010).
3.2.4. Toxicokinetics
3.2.4.1. Metabolism
Enzymatic detoxification of formaldehydeFootnote3 is mediated mainly by two pathways (). One pathway involves glutathione-dependent formaldehyde dehydrogenase, which is called class-III alcohol dehydrogenase (ADH3) in rodents and ADH5 in humans (Koivusalo et al. Citation1989). In this pathway, formaldehyde reacts with GSH to form hydroxymethyl glutathione (HMGSH) that is reduced by ADH3/5 to S-formylglutathione (FGSH), and this product is then hydrolyzed by S-formylglutathione hydrolase (FGH) to formate along with regeneration of GSH (Uotila and Koivusalo Citation1974). Notably, the endogenous levels of GSH in nasal tissue are approximately 7-fold higher than endogenous formaldehyde levels (2.8 vs. 0.4 mM) (Heck et al. Citation1982; Casanova-Schmitz, David, et al. Citation1984).
ADH3/5 has additional functions, including the catabolism of S-nitrosoglutathione (GSNO) and is therefore known in other literature as GSNO reductase (GSNOR) (Jensen et al. Citation1998; Liu et al. Citation2001). This function plays an important role in nitric oxide (NO) signaling and nitrosothiol regulation in cells (Hess et al. Citation2005; Foster et al. Citation2009). This dual functionality can lead to confusion since many studies that experimentally manipulate ADH3/ADH5/GSNOR interpret their findings depending on whether their experimental interest is in formaldehyde toxicity or NO-related signaling—often with little consideration of the other pathway/function. ADH3/5 is evolutionarily conserved, expressed in most tissues, and is present in the cytoplasm and nucleus (Keller et al. Citation1990; Danielsson and Jornvall Citation1992; Iborra et al. Citation1992; Estonius et al. Citation1996; Fernandez et al. Citation2003; Thompson et al. Citation2009). Officially, this protein is now called GSNOR or ADH5, with the gene name ADH5 (Barnett and Buxton Citation2017).
The second enzymatic pathway involves the metabolism of free formaldehyde by aldehyde dehydrogenase-2 (ALDH2); however, this pathway may only be relevant under higher exposure conditions due to the overall low affinity of ALDH2 for formaldehyde (Staab, Hellgren, et al. Citation2008; Teng et al. Citation2001). As noted in the previous section, non-enzymatic reactions of free formaldehyde acetal occurs via reversible binding with cellular macromolecules such as proteins and DNA; entry into the 1 C cycle leads to irreversible incorporation into macromolecules (Burgos-Barragan et al. Citation2017).
Based on measured formaldehyde concentrations, it is estimated that mammals produce between 0.61 and 0.91 mg of formaldehyde per kilogram bodyweight per minute (EFSA Citation2014). Assuming an average of 0.76 mg/kg bodyweight formaldehyde production per minute, a 250 g rat produces over 1000 mg/kg-dayFootnote4 or 274 mg/day. Based on nasal tissue volume estimates of ∼200 mm3 (equating to ∼200 mg)Footnote5 (Gross et al. Citation1982), the nasal compartment would contribute ∼0.08% to this total formaldehyde production, or ∼0.22 mg of formaldehyde per day (274 mg/day × 0.08%). Assuming 100% deposition of formaldehyde into the nasal tissue region, the inhalation concentrations used in formaldehyde cancer bioassays result in estimated tissue doses that exceed endogenous levels (i.e. 0.22 mg) starting somewhere between 2 and 6 ppm ().
Table 2. Estimated nasal tissue dose in rats.
Consistent with this exceedance between 2 and 6 ppm, Andersen et al. (Citation2010) developed a pharmacokinetic model linking inhaled formaldehyde exposures (input) to loss through exhalation, diffusion, reversible GSH binding and metabolism to formate, as well as crosslinking based on earlier data on 14C-DNA-protein crosslinks (discussed in the following section). Andersen et al. (Citation2010) model predictions indicated that exposure to ≤2 ppm would result in minimal changes in GSH and formaldehyde acetal formation, whereas exposures above 4 ppm depletes GSH more rapidly with concomitant increases in formaldehyde acetal formation.
3.2.4.2. Biomarkers of exposure
The reactivity and rapid metabolism of formaldehyde all but preclude systemic distribution of inhaled formaldehyde. To date, studies that have attempted to detect systemic distribution of formaldehyde have all failed to detect increases in blood levels of formaldehyde following inhalation exposure. Early studies reported no detectible increases in blood formaldehyde levels in humans exposed to 1.9 ppm for 40 min, monkeys exposed to 6 ppm for 6 h/day for four weeks, or rats exposed to 14 ppm for two hours (Heck et al. Citation1985; Casanova et al. Citation1988). More recently, rats exposed to 10 ppm [13C]-formaldehyde for 6 h did not exhibit significant increases in blood formaldehyde or stabilized methanediol during or after exposure using HPLC-MS/MS (Kleinnijenhuis et al. Citation2013). Furthermore, studies with labeled formaldehyde (see below) are unable to detect labeled formaldehyde adducts with DNA or protein in blood lymphocytes, bone marrow, or other tissues beyond the site of contact. Taken together, the available pharmacokinetic data provide no evidence for the delivery of inhaled formaldehyde beyond the portal of entry. These findings are broadly consistent with a lack of systemic toxicity following inhalation exposure.
The reactivity of formaldehyde with proteins and DNA as well as in vitro evidence of genotoxicity (see Section 3.2.5.1) indicate a potential for inhaled formaldehyde to cause nasal tumors through genotoxic mechanisms. summarizes decades of research investigating the concentrations of inhaled formaldehyde that result in DNA-protein crosslinks (DPC) in nasal tissue. Over the years, there has been an evolution in both the exposure technology and the analytical methods used to detect adducts arising from exposure to exogenous formaldehyde. Early studies detected DPC by extraction of interfacial DNA comprised of DPC (Casanova-Schmitz and Heck Citation1983; Casanova-Schmitz, Starr, et al. Citation1984), and later by high-performance liquid chromatography (HPLC) technologies (Casanova et al. Citation1989, Citation1991, Citation1994). By 2010, dual stable isotope [13CD2]-formaldehyde exposure and HPLC-MS technologies were capable of tracing exogenous formaldehyde in various tissues and were capable of distinguishing endogenous formaldehyde adducts from exogenous heavy isotope adducts.
Figure 5. Summary of formaldehyde-DNA and formaldehyde-protein adducts following inhalation exposure to formaldehyde. Studies show the progression of exposure technology from unlabeled-formaldehyde to dual heavy isotope [13CD2]-formaldehyde, and progression of analytical technology from liquid scintillation counting (LSC) to HPLC technologies, mass spectrometry technologies and most recently to nano-LC-MS/MS methods following inhalation exposure to formaldehyde. Note: Casanova & Heck (Citation1987) exposed rats after pretreatment with corn oil (+GSH) or the GSH inhibitor phorone (−GSH). Open symbols represent doses where DPC or related adducts were not observed at experimental concentrations. Triangles represent non-human primates (all other data are in rats). Dotted line represents 0.3 ppm.
![Figure 5. Summary of formaldehyde-DNA and formaldehyde-protein adducts following inhalation exposure to formaldehyde. Studies show the progression of exposure technology from unlabeled-formaldehyde to dual heavy isotope [13CD2]-formaldehyde, and progression of analytical technology from liquid scintillation counting (LSC) to HPLC technologies, mass spectrometry technologies and most recently to nano-LC-MS/MS methods following inhalation exposure to formaldehyde. Note: Casanova & Heck (Citation1987) exposed rats after pretreatment with corn oil (+GSH) or the GSH inhibitor phorone (−GSH). Open symbols represent doses where DPC or related adducts were not observed at experimental concentrations. Triangles represent non-human primates (all other data are in rats). Dotted line represents 0.3 ppm.](/cms/asset/94599aea-11a8-4aeb-92c9-bd49fdf1bd1a/itxc_a_1854679_f0005_b.jpg)
Casanova-Schmitz and Heck (Citation1983) exposed F344 rats to 2, 6, 15, and 30 ppm unlabeled formaldehyde for 6 h on two consecutive days and then harvested respiratory mucosa from the nasoturbinates, maxilloturbinates, lateral walls, and median septum, as well as olfactory mucosa (see and ). With the exception of the olfactory mucosa, these regions were combined for DPC analysis. DPC was measured following phenol-chloroform extraction, where DNA and lipid material segregate into supernatant and pellet fractions, respectively—leaving proteins in the interfacial layer between the aqueous and pellet phases. It was demonstrated that DNA isolated from the interfacial layer following protein hydrolysis with proteinase K were involved in covalent DPC formation. Increases in DNA were recovered in the interfacial layer isolated from the respiratory mucosa of rats exposed to all exposure concentrations, albeit only significantly at ≥6 ppm formaldehyde; there was no apparent increase in the olfactory mucosa.
Casanova-Schmitz and colleagues subsequently exposed rats to 0.3, 2, 6, 10, or 15 ppm formaldehyde in a mixture of [14C]-formaldehyde and [3H]-formaldehyde for 6 h one day after exposure to the same concentration of unlabeled formaldehyde, which was done to initiate cell turnover (Casanova-Schmitz, Starr, et al. Citation1984). Again, DNA was isolated from respiratory mucosa from the nasoturbinates, maxilloturbinates, lateral walls, and median septum, as well as olfactory mucosa and bone marrow by phenol-chloroform extraction and quantified by liquid scintillation counting. Covalent binding of labeled formaldehyde to DNA was observed at ≥2 ppm, with evidence for significant nonlinearities occurring between 2 and 6 ppm (Casanova-Schmitz, Starr, et al. Citation1984).
The aforementioned studies were not able to detect significant elevations in DPC below 2 ppm. However, such adducts were subsequently detected at 0.9 ppm in rats depleted of GSH by phorone injection prior to inhalation exposure to 0.9, 2, 4, 6, or 10 ppm [14C]-formaldehyde and [3H]-formaldehyde for 3 h one day after exposure to similar concentrations of unlabeled formaldehyde (Casanova and Heck Citation1987). These data provide evidence that inhibition of formaldehyde metabolism (or by extension saturation of formaldehyde metabolism) can lead to increased free formaldehyde and increased adduction to cellular molecules.
As analytical techniques transitioned to HPLC-LSC, exogenous adducts could be more readily detected at lower exposure concentrations. Casanova et al. (Citation1989) exposed F344 rats to 0.3, 0.7, 2, 6, or 10 ppm [14C]-formaldehyde for 6 h. DNA was isolated from respiratory mucosa via phenol-chloroform extraction and protein digestion with proteinase K and labeled DNA measured by HPLC and scintillation counting. Adducts were detected at all concentrations; however, the dose response was highly nonlinear with the slope at 10 ppm being 7-fold higher than at 0.3 ppm (Casanova et al. Citation1989).
Casanova et al. (Citation1994) subsequently measured DPC in longer-term 12-week studies in F344 rats. Specifically, F344 rats were exposed to 0.7, 2, 6, or 15 ppm formaldehyde 6 h per day in chambers for 11 weeks and four days followed by 3 h of nose-only exposure to [14C]-formaldehyde on the fifth day of week 12. In addition to these “pre-exposed” rats, a set of unexposed “naïve” rats received acute 3-h exposure to [14C]-formaldehyde on the same day. Another set of rats was exposed to 6 and 10 ppm as described above; however, unlabeled formaldehyde was used on the final day of exposure. These rats were used to assess the potential for DPC accumulation, whereas the rats exposed to [14C]-formaldehyde were used to compare acute DPC formation in naïve and pre-exposed rats. Similar to previous experiments, the lateral meatus (high tumor region) and the medial and posterior meatuses (low tumor regions) were collected for DPC analysis in rats exposed to [14C]-formaldehyde. DPC was measured as described above (Casanova et al. Citation1989, Citation1991). Exposure to 0.7 and 2 ppm had no discernable effects on histopathology of the transitional and respiratory epithelium. At 6 ppm, squamous metaplasia and hyperplasia were evident in the lateral meatus, whereas these lesions were also evident in the medial meatuses at 10 and 15 ppm. Additional lesions at 15 ppm included epithelial erosion, inflammatory cells, and keratinizing epithelial plaques. DPC yields were ∼6-fold higher in the lateral meatus than the medial and posterior meatuses at all exposure concentrations. DPC levels were lower in pre-exposed rats than naïve rats. One potential explanation for this reduction is dilution by increased cellularity, as evidenced by metaplasia and hyperplasia in the lateral meatus as well as ∼60% increases in the tissue weight of epithelial samples collected for DNA extraction. Cumulative DPC were measured as described above (Casanova-Schmitz and Heck Citation1983; Casanova-Schmitz, Starr, et al. Citation1984) and compared between naïve and pre-exposed rats. DPC were lower in pre-exposed rats, which Casanova et al. interpreted as evidence against DPC accumulation.
The aforementioned DPC work did not identify specific DPC moieties. The next evolution in formaldehyde adduct investigation came in 2010 when Swenberg and colleagues showed that sensitive liquid chromatography/mass spectrometry (LC-MS) could be used to distinguish specific endogenous and exogenous DNA adducts in rat nasal tissue following inhalation exposure to various concentrations of [13CD2]-formaldehyde. In the first of a series of studies, F344 rats were exposed to 10 ppm [13CD2]-formaldehyde for 6 h per day for 1 or 5 days and nasal tissue, spleen, thymus, lung, liver, and bone marrow collected for analysis (Lu, Collins, et al. Citation2010). Nasal samples were comprised of “respiratory epithelium from the right and left sides of the nose and from the septum” (see the blue shaded region of the sagittal section of the rat head in ). Lu and colleagues found that exposure to formaldehyde increased exogenous N2-hydroxymethyldeoxyguanosine (HmdG) adducts (square in ) but not other adducts such as N6-hydroxymethyldeoxyadenosine (HmdA). In contrast, endogenous HmdG and HmdA adducts were observed in all tissues and generally unaltered by exposure. These data suggest that exogenous formaldehyde exposure preferentially results in lesions at guanine residues.
The dose-response for exogenous adduct formation was subsequently demonstrated in rats exposed to 0.7, 2, 6, 9, and 15 ppm [13CD2]-formaldehyde for 6 h. The black circles in indicate the dose-response for exogenous HmdG formation in nasal tissue, with an apparent inflection between 10 and 15 ppm. Also shown in are HmdG levels after exposure to 2 ppm [13CD2]-formaldehyde for 6 h per day for 7, 14, 21, and 28 days (Yu, Lai, et al. Citation2015). These data indicate an ∼2.5-fold increase/accumulation in exogenous HmdG at day 28 relative to day 7 (discussed further in Section 3.2.5.3).
Figure 6. Measures of endogenous and exogenous DNA adducts. (A) HmdG in nasal tissue of rats exposed to various concentrations of formaldehyde [13CD2]-formaldehyde. Filled black circles indicate HmdG levels after 6 h exposure to 0.7, 2, 6, 10, and 15 ppm [13CD2]-formaldehyde. Red triangles represent exogenous HmdG levels after 28 days of exposure. All other symbols represent HmdG levels after exposure to 2 ppm [13CD2]-formaldehyde for indicated lengths of time. The dotted line indicates the ±1 s.d. range on of endogenous HmdG levels reported in Lu et al. (Citation2010); other data taken from Lu et al. (Citation2011), Yu et al. (Citation2015), and Leng et al. (Citation2019). Exogenous adducts were not detected (ND) at ≤0.3 ppm therefore the adducts levels were set to the limit of detection (LOD). The dotted line indicates the ±1 s.d. range on endogenous adducts. (B) Linear scale plot of the 6 h data (black circles) and 28-day low dose data (red diamonds). The two linear segments in the main plot are the result of segmental linear regression in Prism, which is used here to accentuate the applied concentrations that result in a change in slope (other nonlinear models are not explored here). The inset shows the ratio of exogenous HmdG to endogenous HmdG, with the dashed line indicating unity.
![Figure 6. Measures of endogenous and exogenous DNA adducts. (A) HmdG in nasal tissue of rats exposed to various concentrations of formaldehyde [13CD2]-formaldehyde. Filled black circles indicate HmdG levels after 6 h exposure to 0.7, 2, 6, 10, and 15 ppm [13CD2]-formaldehyde. Red triangles represent exogenous HmdG levels after 28 days of exposure. All other symbols represent HmdG levels after exposure to 2 ppm [13CD2]-formaldehyde for indicated lengths of time. The dotted line indicates the ±1 s.d. range on of endogenous HmdG levels reported in Lu et al. (Citation2010); other data taken from Lu et al. (Citation2011), Yu et al. (Citation2015), and Leng et al. (Citation2019). Exogenous adducts were not detected (ND) at ≤0.3 ppm therefore the adducts levels were set to the limit of detection (LOD). The dotted line indicates the ±1 s.d. range on endogenous adducts. (B) Linear scale plot of the 6 h data (black circles) and 28-day low dose data (red diamonds). The two linear segments in the main plot are the result of segmental linear regression in Prism, which is used here to accentuate the applied concentrations that result in a change in slope (other nonlinear models are not explored here). The inset shows the ratio of exogenous HmdG to endogenous HmdG, with the dashed line indicating unity.](/cms/asset/c7764df0-c78b-4235-a377-a14217f381da/itxc_a_1854679_f0006_c.jpg)
The most recent study examining exogenous adduct formation following formaldehyde exposure employed more sensitive nano-LC-MS/MS techniques to measure endogenous and exogenous HmdG in rats following exposure to 0.001, 0.03, and 0.3 ppm [13CD2]-formaldehyde for 28 days (Leng et al. Citation2019). These results are shown in the lower end of the dose-response curve in . No exogenous HmdG were detected at ≤0.3 ppm, and are therefore shown based on the limit of detection. These data provide the first direct evidence of a potential dosimetric threshold in delivery of inhaled formaldehyde to the rat nasal mucosa. shows unconstrained segmental linear regression of exogenous HmdG; the slope of the first segment predicts that exposure to 0.3 ppm formaldehyde would yield ∼0.06 HmdG adducts per 107 dG, which is ∼30-fold above the limit of detection for the nano-LC-MS/MS (i.e. 0.002 adducts/107 dG). The lack of detection at and below 0.3 ppm is consistent with the existence of clearance mechanisms as well as intuitions from earlier researchers about the potential for limits to formaldehyde deposition in the rat nose. For example, Casanova et al. (Citation1989) stated that their DPC data “do not exclude the possibility that at sufficiently low concentrations (<0.1 ppm), all of the inhaled [formaldehyde] is trapped in the mucous layer, and none is absorbed into the cell”. At higher formaldehyde exposures, these newer methods are consistent with earlier work indicating nonlinearities in adduct formation beginning ≥6 ppm, as evidenced in by the slope between 10 and 15 ppm being ∼10-fold greater than the slope up to 10 ppm.
As with DNA, labeled formaldehyde can be used to trace formaldehyde-protein adducts following inhalation exposure. Formaldehyde readily reacts with lysines in proteins to form N6-formyllysine and therefore endogenous and exogenous formyllysine can be distinguished when using [13CD2]-formaldehyde. Using LC-MS/MS, exogenous formyllysine adducts were detected in nasal epithelium samples taken from rats exposed to 0.7–9 ppm [13CD2]-formaldehyde for 6 h, whereas exogenous formyllysine adducts were not detected in lung, liver, or bone marrow (Edrissi et al. Citation2013). When proteins were separated by compartment (e.g. cytoplasmic, nuclear, membrane), exogenous formyllysine adducts were lower in nuclear protein than in other regions.
As shown in , adduct data have also been collected in monkeys exposed to formaldehyde. Casanova et al. (Citation1991) exposed rhesus monkeys to 0.7, 2, or 6 ppm [14C]-formaldehyde for 6 h and collected nasal tissue from the middle turbinates, anterior lateral walls, septum, nasopharynx, maxillary sinuses, larynx-trachea-carina, intrapulmonary airways, and lung. DPC were quantified as described above (Casanova et al. Citation1989). DPC were highest in the middle turbinates, followed by lateral walls and septum, and finally the nasopharynx. No DPC were detected in the maxillary sinus or lung. The areas of greatest DPC formation were consistent with areas of lesions reported in 6 months exposure studies in monkeys (Monticello et al. Citation1989). Moeller et al. (Citation2011) exposed cynomolgus macaque monkeys to 2 or 6 ppm [13CD2]-formaldehyde for 6 h on two consecutive days and detected exogenous HmdG in maxilloturbinates but not in bone marrow. Overall, these adduct studies in monkeys exhibit parallels to rats, i.e. similar adducts form in nasal tissue at sites where formaldehyde inhalation causes tissue lesions.
3.2.4.3. Formaldehyde dosimetry models
Three-dimensional modeling of formaldehyde gas flow through rodent nasal passages began in the early 1990s with water-dye systems and acrylic molds (Morgan et al. Citation1991). These methods gave way to computer-based computation fluid dynamic (CFD) models of nasal passages constructed from measurements made in serial sections of rodent nasal passages (Kimbell et al. Citation1993; Kimbell, Godo, et al. Citation1997). For example, Kimbell et al. (Citation1993) used twenty-five 50µm step sections through the anterior 16 mm of the rat nose to construct a model of the nasal passage by tracing the perimeter of the right nasal airway on a digitizing tablet thereby generating x and y coordinates for each 50 µm section. Computer software was then used to generate 2-dimensional grids of sections that were subsequently used to generate a 3-dimensional “wire-frame” of the nasal passages. Simulated airflow in the physiological range of F344 rats (126–556 ml/min) was used to quantify nasal airflow (cm/sec) through various regions of the nasal passage. Simulations of inhalation of gaseous formaldehyde and air-phase transport to airway walls were carried out; notably, the airway walls were considered sinks—meaning that formaldehyde reaching the walls was readily absorbed. Critically, anterior airway walls receiving the highest simulated formaldehyde dose (or flux; ppmol/mm2-h-ppm at a given inspiratory flow rate) correlated well with regions of tumor formation. indicates that the highest flux estimates occur in the lateral meatus where the majority of nasal lesions occur (squamous metaplasia, cell proliferation, DPC, and tumors) (). This CFD model was expanded to include, among other changes, mapping of locations of normal squamous epithelium along the airway walls (Kimbell, Gross, et al. Citation1997). Simulations of formaldehyde inhalation were carried out again, this time correlating flux at airway walls at 10 and 15 ppm to regions of formaldehyde-induced squamous metaplasiaFootnote6. The CFD model was subsequently expanded to include 596 50-µm step sections through the entire nasal cavity of rats (Kimbell, Godo, et al. Citation1997).
A CFD model of monkey nasal airways was constructed from coronal sections in a manner similar to that described above (Kepler et al. Citation1998), and a human CFD model was constructed from MRI scans of human noses (Subramaniam et al. Citation1998). These CFD models were subsequently used to estimate formaldehyde dosimetry in monkeys and humans to aide in interspecies extrapolation as well as inform MOA (Kimbell et al. Citation2001). For example, Kimbell and colleagues reported that formaldehyde flux predictions at locations previously demonstrated to exhibit increased cell proliferation in rats and monkeys following formaldehyde exposure were within four-fold of one another (note: these results were achieved using minute volume values twice the resting minute volume for each species). Kimbell et al. also noted that some regions of the human nasal passages were estimated to experience similar flux (pmol/(mm2-h-ppm)) values to those estimated in the rat anterior lateral meatus. These findings suggest the potential for certain regions in the human nasal passage to receive internal doses of formaldehyde that are carcinogenic to rats under long-term exposure scenarios. This issue is discussed further in Section 3.6.
More recently, CFD models for rats and monkeys were updated using newer medical imaging software, and the human model was replaced with computed tomography scans from an adult woman thereby increasing the fidelity of the CFD models (Schroeter et al. Citation2014). Uptake into nasal passage walls was modeled with a three-tier epithelial model consisting of a mucous layer, epithelial layer and submucosal layer; endogenous formaldehyde levels were included based on empirical data in order to assess the impact of endogenous levels on formaldehyde uptake. At exposure >500 ppb, endogenous formaldehyde levels did not affect model uptake predictions, whereas exposures below 500 ppb decrease net uptake. In humans, exposures below 1 ppb were estimated to result in net desorption of formaldehyde. Similar to Kimbell et al. (Citation2001), regions of highest flux in rats and monkeys correlated with regions of high cell proliferation and DPC formation described in previous sections. The utility of these dosimetry models for understanding MOA and risk implications are discussed in later sections.
3.2.5. Genotoxicity
Another factor Eastmond (Citation2012) identified as important for regulatory decisions is evidence of in vivo genotoxicity, particularly within the target tissues of carcinogenic interest. In reviewing formaldehyde articles published over the last several decades, formaldehyde and/or DPC have been inconsistently referred to as either weakly or strongly mutagenic, often with little or no evidence or context provided. For example, Lai et al. (Citation2016) state that “formaldehyde-induced DPCs have long been recognized as a highly mutagenic form of DNA damage (emphasis added), whereas a report from a Consensus Workshop on Formaldehyde characterized formaldehyde as “weakly mutagenic in human cells in culture as well as other mammalian cells, Drosphhila, fungi and bacteria” (emphasis added) (CWF Citation1984). Clearly, there is a need to better understand the genotoxic potential of formaldehyde in vivo, particularly in the nasal cavity.
Before we evaluate the in vivo genotoxicity data for formaldehyde, the following section briefly describes the in vitro genotoxicity of formaldehyde so as to inform the types of genotoxicity one might expect to observe in vivo. In this article, we classify genotoxicity broadly into three categories: clastogenicity, aneugenicity, and mutagenicity. Clastogenicity is defined as large DNA breaks (also called chromosomal mutations) empirically observable as chromosomal aberrations or micronuclei that primarily arise through the direct interaction of an agent with DNA. Aneugenicity is empirically similar to clastogenicity, but primarily the result of toxicity to proteins (e.g. spindle poisons). Mutagenicity is defined as small gene mutations (e.g. point mutations) that arise through direct interaction of an agent with DNA.
With regard to mutagenicity in the context of environmental risk assessment, it is generally argued that DNA reactivity is nearly synonymous with mutagenicity and carcinogenic potential (Preston and Williams Citation2005). However, Preston and Williams specifically refer to “target cells,” which they define not as tissue target location but rather stem cells within target tissues. In the small intestine, for example, there are a small number of stem cells per intestinal crypt that give rise to a large number of progeny forming the intestinal mucosa; moreover, these stem cells appear to be well protected from the luminal contents (Brooks et al. Citation1999; Thompson, Seiter, et al. Citation2015). Furthermore, some intestinal carcinogens that are both genotoxic in vitro and cytotoxic in vivo are negative in in-vivo genotoxicity assays (Chidiac and Goldberg Citation1987; O’Brien et al. Citation2013; Thompson, Wolf, et al. Citation2015; Thompson et al. Citation2017; Aoki et al. Citation2019). Even in simplistic in vitro models, there is growing evidence that some DNA reactive agents increase DNA lesions linearly but increase mutations sublinearly (or exhibit hockey stick shape) (Pottenger et al. Citation2019). The following section briefly describes in vitro evidence of formaldehyde genotoxicity, followed by sections indicating a lack of genotoxicity in vivo.
3.2.5.1. In vitro genotoxicity
Formaldehyde is unequivocally genotoxic via several measures (Albertini and Kaden Citation2017). In E. coli, formaldehyde induces point mutations, insertions and deletions (IARC Citation2006). In mammalian cells, formaldehyde increases DPCs, sister chromatid exchange, micronuclei (MN), and cytotoxicity all within a similar range of concentration with limited evidence for gene mutation or aneugenic mechanisms (Merk and Speit Citation1998; Speit, Kuhner, et al. Citation2011; Albertini and Kaden Citation2017). Formaldehyde induces positive responses in the mouse lymphoma assay; however, these are primarily the small colonies indicative of small-scale chromosomal rearrangements as opposed to point mutations (Speit and Merk Citation2002). Although formaldehyde seems to preferentially form chromosomal damage as opposed to point mutations, DPC are recognized as lesions that can lead to multiple forms of genetic damage (Stingele and Jentsch Citation2015). As such, multiple forms of in vivo genotoxicity testing are relevant to the assessment of genotoxicity of formaldehyde in target tissues.
It is important to realize that genetic toxicologists acknowledge that DPC repair is poorly understood, including only recent discovery of DPC proteases involved in formaldehyde-induced DPC repair (Stingele et al. Citation2016; Fielden et al. Citation2018). Some of these DPC proteases, such as SPRTN, are coupled to transcription (Vaz et al. Citation2016), suggesting perhaps increased repair of DPC in dividing cells compared to non-dividing cells. Relatedly, there is evidence that ADH3/5 expression is elevated in proliferating cells relative to non-proliferating cells (Hedberg et al. Citation2000). These two findings indicate that proliferating cells are susceptible to formaldehyde-induced DPC and therefore primed to express proteins that prevent/manage such lesions. As will be discussed further in Section 3.2.5.3, the linkage between formaldehyde-related DPC and genotoxicity and cancer risk is uncertain and thus it is critical to assess the in vivo genotoxic potential of formaldehyde.
3.2.5.2. In vivo genotoxicity
As described in the Methods, lists the 16 published in vivo genotoxicity studies along with their TSCA score (see Methods). The single oral genotoxicity study on formaldehyde reported significant increases in micronuclei (MN) in the gastrointestinal tract of rats administered 200 mg/kg formaldehyde by oral gavage (Migliore et al. Citation1989). Considering that chronic exposure of up to 300 mg/kg body weight formaldehyde administered in drinking water is not carcinogenic to the gastrointestinal tract, it is difficult to interpret these positive MN findings. The gavage dosing may exceed protective mechanisms that are not exceeded when exposure is to high concentrations of formaldehyde via small bouts of drinking water intake. Recall also that oral carcinogenicity studies with formaldehyde reported cytotoxicity that might explain the positive findings (see Section 3.1).
Table 3. In vivo genotoxicity studies on formaldehyde.
Although not an environmentally relevant route of exposure, several studies have examined the genotoxicity of formaldehyde following intraperitoneal (i.p.) injection. These studies report negative results for clastogenic measures such as chromosomal aberrations (CA) and MN (Fontignie-Houbrechts Citation1981; Gocke et al. Citation1981; Natarajan et al. Citation1983). This non-physiological exposure route would potentially increase formaldehyde exposure to cells of systemic organs such as bone marrow, spleen, and testes. However, the negative results in these studies might potentially be explained by hepatic portal clearance, enzymatic detoxification, and non-enzymatic clearance (e.g., protein binding) prior to reaching systemic target tissues where genotoxicity is assessed.
More relevant to the MOA discussions for nasal tumors are the studies that have measured genotoxicity following inhalation exposure to formaldehyde (). Rats exposed to up to 15 ppm formaldehyde for 6 h/day for five days to four weeks did not exhibit increases in clastogenic markers in peripheral blood cells such as sister chromatic exchange (SCE), CA, or MN (Kligerman et al. Citation1984; Speit et al. Citation2009). Similarly, inhalation exposure of rats to up to 15 ppm formaldehyde for 8 weeks did not increase CA in bone marrow cells (Dallas et al. Citation1992). In the same study, Dallas et al. reported that CA were significantly elevated in pulmonary macrophages of rats exposed to 15 ppm for 1 week and for 8 weeks, whereas significant increases were not observed at 0.5 and 3 ppm. A more recent study examining genotoxicity in lung cells collected by broncho-alveolar lavage did not observe clastogenic damage in rats following exposures up to 15 ppm formaldehyde for 6 h/day for four weeks (Neuss et al. Citation2010). Regarding the opposing finding in lung cells from Dallas et al. (Citation1992) and Neuss et al. (Citation2010), the latter study also performed a Comet assay. Consistent with the lack of MN induction, no significant differences in tail moment (i.e. DNA damage or DPC) were observed. Neuss et al. (Citation2010) also point out that in vitro data indicate that MN should be more prevalent than CA following formaldehyde exposure, suggesting that MN should be a more sensitive endpoint than CA. Furthermore, Neuss et al. argue that MN formation is well accepted to be easier to identify and far less subjective than CA scoring. The disparate clastogenicity results from Neuss et al. (Citation2010) and Dallas et al. (Citation1992) can also be mediated with dosimetry data discussed previously. Specifically, labeled (i.e. exogenous) DNA-formaldehyde adducts can be detected in the nasal tissue but not the lung of rats exposed to 10 and 15 ppm [13CD2]-formaldehyde (Lu, Collins, et al. Citation2010). As such, the weight of evidence supports the negative clastogenic results described by Neuss et al. (Citation2010).
ICR mice exposed to 0.82 and 8.2 ppm formaldehyde (1 or 10 mg/m3) for 2 h per day for 20 weeks did not exhibit significant increases in bone marrow MN (Liu et al. Citation2017), whereas ICR mice exposed to 16, 33, or 65 ppm (i.e. 20, 40, or 80 mg/m3) for 2 h per day for 15 days exhibited significant increases in bone marrow MN (Yu et al. Citation2014). Although not investigated in the study, the 50% respiratory rate decrease (RD50) for mice is ∼4 ppm (Chang et al. Citation1981), and thus exposure to ≥16 ppm formaldehyde likely induced reflex bradypnea. Reflex bradypnea can result in hypothermia in small mammals (Pauluhn Citation2003; Gordon et al. Citation2008) and the latter is a known confounder for MN assays (Asanami et al. Citation1998, Citation2001; Tweats et al. Citation2007). Yu et al. published another study where mice were exposed to 16, 33, or 65 ppm for 2 h per day for 15 days (Yu, Song, et al. Citation2015). DNA damage via Comet assay was scored by five categories of severity; however, scoring criteria were not described. Yu, Song, et al. (Citation2015) reported significant increases in bone marrow DNA damage in mice exposed to ≥33 ppm formaldehyde. Importantly, the studies by Yu and colleagues and Liu et al. (Citation2017) provided little information on the test article or exposure conditions. Given other deficiencies in reporting (e.g. source and strain of mice, analytical verification, etc.), these findings are highly uncertain. Indeed, the TSCA score for these three studies were quite low ().
Two studies have measured genotoxicity in the target tissue of interest (the nasal mucosa of rats) following repeated exposure to carcinogenic concentrations of formaldehyde, i.e. ≥6 ppm (). Importantly, these assays cover a broad spectrum of genotoxicity including clastogenicity, aneugenicity, and mutagenicity. Furthermore, both studies measured cell proliferation within the target tissue via 5-bromo-2′-deoxyuridine (BrdU) labeling to confirm dosimetry by increased cell proliferation (Meng et al. Citation2010; Speit, Schutz, et al. Citation2011). The increase in cell proliferation is critical because markers of genotoxicity like MN and mutant frequency (MF) require cell division in order to be “fixed” (i.e. encoded) and empirically observed. As such, the formaldehyde concentrations used in these studies should be ideal for detecting markers of genotoxicity if present.
Speit, Schutz, et al. (Citation2011) exposed F344 rats to 0.5, 1, 2, 6, 10, and 15 ppm formaldehyde for 6 h per day 5 days/week for 28 days (). Osmotic pumps for BrdU labeling were implanted to assess cell proliferation 3 days prior to necropsy. Epithelial tissue was collected from the “nasal turbinates and septum,” washed, cryo-centrifuged onto slides and 2000 epithelial cells scored from each rat. It is unclear whether these samples included the lateral meatus; nevertheless, these regions do correspond to regions of tumor formation (). Consistent with other studies, exposure to formaldehyde significantly increased cell proliferation (ULLI) in the lateral meatus and nasoturbinates at ≥6 ppm, and maxilloturbinates at ≥10 ppm. Despite clear signs of formaldehyde reaching the rat nasal target tissue, i.e. increasing cell proliferation, no increases in MN were observed in any treatment group. There are three potential explanations for this finding. One, MN formed but were lost/exfoliated prior to tissue extraction and preparation. Given that exposures included concentrations that induced varying degrees of cell proliferation, it seems unlikely that all MN would be lost due to cell turnover. A second potential explanation is that the assay lacked sensitivity. Speit, Schutz, et al. (Citation2011) acknowledged that while they attempted to induce nasal MN by exposing rats orally to the mutagen cyclophosphamide, they were unable to detect increased MN in nasal tissue. However, it is unknown whether cyclophosphamide (which requires metabolic activation) would increase MN in nasal tissue following oral exposure. Notwithstanding the lack of a positive control, the use of (i) multiple concentrations (including carcinogenic concentrations), (ii) multiple DPC forming concentrations, (iii) multiple proliferation-inducing concentrations, and (iv) an unambiguous endpoint (i.e. MN) should have biased the study toward detection of DNA damage if it occurred. A third explanation for the lack of MN is that while formaldehyde induces DPC in cells of the portal of entry, DPC might not form in proliferating cells of the mucosa at a rate sufficient to cause clastogenic damage. Such cells may be protected from direct formaldehyde exposure by mucus and superficial cell layers, as well as the aforementioned evidence for increased activity and/or levels of SPRTN and ADH3/5 in proliferating cells. Speit and colleagues rightfully caution against overinterpreting these findings; however, the absence of MN formation was unexpected.
Meng et al. (Citation2010) exposed F344 rats to 0.7, 2, 6, 10 and 15 ppm formaldehyde 6 h/day, 5 days/wk for 13 weeks (). Meng et al. (Citation2010) used the sensitive allele-specific competitive blocker-PCR (ACB-PCR) mutation assay to look for mutations in codon 271 of p53 and codon 12 of kras. Given previous evidence that p53 mutations are prevalent (5/11) in formaldehyde-induced nasal tumor tissues, and that 1/5 tumors had a mutation in codon 271 (Recio et al. Citation1992), this is an ideal mutation to examine in a shorter-term formaldehyde study. Codon 12 of kras was examined due to its possible involvement in nasal tumors (Meng et al. Citation2010). Nasal tissue collection at LII included transition and respiratory epithelium from the lateral meatus and nasoturbinates; the maxilloturbinates and olfactory epithelium were discarded. Statistically significant increases in cell proliferation were observed in the anterior lateral meatus of rats exposed to ≥10 ppm formaldehyde. Despite clear signs of formaldehyde reaching the target tissue and increasing cell proliferation, no increase in MF of these codons were observed in any treatment group. Although this study arguably lacks the coverage provided by a transgenic rodent mutation assay (OECD Citation2013), it supports a lack of involvement of small gene mutations (e.g. point mutations) in the MOA. Taken together with the apparent absence of clastogenic damage in the target tissue, these data support a non-mutagenic MOA for formaldehyde.
Several studies report genotoxic effects in blood, buccal or nasal samples taken from workers occupationally exposed to formaldehyde (see reviews (Albertini and Kaden Citation2017; Fenech et al. Citation2016). Here, we focus on the studies that measured genotoxicity in human volunteers exposed to formaldehyde in controlled settings because there are considerably fewer confounding influences and far better dose characterizations in controlled settings. Speit et al. (Citation2007) exposed 21 subjects to formaldehyde for 10 consecutive workdays at exposures ranging from 0.15 to 0.5 ppm for 4 h/day with four 15-min peak exposures to 1 ppm. No statistically significant increases in buccal MN were observed immediately after exposure, or 7–21 days after exposure (Speit et al. Citation2007). Zeller et al. (Citation2011) exposed 41 male volunteers to formaldehyde in chambers for 4 h/day for 5 consecutive days. Exposures were either 0.3, 0.4, 0.5, or 0.7 ppm with 15-min peak exposures up to 0.8 ppm, with some peak exposures occurring while riding an exercise bike. No changes in genotoxic endpoints (SCE, MN, Comet) were observed in peripheral blood cells or nasal epithelial cells (Zeller et al. Citation2011).
3.2.5.2.1. Insights from Trp53 deficient rodent models for informing genotoxicity
Though not a genotoxicity assay per se, the U.S. National Toxicology Program (NTP) of the National Institute of Environmental Health Sciences (NIEHS) conducted a study to “evaluate the potential role of the Trp53 gene in formaldehyde-induced nasal carcinogenicity…in genetically susceptible mice” (Morgan et al. Citation2017). Two mouse strains haploinsufficient for Trp53 were exposed to 7.5 or 15 ppm formaldehyde 6 h/day for eight weeks and sacrificed 32 weeks later at ∼50 weeks of age (). These mouse strains were designed such that shortened cancer bioassays could be conducted due to their increased sensitivity to carcinogens (particularly genotoxic carcinogens) due to the loss of the p53 tumor suppressor (Eastmond et al. Citation2013). The study authors state that, “[t]he primary formaldehyde-related finding was squamous metaplasia of the respiratory epithelium of the nose…” indicating that “…formaldehyde caused significant injury to the nasal mucosa and cell proliferation…” (Morgan et al. Citation2017). These observations demonstrate that formaldehyde reached the target tissue of interest but did not induce any DNA lesions leading to neoplasia. Although mice are less sensitive to formaldehyde due to irritant induced reflex bradypnea (resulting in lower tissue dosimetry) and a longer exposure duration might have resulted in different findings in the Trp53+/− mice, this study was designed, approved, and conducted by the NIEHS. The study authors concluded that the results “do not support a role for Trp53 in formaldehyde-induced neoplasia”. More broadly, this study provides additional weight of evidence that genotoxicity is not an early initiating key event in the development of formaldehyde-induced nasal tumors in rodents (Thompson Citation2018).
3.2.5.2.2. Insights from ADH5 deficient rodent models for informing genotoxicity
Over the past two decades, several groups have developed ADH5−/− (aka ADH3−/− or GSNOR−/−) mice, primarily to investigate functions unrelated to formaldehyde. For example, GSNOR−/− mice were developed to examine the potential benefits of ablating GSNOR and elevating GSNO (an endogenous bronchodilator) in animal models of asthma (Que et al. Citation2005; Green et al. Citation2012). GSNOR−/− mice were found to exhibit an increased incidence of hepatocellular carcinoma (HCC), but not other tumors, relative to their C57BL/6 background. This increase was subsequently found to be related to decreased O6-alkylguanine-DNA-alkyltranserase (AGT) activity as a result of imbalances in S-nitrosylation due to loss of GSNOR (Wei et al. Citation2010; Tang et al. Citation2013). These researchers subsequently crossed GSNOR−/− mice with transgenic Big Blue® mice creating a new line of Big Blue® mice deficient in ADH-mediated formaldehyde metabolism (ADH5−/− Big Blue) (Leung et al. Citation2013). Big Blue® mice and rats are transgenic rodent models recognized by the OECD for conducting in vivo mutation assays (Lambert et al. Citation2005; OECD Citation2013). Leung et al. (Citation2013) reported that the background MF in the liver of ADH5−/− Big Blue mice was slightly lower (albeit not significantly) than the MF in Big Blue® mice (). These data indicate that loss of ADH5 in mice did not result in the acquisition of more spontaneous mutations during early development than ADH5 competent Big Blue® mice.
Figure 7. ADH5 null mice. (A) Mutant frequency in Big Blue® (WT) mice and ADH5/GSNOR deficient Big Blue® mice (GSNOR−/−). Adapted from Leung et al. (Citation2013). (B) Mice deficient in ADH exhibit higher levels of endogenous HmdG in multiple tissues. Adapted from Pontel et al. (Citation2015). Data were extracted from published figures with WebPlotDigitizer 4.3.
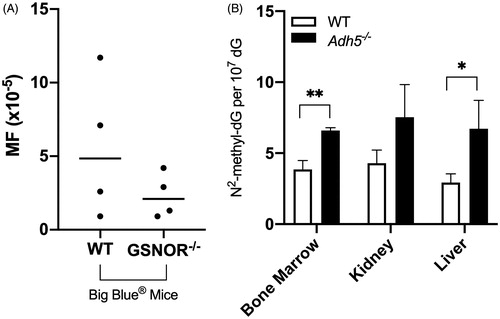
Using one of the same GSNOR−/− mouse strains described above, other researchers demonstrated that the loss of ADH5 resulted in ∼2-fold increases in endogenous HmdG levels in the liver, kidney, and bone marrow of ADH5−/− mice relative to wild type mice (Pontel et al. Citation2015) (). Pontel and colleagues also generated mice null for Fanconi anemia group D2 (Fancd2), an enzyme involved in the repair of DNA interstrand crosslinks, as well as a dual knockout Adh5−/−Fancd2−/− strain. They reported significant increases in γ-H2AX immunostaining (an indicator of DNA damage) in hematopoietic cells from Adh5−/−Fancd2−/− mice, but not Adh5−/− or Fancd2−/− mice. Similarly, in vitro mitogenic stimulation of splenic B cells with lipopolysaccharide increased CA in B cells from Adh5−/−Fancd2−/− mice, but not Adh5−/− or Fancd2−/− mice. To reiterate, induction of proliferation in ADH5 deficient B cells containing two-fold increases in endogenous HmdG did not result in increased evidence of genotoxicity. Taken together, studies in ADH5 deficient rodents indicate increases in endogenous HmdG without concomitant increases in genotoxic markers such as CA, γ-H2AX, or MF.
Most recently, it was shown that Adh5−/− mice exhibit a two-fold increase in serum formaldehyde levels, and concomitant five-fold increase in HmdG levels in liver, kidney and brain (Dingler et al. Citation2020). Despite these increases, blood MN and bone marrow SCE levels were not significantly elevated in Adh5−/− mice compared to wild type mice, nor were base pair mutations, insertions or deletions increased in the liver, brain and kidney in Adh5−/− mice compared to wild type mice. In contrast, dual loss of Adh5 and Aldh2 (see ) increased serum formaldehyde levels 11-fold, significantly increased MN and SCE, as well as increased HmdG levels ∼20-fold in liver, brain and kidney, and significantly increased base pair mutations, insertions, and deletions in those tissues. Assuming qualitative equivalency of Adh5 and Aldh2 ablation with site of contact increases in cellular formaldehyde levels following inhalation exposure, there is the potential for increased DNA damage when HmdG levels exceed endogenous levels somewhere between 5 and 20-fold. Although adducts and MF have not been examined in nasal tissue from Adh5 knockout mice, the data from other tissue is nonetheless informative about the relationship between HmdG levels and genotoxicity. Looking at the HmdG levels in nasal tissue (), it is apparent that 15 ppm formaldehyde increases HmdG ∼5-fold, which may not be sufficient to induce genetic damage, consistent with the data from Meng et al. (Citation2010) and Speit, Schutz, et al. (Citation2011).
3.2.5.2.3. Insights from transcriptomic analyses
Transcriptomic analyses are a unique endpoint that can inform toxicity, genotoxicity, changes in pharmacokinetics, as well as dosimetry. Formaldehyde exposures that do not elicit transcriptomic changes are, at the very least, indicative of tissue-level exposures that are likely too low to result in any measurable homeostatic or toxic response to applied exposure. Of course, an absence of transcriptomic responses could also indicate lack tissue exposure altogether. Formaldehyde is one of the most well studied agents via transcriptomic analyses in relevant tissues at relevant exposure concentrations, by relevant routes of exposure. In this section we briefly touch upon transcriptomic analyses in the nasal tissue of rodents exposed to formaldehyde via inhalation.
The first transcriptomic studies with formaldehyde focused on integrating transcript responses with dose-response analysis using benchmark dose (BMD) methodology in the development of the BMDExpress transcriptomic modeling tool (Thomas et al. Citation2007). Subsequent studies focused on integrating transcriptomic responses with histopathology and pharmacokinetic data (Andersen et al. Citation2008, Citation2010). Andersen et al. (Citation2008) measured transcriptomic responses in rats exposed 6 h per day to 0.7, 2, 6, and 15 ppm for 1 day, or 0.7–6 ppm for 5, 6, and 15 days. Transcript responses were measured in epithelial tissue from the nasoturbinates and lateral wall in the blue shaded region (comprising mostly LII) in the sagittal section of the rat head in , consistent with regions used to conduct dual-isotope labeling experiments described previously.
No genes were significantly altered at 0.7 ppm for any exposure duration. Given that DPC and HmdG can be detected at 0.7 ppm (see ), these results suggest that 0.7 ppm did not trigger a homeostatic or toxicologic response in the tissue. Exposure to 2 ppm formaldehyde for 5 days resulted in significant changes in only 15 genes, whereas no significant changes were detected after 15 days of exposure to 2 ppm. Andersen and colleagues speculated that the mitigation of gene changes was potentially due to adaptive squamous metaplasia that, per its function, protected the mucosa from further exposure to 2 ppm formaldehyde. In contrast, exposure to 6 ppm formaldehyde resulted in significant changes in 42, 28, 9, and 54 genes after 1, 5, 6, and 15 days of exposure. These findings suggest that upon undergoing adaptive squamous metaplasia, 6 ppm formaldehyde continued to elicit cellular effects at 15 days of exposure. However, it should be appreciated that transcript differences are potentially due, in part, to inherent differences in squamous (treated) and respiratory (untreated) epithelia as opposed to direct chemical-induced cellular changes per se. Exposure to 15 ppm (only studied for 1 day) resulted in significant alterations of 745 genes.
With regard to the specific genes altered by formaldehyde exposure, Andersen et al. (Citation2008) concluded that the 15 genes altered after 5 days of exposure to 2 ppm were mostly “associated with cell membrane, external aspect of the cell membrane, or cell architecture.” The very limited transcript response at 2 ppm and the absence of gene changes at 0.7 ppm lend support to the possibility that exposures below 0.3 ppm might indeed result in little or no exogenous HmdG formation (). Exposure to 15 ppm resulted in functional enrichment of pathways related to transcription, stress, apoptosis, and NF- kB, which Andersen et al. linked to irritant damage, inflammatory signaling, and cell proliferation.
Andersen et al. (Citation2010) conducted a 90-day inhalation study collecting histopathological data, cell proliferation data, and transcriptomic responses. Rats were exposed to 0.7, 2, 6, 10, or 15 ppm formaldehyde for 6 h per day, 5 days per week, for 1, 4, or 13 weeks. Transcript responses were measured in the blue shaded region of the sagittal section of the rat head in . The histopathological and proliferation data are discussed in subsequent sections. Here the focus is on transcriptomic responses, especially as they may relate to genotoxicity. Functional enrichment analysis was conducted on rats exposed to ≥6 ppm, whereas changes at 2 ppm were considered by Andersen et al. to represent extracellular responses and changes in thiol homeostasis (note: it is likely that the small number of gene changes at ≤2 ppm precluded enrichment analysis). At all time points, enrichment at 10 and 15 ppm related to cell cycle and DNA damage—consistent with histological evidence of necrosis at early timepoints and increased cell proliferation (ULLI) at later time points. In rats exposed to 6 ppm for 1 and 13 weeks, enrichment also indicated cell cycle and DNA damage. It should be noted that DNA damage pathways like p53 activation can also be indicative of cell cycle changes potentially related to increased proliferation. For example, ToxCast/Tox21 p53 assays were initially considered useful for mapping to genotoxic characteristics of carcinogens but subsequently not used due to overlap with cell cycle changes (Chiu et al. Citation2018). As was discussed above, mice deficient in p53 did not show increases in neoplasms following exposure to formaldehyde (Morgan et al. Citation2017).
3.2.5.3. Remaining uncertainties in formaldehyde genotoxicity
Despite the vast amount of information on formaldehyde, there remains some unanswered questions about the linkage between formaldehyde exposure, DPC formation, and genotoxicity. First, the exact mechanism of formation is uncertain. While some formaldehyde adducts (e.g. those formed from histone demethylase activity in the nucleus) are comprised of methylene bridges (protein–N–CH2–N–DNA) between DNA and protein (Stingele and Jentsch Citation2015), Lu and colleagues demonstrated that formaldehyde preferentially formed labile dG-Me-lysine (–N–CH2–N–) linkages and stable dG-Me-Cys (–N–CH2–S–) linkages in vitro and speculated that the latter would make ideal targets for measuring DPC formed in vivo (Lu, Ye, et al. Citation2010). Yu, Lai, et al. (Citation2015) subsequently showed that these adducts can hydrolyze to HmdG adducts and subsequently dG (). This is consistent with the general notion that DPC can be unstable due to hydrolysis, but also indicate that measured exogenous HmdG adducts are, at least in part, byproducts of DPC. Lai et al. (Citation2016) subsequently provided evidence that isolated DPC following formaldehyde inhalation exposure were (after digestion of peptides and DNA) comprised of single amino acid-nucleoside crosslinks of (dG-Me-Cys). Taken together, these data suggest that, depending on isolation conditions, HmdG is likely indicative of current DPC and/or past DPC formed in vivo. These may not be the only formaldehyde-induced adducts, but rather their stability allows for their detection and service as a biomarker of exposure.
Another uncertainty is the potential for DPC accumulation. Earlier studies such as Casanova et al. (Citation1994) did not detect increased DPC following 28 days of exposure relative to acute exposure, as evidenced by the absence of differences in the amount of interfacial DNA (Section 3.2.4.2). However, Yu et al. (Citation2015) demonstrated accumulation in both exogenous HmdG () and dG-Me-Cys. The reason for this discrepancy is unknown but could relate to the different analytical methods. For example, HmdG adducts are byproducts of previously formed DPC, and thus would not necessarily be present in interfacial DNA, yet appear to accumulate as monoadducts. On the other hand, unhydrolyzed exogenous dG-Me-Cys adducts would likely be present in interfacial DNA, so their apparent accumulation in Yu et al. (Citation2015) contradicts earlier data based on interfacial DNA. Differences in assay sensitivities may also explain the apparent discrepancies. The apparent increase in adducts might also be explained by changes in the epithelium. For example, Lai et al. (Citation2016) reported that exposure to 15 ppm formaldehyde for 4 days increased exogenous dG-Me-Cys >3-fold relative to 1 day, whereas 2 days of exposure did not increase exogenous dG-Me-Cy. It is conceivable that this increase in adducts is due to retention in quiescent superficial cells, as squamous metaplasia has been reported in rats exposed to 15 ppm for only 5 days (Andersen et al. Citation2008). Lai also reported 2.5-fold increases in exogenous dG-Me-Cys after 28 days of exposure relative to 7 days; however, 2 ppm formaldehyde is also reported to increase squamous metaplasia in LI after 1–13 weeks of exposure (Andersen et al. Citation2010). Whether the accumulation of adducts occurs in target cells and increase cancer risk is unknown.
Regarding cells at risk, there is uncertainty as to the exact cell population exhibiting formaldehyde-induced DPC. To our knowledge, visualization of dosimetry within intact tissue has not been demonstrated. As indicated previously, PWULLI (product of ULLI and number of cells) better correlated with tumor formation than ULLI; however, it is unclear which cells are “at risk”. For example, it was recently suggested that all basal cells in the epithelium are at risk for transformation (Miller et al. Citation2017), whereas others have reported that only ∼10% of basal cells (in skin) are stem cells (Tomasetti and Vogelstein Citation2015).
Finally, there is uncertainty with respect to the genotoxic risk that formaldehyde-induced DPC and adducts pose. This is readily acknowledged by those who have developed the assays to detect these adducts (Yu, Song, et al. Citation2015; Lai et al. Citation2016). Likewise, genetic toxicologists acknowledge that DPC repair is poorly understood, including only recent discovery of DPC proteases involved in the repair of formaldehyde-induced DPC (Stingele et al. Citation2016; Fielden et al. Citation2018). It should also be appreciated that DPC and HmdG are the DNA lesions that we can readily detect. As such, there could be other lesions not readily observed. This underscores both the importance of the apparent threshold in the detection of HmdG as a stable biomarker of exposure (Leng et al. Citation2019), and the importance of assessing multiple lines of evidence for the in vivo genotoxicity of formaldehyde as we have done throughout Section 3.2.5.2.
These uncertainties are a natural consequence of the tremendous amount of detailed mechanistic research in understanding the MOA for formaldehyde-induced nasal tumors in rats. Although some details remain to be fully understood, the question is whether there is sufficient information to make informed decisions about the likelihood of a mutagenic or non-mutagenic MOA. The balance of this review presents an update to the MOA for formaldehyde-induced tumors published 15 years ago (McGregor et al. Citation2006).
3.3. Updated mode of action
In 2006, the MOA for formaldehyde-induced nasal tumors in rodents and its human relevance was formally analyzed using the IPCS framework (McGregor et al. Citation2006). In that publication, the key events (listed in sequence) were: cytotoxicity, proliferation, genotoxicity, mutations, and nasal tumors. However, in 2006, no genotoxicity studies had been conducted in the nasal cavity of rodents and no data were available to inform the exposure levels that increased DPC above endogenous levels. and depict the updated MOA, as well as the uncertainty around the role of genotoxicity described in McGregor, et al. (Citation2006), indicated by KE2a and KE2b. The updated MOA includes one additional key event occurring prior to cytotoxicity as well as consideration of endogenous adduct levels (blue boxes in ). The black outlined boxes are generally consistent with the MOA described by McGregor et al. (Citation2006); however, data published since 2006 indicate little or no direct mutagenic contribution from formaldehyde-induced DPC (as indicated by the blue “X”). Each of these key events are discussed in detail below.
Figure 8. MOA for SCC in the rodent nasal cavity. KE1: saturation of formaldehyde metabolism results in increased free formaldehyde which increases adduction to cellular molecules (e.g. protein, DNA). KE2: increased adduction leads to irritation and cytotoxicity (KE2a) and/or DNA damage (KE2b). KE3: squamous metaplasia is an adaptive response that can be reversible if exposure ceases or decreases (e.g. ≤1 ppm for formaldehyde), can persist if the metaplasia protects against continued exposure (e.g. 2–6 ppm for formaldehyde), or can be overwhelmed if higher exposures (e.g. ≥6 ppm for formaldehyde) exceed protection afforded by squamous epithelium. KE4: continued exposure to cytotoxic concentrations (after adaptive metaplasia has occurred) leads to chronic cell proliferation. KE5: increased cell replication and potentially increased DNA damage increase mutations during replication. The blue “X” indicates that data published after McGregor et al. (Citation2006) do not support a direct contribution from formaldehyde-induced DNA lesions (see text).
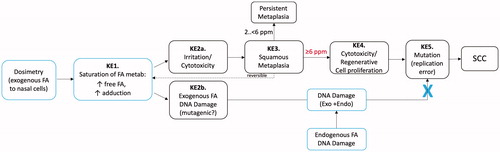
Table 4. Proposed MOA for formaldehyde-induced nasal tumors.
3.3.1. Dosimetry of exogenous formaldehyde to nasal epithelial cells
The issue of whether dosimetry should be considered a key event in MOAs is debatable. In an adverse outcome pathway (AOP) framework, pathways typically begin with a molecular initiating event (MIE), which tends to be downstream of pharmacokinetic considerations. Indeed, others have proposed new exposure frameworks to intersect with AOPs that comprise so-called aggregate exposure pathways (AEPs) leading to target site exposures (TSEs) (Tan et al. Citation2018). No such formal exposure analysis is presented here; however, we do present evidence for potential thresholds in formaldehyde dosimetry to the rat nasal mucosa.
As discussed in previous sections, extracellular clearance of formaldehyde has long been recognized to attenuate formaldehyde toxicity. Studies in the 1980s and 1990s included investigation of the role of mucus and mucociliary clearance as a protective barrier and clearance mechanism of inhaled formaldehyde. Specifically, the high solubility of formaldehyde in mucus, binding to components within the mucus, and mucus flow provide scrubbing and removal of formaldehyde from the sites of highest contact (Morgan Citation1997). Until recently, dosimetry of formaldehyde (as measured by labeled DPC) into nasal tissue appeared to exhibit a linear pattern down to exposure concentrations of 0.3 ppm; however, Casanova et al. (Citation1989) speculated that exposure concentrations below 0.1 ppm might not result in exogenous DPC. As shown in , recent data indicate that exposures below 0.3 ppm [13CD2]-formaldehyde do not result in detectable levels of exogenous DNA adducts (Leng et al. Citation2019). As already discussed, these represent the most stable biomarkers of exposure and thus strongly indicate a lack of dosimetry to the rat nasal cavity.
Similar to in vivo studies, in vitro studies have also demonstrated practical limits/thresholds for the detection of exogenous formaldehyde. HepG cells exposed to 125, 250, and 500 µM [13CD2]-formaldehyde for 1 h in PBS buffer resulted in detection of exogenous HmdG adducts in all groups, whereas the same exposures in culture medium containing 10% fetal bovine serum and amino acids resulted in exogenous HmdG adducts only at 250 and 500 µM (Lu et al. Citation2012). These results are likely explained by extracellular binding to protein and other macromolecules in the culture medium, which thereby serve as non-enzymatic barriers to formaldehyde entry into cells.
Overall, the available data indicate that there is a practical threshold at which inhaled formaldehyde is unlikely to lead to any consequential (biological or toxicological) increase in cellular formaldehyde levels that are already naturally present in the nasal tissue.
3.3.2. Key event 1. Saturation of formaldehyde metabolism & increased formaldehyde adduction
In addition to extracellular barriers to formaldehyde exposure, there are intracellular mechanisms that regulate intracellular levels of formaldehyde. Formaldehyde is a reactive aldehyde that undergoes enzymatic and non-enzymatic detoxification. Internal markers of formaldehyde exposure include exogenous formaldehyde DNA adducts and transcriptomic responses. As shown in , exogenous HmdG levels in nasal tissue at 0.7 ppm are approximately an order of magnitude lower than the endogenous levels. Between 6 and 10 ppm, exogenous formaldehyde levels approach endogenous levels, and above 10 ppm, the exogenous HmdG levels rise more steeply and exceed endogenous levels approximately four-fold at 15 ppm.
These data are consistent with transcriptomics. Rats exposed to 0.7 ppm formaldehyde for up to 15 days did not exhibit significant transcript changes in the nasal mucosa. At 2 ppm, significant changes were seen in ∼15 genes, which Andersen et al. (Citation2008) concluded were mostly “associated with cell membrane, external aspect of the cell membrane, or cell architecture”. Exposure to 6 and 15 ppm increased the number of significantly altered genes to ∼50 and 745, respectively (Andersen et al. Citation2008). At ≥6 ppm, gene expression changes showed enrichment of pathways involved in cell cycle, DNA repair, and apoptosis (Andersen et al. Citation2010). Overall, the data indicate few cellular changes below 2 ppm, transcriptomic responses occur at ∼2 ppm in naïve respiratory mucosa and at ∼6 ppm in squamous epithelium, i.e. in longer-term bioassays. This generally agrees with the prediction of Casanova et al. (Citation1989) 30 years ago that formaldehyde metabolism is half saturated at air concentrations of approximately 2.6 ppm, as well as more recent pharmacokinetic models predicting that exposure below 2 ppm results in minimal changes in GSH and formaldehyde acetal formation and exposures above 4 ppm depletes GSH rapidly with concomitant increases in formaldehyde acetal formation (Andersen et al. Citation2010).
3.3.3. Key event 2. Irritation/cytotoxicity and/or pro mutagenic DNA damage
Key Event 2 in the MOA is divided into two events that have been hypothesized to be key drivers in tumor formation. Both cytotoxicity (and subsequent regeneration) and DNA adducts/crosslinks are observed following exposure to formaldehyde. Because “mutagenic MOAs” have been proposed for formaldehyde (U.S. EPA Citation2010), where it is usually implied that there is a “linear” MOA and thus exogenous adducts pose some risk at all exposure levels, KE2b would be hypothesized to be operable early in the sequala of events and at low exposure levels as indicated in . In the MOA presented in McGregor et al. (Citation2006), genotoxicity was presented downstream of cell proliferation, perhaps implying a role for direct mutagenicity—although the authors generally believed that cell proliferation was a critical driver. As will be discussed below, data published after McGregor et al. (Citation2006) provide no evidence for a direct contribution of DNA lesions in the development of SCC.
3.3.3.1. Key event 2a. Irritation/cytotoxicity
As metabolism of formaldehyde begins to saturate above 2 ppm, free formaldehyde is available to react with cellular molecules to form adducts with protein, DNA, and other cellular constituents. Some of these adducts can signal stress in the cells that lead to adaptive responses whereas higher levels lead to cytotoxicity. Given the dual function of ADH3/ADH5/GSNOR in regulating formaldehyde and nitrosative status (Jensen et al. Citation1998; Staab, Alander, et al. Citation2008; Staab, Hellgren, et al. Citation2008), high levels of cellular formaldehyde might also alter other forms of protein regulation such as S-nitrosylation and S-glutathionylation. As noted above, gene expression changes in rat nasal tissue at 2 ppm varied over time, peaking after 5 days of exposure and then dissipating thereafter. This likely indicates rapid adaptive response to formaldehyde such as squamous metaplasia (see below) that mitigates the toxicity from exposure to 2 ppm formaldehyde. In contrast, exposure to 6 ppm continues to elicit transcript changes (≤50 genes depending on the exposure duration), and 15 ppm altering hundreds of genes (Andersen et al. Citation2008). Exposure to ≥6 ppm formaldehyde resulted in enrichment of pathways involved in cell cycle, DNA repair, and apoptosis (Andersen et al. Citation2010).
3.3.3.2. Key event 2b. Pro mutagenic DNA damage
Formaldehyde exposure results in concentration-dependent increases in DPC. These adducts could result from direct interaction with DNA or be remnants of DPC. DNA-protein crosslinks are structurally diverse due, in part, to the size of the peptides or proteins involved in the crosslink, and are generally regarded as toxic pro-mutagenic DNA adducts (Stingele and Jentsch Citation2015). Bulky DPC can block transcription and replication and lead to MN, SCE, mutation, and chromosomal rearrangement (Stingele and Jentsch Citation2015). Despite the clear presence of exogenous formaldehyde-induced DPC, controlled laboratory studies have failed to detect phenotypic markers of genotoxicity such as MN and mutations (see Section 3.2.5). Similarly, mice haploinsufficient for p53 do not develop neoplasms following exposure to up to 15 ppm. Transgenic mice deficient in ADH3/5 do not exhibit increased markers of genotoxicity and mutagenicity. Although some occupational exposure studies attribute increases in genotoxic markers to formaldehyde, controlled human chamber studies have failed to detect changes in genotoxic markers ().
The clear increase in exogenous DNA adducts vis-à-vis the lack of demonstrable genotoxicity indicates that the weight of evidence supports that exogenous formaldehyde DPC are biomarkers of exposure more so than effect. Nevertheless, it is difficult to prove that there is no potential for formaldehyde-induced DNA damage. At 15 ppm, there is a clear increase in HmdG adducts manifested as a 4-to-1 ratio of exogenous to endogenous adducts. Critically, an elevation in adducts at doses where there is clear cytotoxicity is not consistent with a mutagenic MOA, which is defined by many as when mutagenicity plays an early (and low dose) initiating event in the MOA. Stated differently, mutagenic MOAs should not require cytotoxicity and regenerative cell proliferation. As will be discussed later, a biologically motivated model for rat nasal tumors indicates that the best fitting model to the nasal tumor data does not require a mutagenic component from DPC, but rather can be explained by the increase in regenerative cell proliferation in response to cytotoxicity. For these reasons, we have added an “X” to the updated MOA in to indicate the apparent lack of contribution of Key Event 2 b to the overall MOA based on data published after 2006.
3.3.4. Key event 3. Squamous metaplasia
As a response to cytotoxicity, the respiratory epithelium undergoes squamous metaplasia, which is “an adaptive response induced by many irritants, in which the delicate respiratory epithelium…is replaced by a more resistant squamous epithelium” (Morgan and Monticello Citation1990). Morgan and Monticello go on to say that “[s]quamous metaplasia alone, unless it is accompanied with other cellular abnormalities, is probably not an important morphological manifestation of respiratory epithelial neoplasia, even though it may frequently accompany neoplastic development.” Renne et al. (Citation2009) provide similar views on squamous metaplasia, stating that repeated loss of epithelium “leads to transformation (metaplasia) to a more resistant cell type,” that the “squamous epithelium may provide a barrier sufficient to prevent further epithelial loss from exposure to toxicants, but frequently, squamous metaplasia and inflammation in response to repeated exposure are accompanied by some loss of surface epithelium, resulting in an increased rate of cell turnover and eventually, hyperplasia of affected mucosal epithelium”. Renne et al. also note that squamous metaplasia can give “rise to squamous cell papilloma or squamous cell carcinoma,” but that progression “is much less frequent than might be expected by the reported incidence of hyperplasia and squamous metaplasia.”
Squamous metaplasia can be reversible if exposure to irritants cease (dotted line in ). However, continued exposure to irritants can result in persistent metaplasia or long-term maintenance of a protective squamous epithelium. If exposures to formaldehyde continues at high concentrations that overwhelm the protection offered by the squamous epithelium, then cytotoxicity and regenerative cell proliferation ensue. summarizes the nasal levels (e.g. LII), concentrations, and time points where squamous metaplasia specifically has been reported. Overall, data indicate that exposure to 2 ppm formaldehyde results in a persistent transition to squamous epithelium without significant increases in active cell proliferation once the transition or remodeling has occurred. This transition is observed first in Level I and later in Level II. As will be described in the next section, exposure to higher concentrations of formaldehyde can damage the squamous epithelium leading to cytotoxicity and regenerative cell proliferation to replace the damaged mucosa.
Table 5. Summary of metaplasia in nasal cavity of rats in LI-III.
3.3.5. Key event 4. Cytotoxicity/cell proliferation
Upon continued exposure to higher concentrations of formaldehyde (≥6 ppm), the protection afforded by squamous metaplasia is not sufficient to mitigate cytotoxicity. Tissue integrity is maintained by the balance of cell birth and death; however, as noted in Morgan and Monticello (Citation1990), cell loss in a tissue is difficult to measure. In contrast, cell proliferation is more readily observed and measured, and therefore provides a proxy for increased cell death (or cell turnover). Aside from the cell proliferation data already discussed in Section 3.1.4 (), quantitative measures of cell replication have also been conducted in more recent transcriptomic and genotoxicity studies (Andersen et al. Citation2008, Citation2010) (Meng et al. Citation2010; Speit, Schutz, et al. Citation2011). These studies provide additional evidence for increased cell proliferation at ≥6 ppm with occasional reports of increases at 2 ppm (Speit, Schutz, et al. Citation2011). Overall, acute and subacute exposure to formaldehyde increases cell proliferation at ≥6 ppm (), whereas under chronic exposure scenarios, formaldehyde increases cell proliferation/turnover at 10 and 15 ppm (), which are the only concentrations to significantly increase nasal tumor incidence in the inhalation bioassays (). At 6 ppm, the protection afforded by squamous metaplasia mitigates toxicity/cell proliferation, which is consistent with only 3 of 325 rats developing nasal tumors (; Kerns et al. Citation1983; Monticello et al. Citation1996; Swenberg et al. Citation1980).
3.3.6. Key event 5. Mutation (replication error)
That tumors arose at ≥6 ppm formaldehyde in rats indicates involvement of genetic mutation. To date, direct evidence of mutation in the nasal cavity has not been demonstrated. Importantly, experts in genotoxicity testing recommend that genotoxicity tests ideally be conducted in tissues that (i) are the site of carcinogenic activity, (ii) receive high dosimetry via a relevant route of exposure, and (iii) are proliferative (MacGregor et al. Citation2015). Therefore, the most relevant genotoxicity tests for informing the MOA for formaldehyde-induced nasal tumor formation are ideally conducted in the nasal tissue of rodents, as it is the site of carcinogenic concern, receives the highest dosimetry via inhalation exposure, and the rate of epithelial production and loss of nasal tissue has been characterized as relatively rapid (Fabrikant and Cherry Citation1970). Analyses in transgenic Big Blue® mice indicate that the replication rate of nasal tissue, as measured by the ability to detect mutations following oral administration of the mutagen N-ethyl-N-nitrosourea, is more comparable to fast-dividing tissues like bone marrow as opposed to slower dividing tissues like lung and liver (Young and Dinesdurage Citation2016).
As discussed in Section 3.2.5, studies investigating the genotoxicity of formaldehyde in the nasal cavity of rats have all been negative—even at concentrations that increase DPC and cell proliferation (). As previously discussed, 5/11 tumors from rats exposed chronically to 15 ppm formaldehyde exhibited p53 mutations (Recio et al. Citation1992). Meng et al. (Citation2010) found no evidence that formaldehyde increased the MF in p53 codon 271 in rats exposed to up to 15 ppm formaldehyde for 13 weeks—suggesting that the p53 mutations observed in nasal tumors are unlikely the result of early mutational events. The role of DNA damage and p53 was investigated more recently using two strains of mice haploinsufficient for Trp53 (Morgan et al. Citation2017). As discussed in Section 3.2.5, these mice exhibited signs of squamous metaplasia following exposure to 7.5 and 15 ppm formaldehyde, indicating that nasal tissue received sufficient doses of formaldehyde to induce physical changes despite the proclivity of mice to undergo reflex apnea (Chang et al. Citation1981, Citation1983). The lack of nasal tumor development in p53+/− mice indicates that inhibiting p53 DNA damage response pathways does not potentiate formaldehyde-induced nasal tumor formation. From a MOA perspective, these findings do not support that formaldehyde-induced DPC lead to genotoxic events that might be exacerbated in p53-compromised mice.
3.3.6.1. Insights from biological modeling regarding the role of mutation
While not mechanistic data per se, sophisticated biologically-based dose-response (BBDR) models have provided insight into the likely MOA for formaldehyde (Conolly et al. Citation2003, Citation2004). The BBDR model incorporates CFD modeling data described in Section 3.2.4.3. These flux estimates are linked to empirical data on cell proliferation and DPC following formaldehyde exposure. Specifically, the BBDR model links CFD modeling flux predictions to cell replication as measured by ULLI, which Conolly et al. (Citation2003) considered a proxy for cytotoxicity; hence, they used the term cytotoxicity-regenerative cell proliferation (CRCP). Separately, the BBDR model links CFD modeling flux predictions to empirical DPC data. The BBDR model uses cell proliferation and DPC estimates to predict tumor formation using a two-stage clonal growth model (Moolgavkar and Knudson Citation1981; Moolgavkar et al. Citation1988) by independently assuming (1) that DPC is pro-mutagenic, and (2) that each round of cell division has a probability of inducing a mutation. Restated, mutation in the target cell population was estimated by including functions that relate DPC to direct mutagenicity and cell replication to the probability of spontaneous mutation.
Because early data indicated a linear relationship between formaldehyde exposure and DPC formation in the low dose exposure region (<2 ppm), mutation from DPC was modeled with a low-dose linear dose-response. In contrast, cell replication was modeled with a nonlinear dose-response to be consistent with empirical data on cell replication occurring primarily at higher formaldehyde concentrations. Once a cell acquires two mutations in the two-stage clonal growth model, transitioning from a normal to initiated cell (first mutation) and then from an initiated cell to a “cancer cell” (second mutation), the BBDR model includes a time delay function to simulate clonal expansion from a cancer cell to visible tumor. Overall, the BBDR model closely fit the probability of tumor response in exposed and unexposed rats. Importantly, sensitivity analysis indicated that mutation from DPC made little/no contribution to the tumor response. Conolly et al. (Citation2003) state:
For both the J- and hockey stick-shaped CRCP data, the maximum value of the LLFFootnote7 was obtained with KMUFootnote8 at or near 0. This result means that the optimal descriptions of the data obtained with the current model did not depend on a directly mutagenic effect of formaldehyde. Furthermore, the optimal configuration of the current model explains the tumor data in terms of (1) the basal probability of mutation per cell generation, (2) the effect of formaldehyde on the cell division rate, (3) a basal growth advantage for initiated cells, (4) a concentration-dependent inhibition by formaldehyde of the growth advantage and, (5) a time delay for appearance of clinically detectable tumors. (emphasis added)
The sensitivity analysis indicates that increases in cytotoxicity and regenerative cell proliferation are the primary drivers of formaldehyde-induced nasal tumors in rodents. These in silico insights in 2003 are consistent with the lack of evidence for genotoxicity in target tissue published since Conolly et al. (Citation2003) (see Section 3.2.5).
3.3.7. Squamous cell carcinoma
The adverse outcome, i.e. squamous cell carcinoma (SCC), is not a key event per se; however, it is important to realize that significant work indicates that the key events described above have generally been examined in the specific tissue locations where tumors arise (). Consistent with the notion that long-term increases in cell proliferation are needed for formaldehyde to induce tumors, the first neoplastic lesions occurred in male and female rats at 358 and 432 days, respectively (Kerns et al. Citation1983). In Monticello et al. (Citation1996), the single tumor at 6 ppm occurred at day 622.
3.4. Bradford-Hill criteria
The U.S. EPA Guidelines for Carcinogen Risk Assessment and the IPCS have advocated the adoption of the Bradford Hill criteria for assessing causality in epidemiological studies for application in judging the strength of data in supporting MOA analyses (Hill Citation1965; Sonich-Mullin et al. Citation2001; U.S. EPA Citation2005). More recently, attempts have been made to standardize the use of these criteria by addressing specific questions related to each criterion (Meek, Palermo, et al. Citation2014). Each of these modified Hill criteria are evaluated below as they relate to the MOA for formaldehyde-induced nasal tumors.
3.4.1. Dose-response concordance
Critical among the modified Hill criteria is dose–response concordance. shows the dose and temporal concordance of the key events in the proposed MOA for nasal tumors following inhalation exposure to formaldehyde. While this table treats the nasal cavity as a single target tissue responding to applied inhalation concentration, it should be appreciated that the dose response for many key events is localized to specific anatomical regions within the nasal cavity. Within each region of the nasal cavity, different applied doses are required to initiate the chain of events. Nevertheless, the concentrations in generally describe the nasal cavity changes as a whole.
Table 6. Dose and temporal concordance table.
Table 7. Human relevance.
3.4.2. Temporality
The available data support the timing of key events in . Acute, subacute, and subchronic exposures have all been shown to increase DPC. Likewise, acute, subacute, and subchronic, and chronic studies indicate induction of squamous metaplasia, which affects ULLI at different durations and levels of formaldehyde exposures. In contrast, nasal tumors are seen after ∼1 year of exposure or longer. Despite evidence for acute increases in DPC, to date there is little evidence for genotoxic responses in subchronic assays, which lends support to genotoxicity occurring downstream in the MOA—even at 15 ppm where exogenous HmdG exceed endogenous HmdG. This suggests that cell transformation is not an early event in MOA. In contrast, it is well-accepted that increased cell replication increases the chance of spontaneous mutation and tumorigenesis (Moolgavkar and Knudson Citation1981; Greenfield et al. Citation1984; Cohen and Ellwein Citation1990; Tomasetti and Vogelstein Citation2015).
3.4.3. Consistency and specificity
Consistency and specificity address the repeatability of results across studies and the availability of counterfactual evidence for involvement of key events (Meek, Boobis, et al. Citation2014; Meek, Palermo, et al. Citation2014). As evidenced throughout this article, there is a high degree of consistency across studies. This includes: (1) multiple cancer bioassays providing similar dose-response relationships for cytotoxicity, regenerative cell proliferation and nasal tumor formation; (2) decades of research reporting on DPC and related lesions in the portal of entry (but not elsewhere); (3) consistent data on DPC and related lesions throughout the evolution of technological advances; and (4) several negative in vivo genotoxicity studies. Moreover, similar key events are seen in mice and monkeys (see Section 3.6 below), lending strength that the key events are universal provided significant exposure.
Perhaps the most difficult Hill criterion to address is specificity, which Meek, Palermo, et al. (Citation2014) further characterize as addressing the question of whether there is counterfactual data (e.g. blocking an upstream key event blocks downstream key events) to support a proposed MOA. For a chemical such as formaldehyde, an efficient method for blocking cytotoxicity and/or regenerative cell proliferation is not available. However, Casanova and Heck (Citation1987) blocked the first step in ADH3/5-mediated formaldehyde metabolism by pharmacologically depleting GSH with phorone prior to exposure to 0.9–10 ppm [3H]- and [14C]-formaldehyde for 3 h. They detected DPC formation in nasal tissue at lower formaldehyde concentrations when pre-exposed to phorone (see ). DPC was also higher in the nasal respiratory mucosa of GSH-depleted rats compared to non-depleted rats at all higher exposure concentrations (Casanova and Heck Citation1987). These findings highlight the importance of GSH-dependent detoxification via ADH3/5. Similarly, ablation of ADH3/5 increases HmdG levels in mice but not markers of genotoxicity; however loss of both ADH3/5 and ALDH dramatically increases HmdG and genotoxicity (see Section 3.2.5.2.2).
The NTP conducted formaldehyde studies in two strains of mice haploinsufficient for Trp53 (Morgan et al. Citation2017). These studies can be viewed as counterfactual studies, in that mice made susceptible to DNA damage would be expected to exhibit signs of tumorigenesis at lower exposure concentrations or earlier timepoints. As noted previously, these mice exhibited signs of squamous metaplasia, indicating that nasal tissue received sufficient dose of formaldehyde to induce physical changes. Notably, mice are not completely resistant to formaldehyde-induced nasal tumors, as a few mice (2/240) exposed to 14.3 ppm formaldehyde developed SCC (Kerns et al. Citation1983). The lack of nasal tumor development in p53+/− mice suggests that direct DNA damage is not an initiating event in the MOA.
3.4.4. Biological plausibility
The MOA presented herein is biologically plausible and similar MOAs driven by cytotoxicity and regenerative cell proliferation have been generally recognized for other chemicals and biological agents. It is well accepted that increased cell proliferation increases the chance to permanently fix (i.e. encode) spontaneous mutations (Moolgavkar and Knudson Citation1981; Greenfield et al. Citation1984; Cohen and Ellwein Citation1990; Tomasetti and Vogelstein Citation2015). As such, the totality of data provides greater support for the plausibility of a non-mutagenic MOA than for a mutagenic MOA for formaldehyde-induced nasal tumors in rodents, as evidenced by the nonlinear dose response for DNA adducts, cytotoxicity, regenerative cell proliferation, and tumor incidence. It is worth noting here that the MOA analysis by McGregor et al. (Citation2006) stated that it was “desirable” to know more about the relationship between formaldehyde-induced DPC and mutation. This remains the case and we suspect that the next decade of research might further inform the relationship between DPC and DNA damage, perhaps by using new error-corrected sequencing technologies (Salk et al. Citation2018).
3.5. Alternative MOAs
An alternative MOA for formaldehyde-induced nasal tumors is one that involves both cytotoxicity and a direct mutagenic contribution from DPC at concentrations that induce cell proliferation and increase HmdG levels well above endogenous levels. The increase in exogenous HmdG at 15 ppm (), for example, might conceivably increase genotoxicity. Such a mechanism, if operational, would not be consistent with the assumptions inherent in a mutagenic linear no threshold (LNT) MOA. Instead, the dose-response would still be nonlinear, albeit with meaningful contribution of DPC to cell transformation and tumorigenesis. However, as described earlier, direct evidence of genotoxicity has not been demonstrated in the nasal tissue following inhalation exposure to formaldehyde and relationships between biomarkers like HmdG and mutation are currently unknown.
Based on evidence that formaldehyde interacts with lysine residues, it has been suggested that epigenetic mechanisms might play a role in formaldehyde-induced tumor formation (Edrissi et al. Citation2017). A key characteristic of epigenetic mechanisms is the induction of a “mutator phenotype” leading to genomic instability (Pogribny et al. Citation2008). As such, one might expect epigenetic changes to further facilitate the detection of genotoxic endpoints in subchronic assays; however, such genotoxicity has not been readily observed (see Section 3.2.5). One study has reported epigenetic changes in monkey nasal tissue following just 2 days of exposure to 2 and 6 ppm formaldehyde that indicate decreased apoptosis signaling (Rager et al. Citation2014). Whether epigenetic changes represent generic responses to tissue damage and repair, or play some specific role in the MOA of formaldehyde is unknown; however, there is insufficient evidence to support epigenetics as a KE in the MOA at this time.
In McGregor et al. (Citation2006), key events in the MOA for formaldehyde were compared to glutaraldehyde. McGregor and colleagues noted that glutaraldehyde also induces nasal toxicity, cell proliferation, and DPC but is not carcinogenic to rodents. While they acknowledged that the reason for the difference in carcinogenic response was unknown, they posited that the significant increased cytotoxic potency of glutaraldehyde relative to formaldehyde might explain the absence of carcinogenicity. Specifically, they hypothesized that the dialdehyde function that makes glutaraldehyde a stronger fixative than formaldehyde might lead to immobilization of proteins and facilitate cell death rather than “change in differentiation state.” The recent work by Swenberg and colleagues underscores the ubiquity of formaldehyde in cells and reiterates that cells have evolved to regulate formaldehyde within the nucleus and cytoplasm. As such, cellular increases of endogenous aldehydes like formaldehyde are likely to elicit different homeostatic and adaptive responses than cellular increases of glutaraldehyde. In addition, the dual functionality of ADH3/GSNOR could lead to disruption of multiple cellular processes as enzymatic oxidation of formaldehyde can facilitate GSNO reduction thereby affecting cellular protein S-nitrosylation and protein function (Staab, Alander, et al. Citation2008; Foster et al. Citation2009). For example, loss of GSNOR activity leads to decreased O6-alkylguanine-DNA-alkyltranserase (AGT)Footnote9 DNA repair as a result of imbalances in S-nitrosylation (Wei et al. Citation2010; Tang et al. Citation2013). Interestingly, Yu et al. (Citation2015) showed that formaldehyde could form dG adducts with a cysteine residue in a synthesized 11-mer peptide of AGT, and Lu, Ye, et al. (Citation2010) speculated that formaldehyde crosslinks might occur with cysteines in the active sites of AGT. Such interactions might explain in vitro evidence that formaldehyde inhibits DNA repair by AGT (Grafstrom et al. Citation1985; Pegg Citation2011). Overall, the effects of elevated cellular formaldehyde are likely very different from elevated glutaraldehyde, irrespective of their crosslinking ability per se.
3.6. Human relevance
Human relevance addresses three fundamental questions: (1) is the WOE sufficient to establish the MOA in animals, (2) are the key events plausible in humans, and (3) are the key events plausible in humans after accounting for pharmacokinetics and pharmacodynamics (Meek et al. Citation2003; Boobis et al. Citation2008). The answer to the first two questions is yes. The WOE is sufficient to establish the MOA in rats, and the key events are plausible in humans because many of the same effects have been observed in non-human primates exposed to formaldehyde (). For example, cynomolgus monkeys exposed to 0, 0.2, 1, and 3 ppm formaldehyde for 22 h per day for 6 months exhibited incidences of squamous metaplasia of 0/12, 0/6, 1/6 and 6/6, respectively in the nasal turbinates (Rusch et al. Citation1983). In rhesus monkeys exposed to 6 ppm formaldehyde, histopathological signs of cytotoxicity, squamous metaplasia, and hyperplasia were observed on nasal turbinates (Monticello et al. Citation1989). Like rats, lesions were more prominent in the proximal regions of the nasal cavity. Unlike rats, lesions were observed more distally in monkeys—reaching the nasopharynx region. Increases in labeling index were also observed in all levels of the nasal cavity following exposure to 6 ppm for both 1 and 6 weeks (Monticello et al. Citation1989). As already discussed in Section 3.2.4.2, DPC were detected in the nasal turbinates, lateral wall, septum, and to a lesser extent in the nasopharynx (Casanova et al. Citation1991; Moeller et al. Citation2011).
Human evidence of formaldehyde-induced nasal lesions is mixed (IARC Citation1995). For example, workers with ∼10 year tenures in formaldehyde resin plants exposed to ∼0.4 ppm formaldehyde exhibited adverse nasal scores of 2.16 vs 1.56 (p < 0.05) in clerical workers in the same industry (Holmstrom et al. Citation1989). On the other hand, nasal swabs from workers in formaldehyde resin plants exposed to up to 2 ppm formaldehyde (with peaks exposures as high as 15 ppm) with employment durations of ∼15 years did not differ from white collar workers (Berke Citation1987). Taken together with histological data from monkeys, human data suggest the possibility for inhaled formaldehyde to damage the nasal mucosa of humans frequently exposed to ppm levels of formaldehyde.
With regard to site of contact genotoxicity, several occupational and student studies have reported increases in nasal or buccal MN in formaldehyde-exposed individuals (Fenech et al. Citation2016; Albertini and Kaden Citation2017). However, as discussed in Section 3.2.5.2, genotoxicity has not been observed in humans under controlled exposure conditions. Notwithstanding evidence against systemic distribution following inhalation exposure to formaldehyde (see Section 3.2.4 and Gentry et al. (Citation2021)), Fenech et al. (Citation2016) reported an overall significant 2-fold increase in MN in peripheral lymphocytes in various workers with occupational exposure to formaldehyde, and ascribed the effects solely to formaldehyde. Fenech et al. (Citation2016) also report a correlation between positive Comet and MN results in lymphocytes; however, the lack of systemic delivery of formaldehyde suggests such DNA damage in the Comet assay must result from other sources such as co-exposure to other systemically acting agents. Fenech et al. (Citation2016) also posit that DNA damage in lymphocytes might be due to inflammatory processes or oxidative stress induced by formaldehyde within the nasal passages. Neither inflammation nor oxidative stress would be consistent with a linear MOA (e.g. mutagenic MOA) or linear risk assessment.
Overall, the answer to the third question about human relevance, i.e. are the key events plausible in humans after accounting for pharmacokinetics, is dependent on modeling data. Specifically, CFD and BBDR models have been used to estimate what inhaled formaldehyde concentrations could result in carcinogenic internal formaldehyde doses in the human respiratory tract (Conolly et al. Citation2003, Citation2004). Considering that components to these models are being updated and refined (Schroeter et al. Citation2014; Miller et al. Citation2017; Campbell et al. Citation2020), updated models can be used to estimate what environmental exposures would be required to increases cell proliferation and/or tumors in specific regions of the human respiratory tract in the near future (see below).
3.7. Implications for risk assessment
3.7.1. A Reference concentration (RfC) approach for cancer
Consistent with U.S. EPA guidance, the MOA and human relevance analysis herein supports the consideration of non-linear approaches for assessing cancer risk from inhaled formaldehyde. Regarding approaches for low-dose extrapolation, the U.S. EPA’s Guidelines for Carcinogen Risk Assessment (2005) state,
A nonlinear approach should be selected when there are sufficient data to ascertain the mode of action and conclude that it is not linear at low doses and the agent does not demonstrate mutagenic or other activity consistent with linearity at low doses. Special attention is important when the data support a nonlinear mode of action but there is also a suggestion of mutagenicity. Depending on the strength of the suggestion of mutagenicity, the assessment may justify a conclusion that mutagenicity is not operative at low doses and focus on a nonlinear approach, or alternatively, the assessment may use both linear and nonlinear approaches. (emphases added)
Although these guidelines are silent on what exactly nonlinear approaches are, they go on to say,
For cases where the tumors arise through a nonlinear mode of action, an oral reference dose or an inhalation reference concentration, or both, should be developed in accordance with EPA’s established practice for developing such values…This approach expands the past focus of such reference values (previously reserved for effects other than cancer) to include carcinogenic effects determined to have a nonlinear mode of action.
These guidelines clearly indicate that RfC and RfD values for cancer endpoints can be derived in a manner similar to any non-cancer endpoint. In practice, the development of such values for a cancer endpoint has typically relied on quantitative dose-response modeling of precursor lesions. Nearly two decades ago, an RfC approach was described for formaldehyde-induced nasal tumors using benchmark dose (BMD) and pharmacokinetic modeling (Schlosser et al. Citation2003). In that analysis, lesions were modeled using the applied dose (i.e. ppm formaldehyde), and the BMD values extrapolated to humans using pharmacokinetic models. Schlosser et al. (Citation2003) derived BMCL values for cell proliferation and tumors of ∼4 ppm and 6 ppm, respectivelyFootnote10. After BMD modeling using the applied air concentration (ppm), Schlosser et al. (Citation2003) used CFD models of the rat nasal passages to estimate the flux of formaldehyde to the rat nasal mucosa at the BMCL concentration. A human CFD model was then used to estimate the human inhalation exposure that results in the same tissue flux as predicted for rats. The human equivalent BMCL10HEC values for cell proliferation and tumor formation were ∼3 and 4.5 ppm, respectively. BMCL values could be derived for various effects such as cell proliferation or accumulation of HmdG adducts, and then adjusted by appropriate uncertainty factors to derive RfC values that are protective of cancer.
3.7.2. A biologically based dose–response (BBDR) model for cancer
The U.S. EPA’s Guidelines for Carcinogen Risk Assessment (2005) advocate the use of toxicokinetic and toxicodynamic models in risk assessment,
Toxicokinetic modeling is the preferred approach for estimating dose metrics from exposure. Toxicokinetic models generally describe the relationship between exposure and measures of internal dose over time…Toxicodynamic modeling can be used when there are sufficient data to ascertain the mode of action…Toxicodynamic modeling is potentially the most comprehensive way to account for the biological processes involved in a response. Such models seek to reflect the sequence of key precursor events that lead to cancer…If a standard model already exists for the agent's mode of action, the model can be adapted for the agent by using agent-specific data to estimate the model's parameters. An example is the two-stage clonal expansion model…critical parameters (e.g. mutation rates and cell birth and death rates) are estimated from laboratory studies and not by curve-fitting to tumor incidence data. Toxicodynamic modeling can provide insight into the relationship between tumors and key precursor events. For example, a model that includes cell proliferation can be used to explore the extent to which small increases in the cell proliferation rate can lead to large lifetime tumor incidences…
The risk of nasal tumors in humans was previously assessed using a BBDR model (Conolly et al. Citation2003, Citation2004). This model was described in Section 3.3.6.1. In their review of the 2010 U.S. EPA draft risk assessment of formaldehyde, the U.S. National Academy of Sciences recommended that U.S. EPA strongly consider using these BBDR models to develop safety criteria (NAS Citation2011). Conolly et al. (Citation2004) estimated the approximate 1E-6 excess cancer risk in nonsmoking, mixed, and smoking populations to be 0.3, 0.03, and 0.02 ppm, respectively. It should be noted that these cancer risk estimates are based on assumptions that DPC increases the chance of mutation in an assumed linear relationship, and there is no evidence of cell proliferation at these concentrations. While this is conservative, the model assumptions about the low-dose linearity of DPC formation has been called into question by the study by Leng et al. (Citation2019) and the relationship between DPC and mutation is called into question by target tissue genotoxicity studies published after 2004 (see ). Clearly, updating the CFD and BBDR models with new data collected since 2004 could refine these estimates. To that end, efforts are ongoing to update critical components of the BBDR model (Miller et al. Citation2017; Campbell et al. Citation2020).
4. Discussion
Formaldehyde is one of the most well-studied chemicals with regard to toxicology and MOA (Andersen et al. Citation2019). It is also one of the few chemicals for which exposure-related DNA modifications have been directly compared to endogenous DNA modifications (Farland et al. Citation2019). Given the availability of BBDR models for formaldehyde, the various key events in the MOA described herein could be described in terms of internal dose, and key event relationships also quantified (e.g. spontaneous mutation was a function of cell replications). However, such an effort is beyond the scope of the current article, and there are ongoing efforts to update the BBDR model for formaldehyde-induced nasal tumors (Miller et al. Citation2017; Campbell et al. Citation2020).
In 2006, the MOA for formaldehyde-induced nasal tumors in rats was recognized to involve cytotoxicity and regenerative cell proliferation; however, the role of DPC was uncertain. The updated MOA herein, based on research published after 2006, reiterates the role of cytotoxicity and regenerative cell proliferation, and provides additional data to suggest that DPC are certainly biomarkers of exposure but may not meaningfully contribute to cancer via genotoxic effects except at concentrations that result in tissue levels that increase HmdG well above endogenous levels. In rats, that may occur in specific regions of the anterior nasal cavity at inhalation concentrations above 15 ppm, as data do not indicate genotoxic or mutagenic responses at 15 ppm.
The most recent data provide three important new insights into the MOA for nasal tumors in rats. First, there are exposure concentrations that do not result in detectable biomarkers (e.g. exogenous HmdG) of exposure in rats (i.e. ≤0.3 ppm); thus, there are likely limits to human exposures that result in tissue exposure. Second, exposures to several ppm formaldehyde is required to increase exogenous HmdG to and above endogenous levels in specific regions of the rat nasal cavity. Third, the genotoxic potential of exogenous HmdG levels at and above endogenous levels appears to be weak or nil (up to 15 ppm), as evidenced by the lack of positive genotoxicity findings in rats. This suggests that the MOA is driven by the chronic proliferative pressure resulting from chronic exposure to concentrations of formaldehyde that continue to damage the nasal mucosa even after adaptive squamous metaplasia has occurred. These new data, together with the previous data, indicate that toxicity criteria for formaldehyde estimated with linear approaches is not supported by the available science.
It is anticipated that the MOA analysis herein can be used for risk evaluation under the updated Frank R. Lautenberg Chemical Safety for the 21st Century Act. As recently highlighted in a special issue of Chemico-Biological Interactions (volume 301, 2019), the default approach of low-dose linear extrapolation in risk assessment is predicated on a LNT model that has controversial origins (Golden et al. Citation2019). Not only is the LNT model likely inaccurate for many chemical carcinogens, but it seems particularly inapplicable to formaldehyde. As shown herein, the data gaps (i.e. uncertainties) in the MOA for formaldehyde-induced nasal tumors proposed in 2006 have been further narrowed. Nevertheless, a better understanding of the relationship between specific formaldehyde DNA adducts and genotoxic potential could address remaining uncertainties in the assessment of formaldehyde as well as other chemistries with similar issues.
Supplemental Material
Download MS Word (15.9 KB)Acknowledgements
The authors appreciate the extensive comments provided by three reviewers selected by the Editor and anonymous to the Authors. The comments they provided helped improve the final manuscript. The authors thank Drs. James Sherman (Celanese Corporation), Melvin Andersen (Andersen ToxConsulting, LLC), Rory Conolly (U.S. EPA, retired), Samuel Cohen (University of Nebraska Medical Center), and Marylin Aardema (Aardema Consulting, LLC) for their insight and comments on this manuscript. We especially recognize Dr. James Swenberg (University of North Carolina, Chapel Hill, NC; retired) for his groundbreaking work on ultra-sensitive DNA and protein adduct analytical techniques.
Declaration of interest
The authors’ employment affiliations are shown in the title block above. Both ToxStrategies and Ramboll are private consulting firms providing services to private and public organizations on toxicology and risk assessment issues. This project was a concept presented jointly by ToxStrategies and Ramboll to the Formaldehyde Science Panel of the American Chemistry Council (ACC) (https://www.americanchemistry.com; https://formaldehyde.americanchemistry.com) in 2018, as it represented a data gap in the science for formaldehyde. The ACC is America’s oldest trade association of its kind, representing more than 170 companies engaged in the production, manufacture and use of chemicals. The concept consisted of outlines for the proposed manuscripts and costs associated with development, as well as a plan to request review and input from relevant experts in the subject matter outside of Ramboll and ToxStrategies. All of the experts that provided review or input are included as coauthors or listed in the acknowledgements. This work was supported by the Foundation for Chemistry Research & Initiatives (FCRI), a 501(c)(3) tax-exempt organization established by the ACC with funding from industry (https://foundationforchemistry.org); however, no one from FCRI or ACC was involved in the preparation of the manuscript. Members of the Formaldehyde Science Panel of ACC, under the direction and coordination of Dr. Kimberly Wise White, were given the opportunity to review the draft manuscript. The purpose of this review was for the authors to receive input on the clarity of the science presented but not on the interpretation of research results. Most of the members did not provide any comments and those that did are listed in the acknowledgements. The researchers’ scientific conclusions and professional judgments were not subject to the funders’ control; the contents of this manuscript reflect solely the view of the authors.
The project was funded through contracts between FCRI and ToxStrategies or Ramboll. Both ToxStrategies and Ramboll are currently contracted with multiple chemical panels at ACC to provide scientific consulting support for chemicals other than formaldehyde. Ramboll is also currently contracted by FCRI or ACC on three other projects involving the evaluation of the available science and a risk assessment for formaldehyde. All the scientists of ToxStrategies (CT, SF) and Ramboll (RG, HC) involved in the development of the current manuscript were provided salary compensation as part of their employment as scientific consultants. KL received an honorarium for his involvement in the development of this manuscript, as well as an additional manuscript funded by FCRI/ACC on the mode of action of leukemia following inhalation of formaldehyde (Gentry et al. Citation2021). KL currently and has previously received funding from FCRI and ACC for formaldehyde research conducted at the University of North Carolina at Chapel Hill. As noted previously, relevant experts were asked for review and input and are either coauthors or listed in the acknowledgments. In addition, anyone else who provided comments for consideration are listed in the acknowledgements.
There are no conflicts of interest for any of the authors to disclose related to the submission of this manuscript. None of the authors are currently engaged to testify as experts on behalf of the sponsors in litigation related to formaldehyde. Prior to the initiation of this project, RG participated in a meeting with the EPA on behalf of ACC to discuss the current state of the science for formaldehyde and the need to consider the mode of action data in a risk assessment for formaldehyde. None of the other coauthors were involved in this meeting. It is anticipated that regulatory authorities will consider the contents of this review in making regulatory decisions regarding the potential health effects of formaldehyde.
Supplemental material
Supplemental material for this article is available online here.
Additional information
Funding
Notes
1 Per U.S. EPA (Citation2005): “The term “mode of action” is defined as a sequence of key events and processes, starting with interaction of an agent with a cell, proceeding through operational and anatomical changes, and resulting in cancer formation…Mode of action is contrasted with “mechanism of action,” which implies a more detailed understanding and description of events, often at the molecular level, than is meant by mode of action…There are many examples of possible modes of carcinogenic action, such as mutagenicity, mitogenesis, inhibition of cell death, cytotoxicity with reparative cell proliferation, and immune suppression.”
3 Most studies and reviews on formaldehyde metabolism refer to the substrate as formaldehyde and not the hydrated form, formaldehyde acetal.
4 Note: our calculations are consistent with EFSA (Citation2014).
5 200 mm3 × (0.001 mL/mm3) × (1 g/mL) = 0.2 g
6 Note: Kimbel et al. use different nomenclature when referring to the anterior regions of nasal passages, specifically “level 6.”
7 proportionality constant relating tissue concentration of DPC to probability of mutation per generation of normal or initiated cells.
8 log likelihood for model fit.
9 Note: the O6-alkylguanine-DNA- alkyltransferase protein is encoded by O6-alkylguanine-DNA- methyltransferase gene (MGMT).
10 Using U.S. EPA’s BMDS v3.2 and the same data in Schlosser et al. (Citation2003), we derived similar BMCL values; specifically, 6.3 ppm (log-probit model) for SCC and 3–6 ppm for cell proliferation.
References
- Albertini RJ, Kaden DA. 2017. Do chromosome changes in blood cells implicate formaldehyde as a leukemogen? Crit Rev Toxicol. 47(2):145–184.
- Andersen ME, Clewell HJ, 3rd, Bermudez E, Dodd DE, Willson GA, Campbell JL, Thomas RS. 2010. Formaldehyde: integrating dosimetry, cytotoxicity, and genomics to understand dose-dependent transitions for an endogenous compound. Toxicol Sci. 118(2):716–731.
- Andersen ME, Clewell HJ, 3rd, Bermudez E, Willson GA, Thomas RS. 2008. Genomic signatures and dose-dependent transitions in nasal epithelial responses to inhaled formaldehyde in the rat. Toxicol Sci. 105(2):368–383.
- Andersen ME, Gentry PR, Swenberg JA, Mundt KA, White KW, Thompson C, Bus J, Sherman JH, Greim H, Bolt H, et al. 2019. Considerations for refining the risk assessment process for formaldehyde: results from an interdisciplinary workshop. Regul Toxicol Pharmacol. 106:210–223.
- Aoki Y, Matsumoto M, Matsumoto M, Masumura K, Nohmi T. 2019. Mutant frequency is not increased in mice orally exposed to sodium dichromate. Food Saf (Tokyo). 7(1):2–10.
- Appelman LM, Woutersen RA, Zwart A, Falke HE, Feron VJ. 1988. One-year inhalation toxicity study of formaldehyde in male rats with a damaged or undamaged nasal mucosa. J Appl Toxicol. 8(2):85–90.
- Asanami S, Shimono K, Kaneda S. 1998. Transient hypothermia induces micronuclei in mice. Mutat Res. 413(1):7–14.
- Asanami S, Shimono K, Kaneda S. 2001. Effect of temperature on the frequency of chromosome aberrations and micronuclei in cultured Chinese hamster cells. J Toxicol Sci. 26(5):323–326.
- ATSDR 1999. Toxicological profile for formaldehyde. Atlanta (GA): U.S. Department of Health and Human Services, Public Health Service.
- Barnett SD, Buxton ILO. 2017. The role of S-nitrosoglutathione reductase (GSNOR) in human disease and therapy. Crit Rev Biochem Mol Biol. 52(3):340–354.
- Beane Freeman LE, Blair A, Lubin JH, Stewart PA, Hayes RB, Hoover RN, Hauptmann M. 2009. Mortality from lymphohematopoietic malignancies among workers in formaldehyde industries: the National Cancer Institute Cohort. J Natl Cancer Inst. 101(10):751–761.
- Berke JH. 1987. Cytologic examination of the nasal mucosa in formaldehyde-exposed workers. J Occup Med. 29(8):681–684.
- Boobis AR, Cohen SM, Dellarco V, McGregor D, Meek ME, Vickers C, Willcocks D, Farland W. 2006. IPCS framework for analyzing the relevance of a cancer mode of action for humans. Crit Rev Toxicol. 36(10):781–792.
- Boobis AR, Doe JE, Heinrich-Hirsch B, Meek ME, Munn S, Ruchirawat M, Schlatter J, Seed J, Vickers C. 2008. IPCS framework for analyzing the relevance of a noncancer mode of action for humans. Crit Rev Toxicol. 38(2):87–96.
- Brooks RA, Gooderham NJ, Edwards RJ, Boobis AR, Winton DJ. 1999. The mutagenicity of benzo[a]pyrene in mouse small intestine. Carcinogenesis. 20(1):109–114.
- Burgos-Barragan G, Wit N, Meiser J, Dingler FA, Pietzke M, Mulderrig L, Pontel LB, Rosado IV, Brewer TF, Cordell RL, et al. 2017. Mammals divert endogenous genotoxic formaldehyde into one-carbon metabolism. Nature. 548(7669):612–612.
- Campbell JL, Jr., Gentry PR, Clewell Iii HJ, Andersen ME. 2020. A kinetic analysis of DNA-deoxy guanine adducts in the nasal epithelium produced by inhaled formaldehyde in rats-assessing contributions to adduct production from both endogenous and exogenous sources of formaldehyde. Toxicol Sci. 177(2):325–333.
- Casanova M, Heck HA. 1987. Further studies of the metabolic incorporation and covalent binding of inhaled [3H]- and [14C]formaldehyde in Fischer-344 rats: effects of glutathione depletion. Toxicol Appl Pharmacol. 89(1):105–121.
- Casanova M, Heck HD, Everitt JI, Harrington WW, Jr., Popp JA. 1988. Formaldehyde concentrations in the blood of rhesus monkeys after inhalation exposure. Food Chem Toxicol. 26(8):715–716.
- Casanova M, Deyo DF, Heck HD. 1989. Covalent binding of inhaled formaldehyde to DNA in the nasal mucosa of Fischer 344 rats: analysis of formaldehyde and DNA by high-performance liquid chromatography and provisional pharmacokinetic interpretation. Fundam Appl Toxicol. 12(3):397–417.
- Casanova M, Morgan KT, Gross EA, Moss OR, Heck HA. 1994. DNA-protein cross-links and cell replication at specific sites in the nose of F344 rats exposed subchronically to formaldehyde. Fundam Appl Toxicol. 23(4):525–536.
- Casanova M, Morgan KT, Steinhagen WH, Everitt JI, Popp JA, Heck HD. 1991. Covalent binding of inhaled formaldehyde to DNA in the respiratory tract of rhesus monkeys: pharmacokinetics, rat-to-monkey interspecies scaling, and extrapolation to man. Toxicol Sci . 17(2):409–428.
- Casanova-Schmitz M, David RM, Heck HD. 1984. Oxidation of formaldehyde and acetaldehyde by NAD+-dependent dehydrogenases in rat nasal mucosal homogenates. Biochem Pharmacol. 33(7):1137–1142.
- Casanova-Schmitz M, Heck HD. 1983. Effects of formaldehyde exposure on the extractability of DNA from proteins in the rat nasal mucosa. Toxicol Appl Pharmacol. 70(1):121–132.
- Casanova-Schmitz M, Starr TB, Heck HD. 1984. Differentiation between metabolic incorporation and covalent binding in the labeling of macromolecules in the rat nasal mucosa and bone marrow by inhaled [14C]- and [3H]formaldehyde. Toxicol Appl Pharmacol. 76(1):26–44.
- Chang JC, Barrow CS. 1984. Sensory irritation tolerance and cross-tolerance in F-344 rats exposed to chlorine or formaldehyde gas. Toxicol Appl Pharmacol. 76(2):319–327.
- Chang JC, Gross EA, Swenberg JA, Barrow CS. 1983. Nasal cavity deposition, histopathology, and cell proliferation after single or repeated formaldehyde exposures in B6C3F1 mice and F-344 rats. Toxicol Appl Pharmacol. 68(2):161–176.
- Chang JC, Steinhagen WH, Barrow CS. 1981. Effect of single or repeated formaldehyde exposure on minute volume of B6C3F1 mice and F-344 rats. Toxicol Appl Pharmacol. 61(3):451–459.
- Checkoway H, Dell LD, Boffetta P, Gallagher AE, Crawford L, Lees PS, Mundt KA. 2015. Formaldehyde exposure and mortality risks from acute myeloid leukemia and other lymphohematopoietic malignancies in the US National Cancer Institute cohort study of workers in formaldehyde industries. J Occup Environ Med. 57(7):785–794.
- Checkoway H, Lees PSJ, Dell LD, Gentry PR, Mundt KA. 2019. Peak exposures in epidemiologic studies and cancer risks: considerations for regulatory risk assessment. Risk Anal. 39(7):1441–1464.
- Chidiac P, Goldberg MT. 1987. Lack of induction of nuclear aberrations by captan in mouse duodenum. Environ Mutagen. 9(3):297–306.
- Chiu WA, Guyton KZ, Martin MT, Reif DM, Rusyn I. 2018. Use of high-throughput in vitro toxicity screening data in cancer hazard evaluations by IARC Monograph Working Groups. Altex. 35(1):51–64.
- Cohen SM, Ellwein LB. 1990. Cell proliferation in carcinogenesis. Science. 249(4972):1007–1011.
- Conolly RB, Kimbell JS, Janszen D, Schlosser PM, Kalisak D, Preston J, Miller FJ. 2003. Biologically motivated computational modeling of formaldehyde carcinogenicity in the F344 rat. Toxicol Sci. 75(2):432–447.
- Conolly RB, Kimbell JS, Janszen D, Schlosser PM, Kalisak D, Preston J, Miller FJ. 2004. Human respiratory tract cancer risks of inhaled formaldehyde: dose-response predictions derived from biologically-motivated computational modeling of a combined rodent and human dataset. Toxicol Sci. 82(1):279–296.
- CWF 1984. Report on the consensus workshop on formaldehyde. Environ Health Perspect. 58:323–381.
- Dalbey WE. 1982. Formaldehyde and tumors in hamster respiratory tract. Toxicology. 24(1):9–14.
- Dallas CE, Scott MJ, Ward JB, Jr., Theiss JC. 1992. Cytogenetic analysis of pulmonary lavage and bone marrow cells of rats after repeated formaldehyde inhalation. J Appl Toxicol. 12(3):199–203.
- Danielsson O, Jornvall H. 1992. “Enzymogenesis”: classical liver alcohol dehydrogenase origin from the glutathione-dependent formaldehyde dehydrogenase line. Proc Natl Acad Sci U S A. 89(19):9247–9251.
- Dingler FA, Wang M, Mu A, Millington CL, Oberbeck N, Watcham S, Pontel LB, Kamimae-Lanning AN, Langevin F, Nadler C, et al. 2020. Two aldehyde clearance systems are essential to prevent lethal formaldehyde accumulation in mice and humans. Mol Cell. https://doi.org/10.1016/j.molcel.2020.10.012
- Eastmond DA. 2012. Factors influencing mutagenic mode of action determinations of regulatory and advisory agencies. Mutat Res. 751(1):49–63.
- Eastmond DA, Vulimiri SV, French JE, Sonawane B. 2013. The use of genetically modified mice in cancer risk assessment: challenges and limitations. Crit Rev Toxicol. 43(8):611–631.
- Edrissi B, Taghizadeh K, Moeller BC, Kracko D, Doyle-Eisele M, Swenberg JA, Dedon PC. 2013. Dosimetry of N6-formyllysine adducts following [¹³C²H2]-formaldehyde exposures in rats. Chem Res Toxicol. 26(10):1421–1423.
- Edrissi B, Taghizadeh K, Moeller BC, Yu R, Kracko D, Doyle-Eisele M, Swenberg JA, Dedon PC. 2017. N6-formyllysine as a biomarker of formaldehyde exposure: formation and loss of N6-formyllysine in nasal epithelium in long-term, low-dose inhalation studies in rats. Chem Res Toxicol. 30(8):1572–1576.
- ECHA (European Chemical Agency) 2019. Annex XV Restriction Report. Proposal for a Restriction. Formaldehyde and Formaldehyde Releasers. European Chemicals Agency. Annankatu 18, Helsinki, Finland.
- EFSA 2006. Opinion of the scientific panel on food additives, flavourings, processing aids and materials in contact with food (AFC) on a request from the commission related to use of formaldehyde as a preservative during the manufacture and preparation of food additives: question No. EFSA-Q-2005-032. EFSA J. 415:1–10.
- EFSA 2014. Endogenous formaldehyde turnover in humans compared with exogenous contribution from food sources. EFSA J. 12:11.
- Estonius M, Svensson S, Hoog JO. 1996. Alcohol dehydrogenase in human tissues: localisation of transcripts coding for five classes of the enzyme. FEBS Lett. 397(2–3):338–342.
- Fabrikant JI, Cherry J. 1970. The kinetics of cellular proliferation in normal and malignant tissues. X. Cell proliferation in the nose and adjoining cavities. Ann Otol Rhinol Laryngol. 79(3):572–578.
- Farland WH, Lynch A, Erraguntla NK, Pottenger LH. 2019. Improving risk assessment approaches for chemicals with both endogenous and exogenous exposures. Regul Toxicol Pharmacol. 103:210–215.
- Fenech M, Nersesyan A, Knasmueller S. 2016. A systematic review of the association between occupational exposure to formaldehyde and effects on chromosomal DNA damage measured using the cytokinesis-block micronucleus assay in lymphocytes. Mutat Res. 770:46–57.
- Fernandez MR, Biosca JA, Pares X. 2003. S-nitrosoglutathione reductase activity of human and yeast glutathione-dependent formaldehyde dehydrogenase and its nuclear and cytoplasmic localisation. Cell Mol Life Sci. 60(5):1013–1018.
- Feron VJ, Arts JH, Kuper CF, Slootweg PJ, Woutersen RA. 2001. Health risks associated with inhaled nasal toxicants. Crit Rev Toxicol. 31(3):313–347.
- Fielden J, Ruggiano A, Popovic M, Ramadan K. 2018. DNA protein crosslink proteolysis repair: From yeast to premature ageing and cancer in humans. DNA Repair (Amst). 71:198–204.
- Fontignie-Houbrechts N. 1981. Genetic effects of formaldehyde in the mouse. Mutat Res. 88(1):109–114.
- Foster MW, Hess DT, Stamler JS. 2009. Protein S-nitrosylation in health and disease: a current perspective. Trends Mol Med. 15(9):391–404.
- Gentry R, Thompson C, Franzen A, Salley J, Albertini R, Lu K, Greene T. 2021. Using mechanistic information to support evidence integration and synthesis: a case study with inhaled formaldehyde and leukemia. Crit Rev Toxicol. https://doi.org/10.1080/10408444.2020.1854678
- Gocke E, King MT, Eckhardt K, Wild D. 1981. Mutagenicity of cosmetics ingredients licensed by the European Communities. Mutat Res. 90(2):91–109.
- Golden R, Bus J, Calabrese E. 2019. An examination of the linear no-threshold hypothesis of cancer risk assessment: Introduction to a series of reviews documenting the lack of biological plausibility of LNT. Chem Biol Interact. 301:2–5.
- Gordon CJ, Spencer PJ, Hotchkiss J, Miller DB, Hinderliter PM, Pauluhn J. 2008. Thermoregulation and its influence on toxicity assessment. Toxicology. 244(2–3):87–97.
- Grafstrom RC, Curren RD, Yang LL, Harris CC. 1985. Genotoxicity of formaldehyde in cultured human bronchial fibroblasts. Science. 228(4695):89–91.
- Green LS, Chun LE, Patton AK, Sun X, Rosenthal GJ, Richards JP. 2012. Mechanism of inhibition for N6022, a first-in-class drug targeting S-nitrosoglutathione reductase. Biochemistry. 51(10):2157–2168.
- Greenfield RE, Ellwein LB, Cohen SM. 1984. A general probabilistic model of carcinogenesis: analysis of experimental urinary bladder cancer. Carcinogenesis. 5(4):437–445.
- Gross EA, Swenberg JA, Fields S, Popp JA. 1982. Comparative morphometry of the nasal cavity in rats and mice. J Anat. 135(Pt 1):83–88.
- Harkema JR, Carey SA, Wagner JG. 2006. The nose revisited: a brief review of the comparative structure, function, and toxicologic pathology of the nasal epithelium. Toxicol Pathol. 34(3):252–269.
- Hauptmann M, Lubin JH, Stewart PA, Hayes RB, Blair A. 2003. Mortality from lymphohematopoietic malignancies among workers in formaldehyde industries. J Natl Cancer Inst. 95(21):1615–1623.
- Hauptmann M, Lubin JH, Stewart PA, Hayes RB, Blair A. 2004. Mortality from solid cancers among workers in formaldehyde industries. Am J Epidemiol. 159(12):1117–1130.
- Heck H, Casanova M. 2004. The implausibility of leukemia induction by formaldehyde: a critical review of the biological evidence on distant-site toxicity. Regul Toxicol Pharmacol. 40(2):92–106.
- Heck HD, Casanova-Schmitz M, Dodd PB, Schachter EN, Witek TJ, Tosun T. 1985. Formaldehyde (CH2O) concentrations in the blood of humans and Fischer-344 rats exposed to CH2O under controlled conditions. Am Ind Hyg Assoc J. 46(1):1–3.
- Heck HD, White EL, Casanova-Schmitz M. 1982. Determination of formaldehyde in biological tissues by gas chromatography/mass spectrometry. Biomed Mass Spectrom. 9(8):347–353.
- Hedberg JJ, Hoog JO, Nilsson JA, Xi Z, Elfwing A, Grafstrom RC. 2000. Expression of alcohol dehydrogenase 3 in tissue and cultured cells from human oral mucosa. Am J Pathol. 157(5):1745–1755.
- Hess DT, Matsumoto A, Kim SO, Marshall HE, Stamler JS. 2005. Protein S-nitrosylation: purview and parameters. Nat Rev Mol Cell Biol. 6(2):150–166.
- Hill AB. 1965. The environment and disease: association or causation? Proc R Soc Med. 58:295–300.
- Holmstrom M, Wilhelmsson B, Hellquist H, Rosen G. 1989. Histological changes in the nasal mucosa in persons occupationally exposed to formaldehyde alone and in combination with wood dust. Acta Otolaryngol. 107(1-2):120–129.
- Horton AW, Tye R, Stemmer KL. 1963. Experimental carcinogenesis of the lung. Inhalation of gaseous formaldehyde or an aerosol of coal tar by C3H mice. J Natl Cancer Inst. 30:31–43.
- IARC 1995. Wood dust and formaldehyde. IARC monographs on the evaluation of carcinogenic risks to humans 62. Lyon (France): IARC.
- IARC 2006. Formaldehyde, 2-butoxyethanol and 1-tert-butoxypropan-2-ol. IARC monographs on the evaluation of carcinogenic risks to humans 88. Lyon (France): IARC.
- Iborra FJ, Renau-Piqueras J, Portoles M, Boleda MD, Guerri C, Pares X. 1992. Immunocytochemical and biochemical demonstration of formaldhyde dehydrogenase (class III alcohol dehydrogenase) in the nucleus. J Histochem Cytochem. 40(12):1865–1878.
- Jensen DE, Belka GK, Du Bois GC. 1998. S-Nitrosoglutathione is a substrate for rat alcohol dehydrogenase class III isoenzyme. Biochem J. 331(Pt 2):659–668.
- Kamata E, Nakadate M, Uchida O, Ogawa Y, Suzuki S, Kaneko T, Saito M, Kurokawa Y. 1997. Results of a 28-month chronic inhalation toxicity study of formaldehyde in male Fisher-344 rats. J Toxicol Sci. 22(3):239–254.
- Keller DA, Heck HD, Randall HW, Morgan KT. 1990. Histochemical localization of formaldehyde dehydrogenase in the rat. Toxicol Appl Pharmacol. 106(2):311–326.
- Kepler GM, Richardson RB, Morgan KT, Kimbell JS. 1998. Computer simulation of inspiratory nasal airflow and inhaled gas uptake in a rhesus monkey. Toxicol Appl Pharmacol. 150(1):1–11.
- Kerns WD, Pavkov KL, Donofrio DJ, Gralla EJ, Swenberg JA. 1983. Carcinogenicity of formaldehyde in rats and mice after long-term inhalation exposure. Cancer Res. 43(9):4382–4392.
- Kimbell JS, Godo MN, Gross EA, Joyner DR, Richardson RB, Morgan KT. 1997. Computer simulation of inspiratory airflow in all regions of the F344 rat nasal passages. Toxicol Appl Pharmacol. 145(2):388–398.
- Kimbell JS, Gross EA, Joyner DR, Godo MN, Morgan KT. 1993. Application of computational fluid dynamics to regional dosimetry of inhaled chemicals in the upper respiratory tract of the rat. Toxicol Appl Pharmacol. 121(2):253–263.
- Kimbell JS, Gross EA, Richardson RB, Conolly RB, Morgan KT. 1997. Correlation of regional formaldehyde flux predictions with the distribution of formaldehyde-induced squamous metaplasia in F344 rat nasal passages. Mutat Res. 380(1–2):143–154.
- Kimbell JS, Subramaniam RP, Gross EA, Schlosser PM, Morgan KT. 2001. Dosimetry modeling of inhaled formaldehyde: comparisons of local flux predictions in the rat, monkey, and human nasal passages. Toxicol Sci. 64(1):100–110.
- Kleinnijenhuis AJ, Staal YC, Duistermaat E, Engel R, Woutersen RA. 2013. The determination of exogenous formaldehyde in blood of rats during and after inhalation exposure. Food Chem Toxicol. 52:105–112.
- Kligerman AD, Phelps MC, Erexson GL. 1984. Cytogenetic analysis of lymphocytes from rats following formaldehyde inhalation. Toxicol Lett. 21(3):241–246.
- Koivusalo M, Baumann M, Uotila L. 1989. Evidence for the identity of glutathione-dependent formaldehyde dehydrogenase and class III alcohol dehydrogenase. FEBS Lett. 257(1):105–109.
- Lai Y, Yu R, Hartwell HJ, Moeller BC, Bodnar WM, Swenberg JA. 2016. Measurement of endogenous versus exogenous formaldehyde-induced DNA-protein crosslinks in animal tissues by stable isotope labeling and ultrasensitive mass spectrometry. Cancer Res. 76(9):2652–2661.
- Lambert IB, Singer TM, Boucher SE, Douglas GR. 2005. Detailed review of transgenic rodent mutation assays. Mutat Res. 590(1–3):1–280.
- Leng J, Liu CW, Hartwell HJ, Yu R, Lai Y, Bodnar WM, Lu K, Swenberg JA. 2019. Evaluation of inhaled low-dose formaldehyde-induced DNA adducts and DNA-protein cross-links by liquid chromatography-tandem mass spectrometry. Arch Toxicol. 93(3):763–773.
- Leung J, Wei W, Liu L. 2013. S-nitrosoglutathione reductase deficiency increases mutagenesis from alkylation in mouse liver. Carcinogenesis. 34(5):984–989.
- Liu L, Hausladen A, Zeng M, Que L, Heitman J, Stamler JS. 2001. A metabolic enzyme for S-nitrosothiol conserved from bacteria to humans. Nature. 410(6827):490–494.
- Liu Y, Yu D, Xiao S. 2017. Effects of chronic exposure to Formaldehyde on micronucleus rate of bone marrow cells in male mice. J Pak Med Assoc. 67:933–935.
- Lu K, Craft S, Nakamura J, Moeller BC, Swenberg JA. 2012. Use of LC-MS/MS and stable isotopes to differentiate hydroxymethyl and methyl DNA adducts from formaldehyde and nitrosodimethylamine. Chem Res Toxicol. 25(3):664–675.
- Lu K, Collins LB, Ru H, Bermudez E, Swenberg JA. 2010. Distribution of DNA adducts caused by inhaled formaldehyde is consistent with induction of nasal carcinoma but not leukemia. Toxicol Sci. 116(2):441–451.
- Lu K, Moeller B, Doyle-Eisele M, McDonald J, Swenberg JA. 2011. Molecular dosimetry of N2-hydroxymethyl-dG DNA adducts in rats exposed to formaldehyde. Chem Res Toxicol. 24(2):159–161.
- Lu K, Ye W, Zhou L, Collins LB, Chen X, Gold A, Ball LM, Swenberg JA. 2010. Structural characterization of formaldehyde-induced cross-links between amino acids and deoxynucleosides and their oligomers. J Am Chem Soc. 132(10):3388–3399.
- MacGregor JT, Frotschl R, White PA, Crump KS, Eastmond DA, Fukushima S, Guerard M, Hayashi M, Soeteman-Hernandez LG, Johnson GE, et al. 2015. IWGT report on quantitative approaches to genotoxicity risk assessment II. Use of point-of-departure (PoD) metrics in defining acceptable exposure limits and assessing human risk. Mutat Res Genet Toxicol Environ Mutagen. 783:66–78.
- Malarkey DE, Bucher JR. 2011. Summary report of the National Toxicology Program and Environmental Protection Agency-sponsored review of pathology materials from selected Ramazzini Institute rodent cancer bioassays. Technical Report. Research Triangle Park (NC): National Toxicology Program.
- Marsh GM, Youk AO. 2005. Reevaluation of mortality risks from nasopharyngeal cancer in the formaldehyde cohort study of the National Cancer Institute. Regul Toxicol Pharmacol. 42(3):275–283.
- Marsh GM, Youk AO, Morfeld P, Collins JJ, Symons JM. 2010. Incomplete follow-up in the National Cancer Institute’s formaldehyde worker study and the impact on subsequent reanalyses and causal evaluations. Regul Toxicol Pharmacol. 58(2):233–236.
- McGregor D, Bolt H, Cogliano V, Richter-Reichhelm HB. 2006. Formaldehyde and glutaraldehyde and nasal cytotoxicity: case study within the context of the 2006 IPCS Human Framework for the Analysis of a cancer mode of action for humans. Crit Rev Toxicol. 36(10):821–835.
- Meek ME, Bucher JR, Cohen SM, Dellarco V, Hill RN, Lehman-McKeeman LD, Longfellow DG, Pastoor T, Seed J, Patton DE. 2003. A framework for human relevance analysis of information on carcinogenic modes of action. Crit Rev Toxicol. 33(6):591–653.
- Meek ME, Boobis A, Cote I, Dellarco V, Fotakis G, Munn S, Seed J, Vickers C. 2014. New developments in the evolution and application of the WHO/IPCS framework on mode of action/species concordance analysis. J Appl Toxicol. 34(1):1–18.
- Meek ME, Palermo CM, Bachman AN, North CM, Jeffrey Lewis R. 2014. Mode of action human relevance (species concordance) framework: evolution of the Bradford Hill considerations and comparative analysis of weight of evidence. J Appl Toxicol. 34(6):595–606.
- Meng F, Bermudez E, McKinzie PB, Andersen ME, Clewell HJ, Parsons BL. 2010. Measurement of tumor-associated mutations in the nasal mucosa of rats exposed to varying doses of formaldehyde. Regul Toxicol Pharmacol. 57(2–3):274–283.
- Merk O, Speit G. 1998. Significance of formaldehyde-induced DNA-protein crosslinks for mutagenesis. Environ Mol Mutagen. 32(3):260–268.
- Migliore L, Ventura L, Barale R, Loprieno N, Castellino S, Pulci R. 1989. Micronuclei and nuclear anomalies induced in the gastro-intestinal epithelium of rats treated with formaldehyde. Mutagenesis. 4(5):327–334.
- Miller FJ, Conolly RB, Kimbell JS. 2017. An updated analysis of respiratory tract cells at risk for formaldehyde carcinogenesis. Inhal Toxicol. 29(12–14):586–597.
- Miller RA, Cesta MF. NTP nonneoplastic lesion atlas: nose, epithelium - metaplasia, squamous. In: Cesta MF, Herbert RA, Brix A, Malarkey DE, Sills RC, editors. National toxicology program nonneoplastic lesion atlas. https://ntp.niehs.nih.gov/nnl/respiratory/nose/epmetasq/index.htm
- Moeller BC, Lu K, Doyle-Eisele M, McDonald J, Gigliotti A, Swenberg JA. 2011. Determination of N2-hydroxymethyl-dG adducts in the nasal epithelium and bone marrow of nonhuman primates following 13CD2-formaldehyde inhalation exposure. Chem Res Toxicol. 24(2):162–164.
- Mohner M, Liu Y, Marsh GM. 2019. New insights into the mortality risk from nasopharyngeal cancer in the national cancer institute formaldehyde worker cohort study. J Occup Med Toxicol. 14:4.
- Monticello TM, Miller FJ, Morgan KT. 1991. Regional increases in rat nasal epithelial cell proliferation following acute and subchronic inhalation of formaldehyde. Toxicol Appl Pharmacol. 111(3):409–421.
- Monticello TM, Morgan KT, Everitt JI, Popp JA. 1989. Effects of formaldehyde gas on the respiratory tract of rhesus monkeys. Pathology and cell proliferation. Am J Pathol. 134(3):515–527.
- Monticello TM, Swenberg JA, Gross EA, Leininger JR, Kimbell JS, Seilkop S, Starr TB, Gibson JE, Morgan KT. 1996. Correlation of regional and nonlinear formaldehyde-induced nasal cancer with proliferating populations of cells. Cancer Res. 56:1012–1022.
- Moolgavkar SH, Dewanji A, Venzon DJ. 1988. A stochastic two-stage model for cancer risk assessment. I. The hazard function and the probability of tumor. Risk Anal. 8(3):383–392.
- Moolgavkar SH, Knudson AG. Jr. 1981. Mutation and cancer: a model for human carcinogenesis. J Natl Cancer Inst. 66(6):1037–1052.
- Morgan DL, Dixon D, King DH, Travlos GS, Herbert RA, French JE, Tokar EJ, Waalkes MP, Jokinen MP. 2017. NTP research report on absence of formaldehyde-induced neoplasia in Trp53 haploinsufficient mice exposed by inhalation. Natl Toxicol Program. 3:1–30.
- Morgan KT. 1997. A brief review of formaldehyde carcinogenesis in relation to rat nasal pathology and human health risk assessment. Toxicol Pathol. 25(3):291–307.
- Morgan KT, Jiang XZ, Starr TB, Kerns WD. 1986. More precise localization of nasal tumors associated with chronic exposure of F-344 rats to formaldehyde gas. Toxicol Appl Pharmacol. 82(2):264–271.
- Morgan KT, Kimbell JS, Monticello TM, Patra AL, Fleishman A. 1991. Studies of inspiratory airflow patterns in the nasal passages of the F344 rat and rhesus monkey using nasal molds: relevance to formaldehyde toxicity. Toxicol Appl Pharmacol. 110(2):223–240.
- Morgan KT, Monticello TM. 1990. Formaldehyde toxicity: respiratory epithelial injury and repair. In: Thomassen DG, Nettesheim P, editors. Biology, toxicology, and carcinogenesis of the respiratory epithelium. Washington (DC): Hemisphere Publishing Corporation.
- NAS 2011. Review of the Environmental Protection Agency’s draft IRIS assessment of formaldehyde. Washington (DC): U.S. Environmental Protection Agency.
- Natarajan AT, Darroudi F, Bussman CJ, van Kesteren-van Leeuwen AC. 1983. Evaluation of the mutagenicity of formaldehyde in mammalian cytogenetic assays in vivo and vitro. Mutat Res. 122(3–4):355–360.
- Neuss S, Zeller J, Ma-Hock L, Speit G. 2010. Inhalation of formaldehyde does not induce genotoxic effects in broncho-alveolar lavage (BAL) cells of rats. Mutat Res. 695(1–2):61–68.
- NTP 2013. NTP Technical Report on the toxicology studies of tetrabromobisphenol A (CAS no. 79-94-7) in F344/NTac rats and B6C3F1/N mice and toxicology and carcinogenesis studies of tetrabromobisphenol A in Wistar Han [Crl:Wi(Han)] rats and B6C3F1/N mice. NIH Publication no. 14–5929.
- NTP 2014. Toxicology Studies of Cobalt Metal (CAS No. 7440-48-4) in F344/N Rats and B6C3F1/N Mice and Toxicology and Carcinogenesis Studies of Cobalt Metal (CAS No. 7440-48-4) in F344/N Rats and B6C3F1/N Mice (Inhalation Studies). NIH Publication No. 01-4433.
- O’Brien TJ, Ding H, Suh M, Thompson CM, Parsons BL, Harris MA, Winkelman WA, Wolf JC, Hixon JG, Schwartz AM, et al. 2013. Assessment of K-Ras mutant frequency and micronucleus incidence in the mouse duodenum following 90-days of exposure to Cr(VI) in drinking water. Mutat Res. 754(1–2):15–21.
- OECD 2013. Guideline for testing of chemicals. 2013. Test guideline 488, - transgenic rodent somatic and germ cell gene mutation assays, adopted July 28. Paris, France: OECD.
- Pauluhn J. 2003. Issues of dosimetry in inhalation toxicity. Toxicol Lett. 140–141:229–238.
- Pavkov KL, Kerns WD, Mitchell RI, Connell MM, Donofrio DJ, Harroff HH. 1982. A chronic inhalation toxicology study in rats and mice exposed to formaldehyde. In: Chemical industry institute of toxicology final report. Columbus (OH): Battelle, Columbus Laboratories.
- Pegg AE. 2011. Multifaceted roles of alkyltransferase and related proteins in DNA repair, DNA damage, resistance to chemotherapy, and research tools. Chem Res Toxicol. 24(5):618–639.
- Pogribny IP, Rusyn I, Beland FA. 2008. Epigenetic aspects of genotoxic and non-genotoxic hepatocarcinogenesis: studies in rodents. Environ Mol Mutagen. 49(1):9–15.
- Pontel LB, Rosado IV, Burgos-Barragan G, Garaycoechea JI, Yu R, Arends MJ, Chandrasekaran G, Broecker V, Wei W, Liu L, et al. 2015. Endogenous formaldehyde is a hematopoietic stem cell genotoxin and metabolic carcinogen. Mol Cell. 60(1):177–188.
- Pottenger LH, Boysen G, Brown K, Cadet J, Fuchs RP, Johnson GE, Swenberg JA. 2019. Understanding the importance of low-molecular weight (ethylene oxide- and propylene oxide-induced) DNA adducts and mutations in risk assessment: Insights from 15 years of research and collaborative discussions. Environ Mol Mutagen. 60(2):100–121.
- Preston RJ, Williams GM. 2005. DNA-reactive carcinogens: mode of action and human cancer hazard. Crit Rev Toxicol. 35(8–9):673–683.
- Que LG, Liu L, Yan Y, Whitehead GS, Gavett SH, Schwartz DA, Stamler JS. 2005. Protection from experimental asthma by an endogenous bronchodilator. Science. 308(5728):1618–1621.
- Rager JE, Moeller BC, Miller SK, Kracko D, Doyle-Eisele M, Swenberg JA, Fry RC. 2014. Formaldehyde-associated changes in microRNAs: tissue and temporal specificity in the rat nose, white blood cells, and bone marrow. Toxicol Sci. 138(1):36–46.
- Recio L, Sisk S, Pluta L, Bermudez E, Gross EA, Chen Z, Morgan K, Walker C. 1992. p53 mutations in formaldehyde-induced nasal squamous cell carcinomas in rats. Cancer Res. 52(21):6113–6116.
- Renne R, Brix A, Harkema J, Herbert R, Kittel B, Lewis D, March T, Nagano K, Pino M, Rittinghausen S, et al. 2009. Proliferative and nonproliferative lesions of the rat and mouse respiratory tract. Toxicol Pathol. 37(7 Suppl):5S–73S.
- Rhomberg LR, Bailey LA, Goodman JE, Hamade AK, Mayfield D. 2011. Is exposure to formaldehyde in air causally associated with leukemia?-A hypothesis-based weight-of-evidence analysis. Crit Rev Toxicol. 41(7):555–621.
- Rusch GM, Clary JJ, Rinehart WE, Bolte HF. 1983. A 26-week inhalation toxicity study with formaldehyde in the monkey, rat, and hamster. Toxicol Appl Pharmacol. 68(3):329–343.
- Salk JJ, Schmitt MW, Loeb LA. 2018. Enhancing the accuracy of next-generation sequencing for detecting rare and subclonal mutations. Nat Rev Genet. 19(5):269–285.
- Salthammer T. 2013. Formaldehyde in the ambient atmosphere: from an indoor pollutant to an outdoor pollutant? Angew Chem Int Ed Engl. 52(12):3320–3327.
- Salthammer T, Mentese S, Marutzky R. 2010. Formaldehyde in the indoor environment. Chem Rev. 110(4):2536–2572.
- Schlosser PM, Lilly PD, Conolly RB, Janszen DB, Kimbell JS. 2003. Benchmark dose risk assessment for formaldehyde using airflow modeling and a single-compartment, DNA-protein cross-link dosimetry model to estimate human equivalent doses. Risk Anal. 23(3):473–487.
- Schroeter JD, Campbell J, Kimbell JS, Conolly RB, Clewell HJ, Andersen ME. 2014. Effects of endogenous formaldehyde in nasal tissues on inhaled formaldehyde dosimetry predictions in the rat, monkey, and human nasal passages. Toxicol Sci. 138(2):412–424.
- Sellakumar AR, Snyder CA, Solomon JJ, Albert RE. 1985. Carcinogenicity of formaldehyde and hydrogen chloride in rats. Toxicol Appl Pharmacol. 81(3 Pt 1):401–406.
- Soffritti M, Belpoggi F, Lambertin L, Lauriola M, Padovani M, Maltoni C. 2002. Results of long-term experimental studies on the carcinogenicity of formaldehyde and acetaldehyde in rats. Ann N Y Acad Sci. 982:87–105.
- Soffritti M, Maltoni C, Maffei F, Biagi R. 1989. Formaldehyde: an experimental multipotential carcinogen. Toxicol Ind Health. 5(5):699–730.
- Sonich-Mullin C, Fielder R, Wiltse J, Baetcke K, Dempsey J, Fenner-Crisp P, Grant D, Hartley M, Knaap A, Kroese D, et al. 2001. IPCS conceptual framework for evaluating a mode of action for chemical carcinogenesis. Regul Toxicol Pharmacol. 34(2):146–152.
- Speit G, Kuhner S, Linsenmeyer R, Schutz P. 2011. Does formaldehyde induce aneuploidy? Mutagenesis. 26(6):805–811.
- Speit G, Merk O. 2002. Evaluation of mutagenic effects of formaldehyde in vitro: detection of crosslinks and mutations in mouse lymphoma cells. Mutagenesis. 17(3):183–187.
- Speit G, Schutz P, Weber I, Ma-Hock L, Kaufmann W, Gelbke HP, Durrer S. 2011. Analysis of micronuclei, histopathological changes and cell proliferation in nasal epithelium cells of rats after exposure to formaldehyde by inhalation. Mutat Res. 721(2):127–135.
- Speit G, Schmid O, Frohler-Keller M, Lang I, Triebig G. 2007. Assessment of local genotoxic effects of formaldehyde in humans measured by the micronucleus test with exfoliated buccal mucosa cells. Mutat Res. 627(2):129–135.
- Speit G, Zeller J, Schmid O, Elhajouji A, Ma-Hock L, Neuss S. 2009. Inhalation of formaldehyde does not induce systemic genotoxic effects in rats. Mutat Res. 677(1–2):76–85.
- Staab CA, Alander J, Brandt M, Lengqvist J, Morgenstern R, Grafstrom RC, Hoog JO. 2008. Reduction of S-nitrosoglutathione by alcohol dehydrogenase 3 is facilitated by substrate alcohols via direct cofactor recycling and leads to GSH-controlled formation of glutathione transferase inhibitors. Biochem J. 413(3):493–504.
- Staab CA, Hellgren M, Hoog JO. 2008. Medium- and short-chain dehydrogenase/reductase gene and protein families : dual functions of alcohol dehydrogenase 3: implications with focus on formaldehyde dehydrogenase and S-nitrosoglutathione reductase activities. Cell Mol Life Sci. 65(24):3950–3960.
- Stingele J, Bellelli R, Alte F, Hewitt G, Sarek G, Maslen SL, Tsutakawa SE, Borg A, Kjaer S, Tainer JA, et al. 2016. Mechanism and regulation of DNA-protein crosslink repair by the DNA-dependent metalloprotease SPRTN. Mol Cell. 64(4):688–703.
- Stingele J, Jentsch S. 2015. DNA-protein crosslink repair. Nat Rev Mol Cell Biol. 16(8):455–460.
- Subramaniam RP, Richardson RB, Morgan KT, Kimbell JS, Guilmette RA. 1998. Computational fluid dynamics simulations of inspiratory airflow in the human nose and nasopharynx. Inhal Toxicol. 10(2):91–120.
- Swenberg JA, Kerns WD, Mitchell RI, Gralla EJ, Pavkov KL. 1980. Induction of squamous cell carcinomas of the rat nasal cavity by inhalation exposure to formaldehyde vapor. Cancer Res. 40(9):3398–3402.
- Swenberg JA, Moeller BC, Lu K, Rager JE, Fry RC, Starr TB. 2013. Formaldehyde carcinogenicity research: 30 years and counting for mode of action, epidemiology, and cancer risk assessment. Toxicol Pathol. 41(2):181–189.
- Takahashi M, Hasegawa R, Furukawa F, Toyoda K, Sato H, Hayashi Y. 1986. Effects of ethanol, potassium metabisulfite, formaldehyde and hydrogen peroxide on gastric carcinogenesis in rats after initiation with N-methyl-N'-nitro-N-nitrosoguanidine. Jpn J Cancer Res. 77(2):118–124.
- Tan YM, Leonard JA, Edwards S, Teeguarden J, Egeghy P. 2018. Refining the aggregate exposure pathway. Environ Sci Process Impacts. 20(3):428–436.
- Tang CH, Wei W, Hanes MA, Liu L. 2013. Hepatocarcinogenesis driven by GSNOR deficiency is prevented by iNOS inhibition. Cancer Res. 73(9):2897–2904.
- Teng S, Beard K, Pourahmad J, Moridani M, Easson E, Poon R, O'Brien PJ. 2001. The formaldehyde metabolic detoxification enzyme systems and molecular cytotoxic mechanism in isolated rat hepatocytes. Chem Biol Interact. 130–132(1–3):285–296.
- Thomas RS, Allen BC, Nong A, Yang L, Bermudez E, Clewell HJ, Andersen ME. 2007. A method to integrate benchmark dose estimates with genomic data to assess the functional effects of chemical exposure. Toxicol Sci. 98(1):240–248.
- Thompson CM. 2018. Commentary on new formaldehyde studies in Trp53 haploinsufficient mice: further support for nonlinear risks from inhaled formaldehyde. Dose Response. 16(2):1559325818777931.
- Thompson CM, Seiter J, Chappell MA, Tappero RV, Proctor DM, Suh M, Wolf JC, Haws LC, Vitale R, Mittal L, et al. 2015. Synchrotron-based imaging of chromium and γ-H2AX immunostaining in the duodenum following repeated exposure to Cr(VI) in drinking water . Toxicol Sci. 143(1):16–25.
- Thompson CM, Sonawane B, Grafstrom RC. 2009. The ontogeny, distribution, and regulation of alcohol dehydrogenase 3: implications for pulmonary physiology. Drug Metab Dispos. 37(8):1565–1571.
- Thompson CM, Wolf JC, Elbekai RH, Paranjpe MG, Seiter JM, Chappell MA, Tappero RV, Suh M, Proctor DM, Bichteler A, et al. 2015. Duodenal crypt health following exposure to Cr(VI): Micronucleus scoring, γ-H2AX immunostaining, and synchrotron X-ray fluorescence microscopy . Mutat Res Genet Toxicol Environ Mutagen. 789–790:61–66.
- Thompson CM, Young RR, Dinesdurage H, Suh M, Harris MA, Rohr AC, Proctor DM. 2017. Assessment of the mutagenic potential of hexavalent chromium in the duodenum of big blue® rats. Toxicol Appl Pharmacol. 330:48–52.
- Tibbetts AS, Appling DR. 2010. Compartmentalization of Mammalian folate-mediated one-carbon metabolism. Annu Rev Nutr. 30:57–81.
- Til HP, Woutersen RA, Feron VJ, Hollanders VH, Falke HE, Clary JJ. 1989. Two-year drinking-water study of formaldehyde in rats. Food Chem Toxicol. 27(2):77–87.
- Tobe M, Naito K, Kurokawa Y. 1989. Chronic toxicity study on formaldehyde administered orally to rats. Toxicology. 56:79–86.
- Tomasetti C, Vogelstein B. 2015. Cancer etiology. Variation in cancer risk among tissues can be explained by the number of stem cell divisions. Science. 347(6217):78–81.
- Tweats DJ, Blakey D, Heflich RH, Jacobs A, Jacobsen SD, Morita T, Nohmi T, O'Donovan MR, Sasaki YF, Sofuni T, et al. 2007. Report of the IWGT working group on strategies and interpretation of regulatory in vivo tests I. Increases in micronucleated bone marrow cells in rodents that do not indicate genotoxic hazards. Mutat Res. 627(1):78–91.
- U.S. EPA 2005. Guidelines for carcinogen risk assessment, EPA/630/P-03/001F. Risk assessment forum. Washington (DC): U.S. Environmental Protection Agency.
- U.S. EPA 2007. Framework for determining a mutagenic mode of action for carcinogenicity: using EPA’s 2005 cancer guidelines and supplemental guidance for assessing susceptibility from early-life exposure to carcinogens. Washinton (DC): U.S. Environmental Protection Agency.
- U.S. EPA 2010. Toxicological review of formaldehyde-inhalation assessment EPA/635/R-10/002A. Washington (DC): U.S. Environmental Protection Agency.
- U.S. EPA 2017. Guidance to assist interested persons in developing and submitting draft risk evaluations under the toxic substances control act. EPA 740‐R17‐001. Washinton (DC): U.S. Environmental Protection Agency, Office of Chemical Safety and Pollution Prevention.
- U.S. EPA 2018. Application of systematic review in TSCA risk evaluations. EPA 740‐P1-8001. Washinton (DC): U.S. Environmental Protection Agency, Office of Chemical Safety and Pollution Prevention.
- U.S. EPA 2019. Proposed designation of formaldehyde (CASRN 50-00-0) as high-priority substance for risk evaluation. Washinton (DC): U.S. Environmental Protection Agency, Office of Chemical Safety and Pollution Prevention
- Uotila L, Koivusalo M. 1974. Formaldehyde dehydrogenase from human liver. Purification, properties, and evidence for the formation of glutathione thiol esters by the enzyme. J Biol Chem. 249(23):7653–7663.
- Vaz B, Popovic M, Newman JA, Fielden J, Aitkenhead H, Halder S, Singh AN, Vendrell I, Fischer R, Torrecilla I, et al. 2016. Metalloprotease SPRTN/DVC1 orchestrates replication-coupled DNA-protein crosslink repair. Mol Cell. 64(4):704–719.
- Walport LJ, Hopkinson RJ, Chowdhury R, Schiller R, Ge W, Kawamura A, Schofield CJ. 2016. Arginine demethylation is catalysed by a subset of JmjC histone lysine demethylases. Nat Commun. 7:11974.
- Wei W, Li B, Hanes MA, Kakar S, Chen X, Liu L. 2010. S-nitrosylation from GSNOR deficiency impairs DNA repair and promotes hepatocarcinogenesis. Sci Transl Med. 2(19):19ra13
- WHO 2010. WHO guidelines for indoor air quality: selected pollutants. Geneva: WHO.
- Wood CE, Hukkanen RR, Sura R, Jacobson-Kram D, Nolte T, Odin M, Cohen SM. 2015. Scientific and Regulatory Policy Committee (SRPC) review: interpretation and use of cell proliferation data in cancer risk assessment. Toxicol Pathol. 43(6):760–775.
- Woutersen RA, Kuper CF, Slootweg PJ. 2010. Chronic tissue changes and carcinogenesis in the upper airway. Morris JB, Shusterman DJ, editors. New York (NY): Informa Healthcare.
- Woutersen RA, van Garderen-Hoetmer A, Bruijntjes JP, Zwart A, Feron VJ. 1989. Nasal tumours in rats after severe injury to the nasal mucosa and prolonged exposure to 10 ppm formaldehyde. J Appl Toxicol. 9(1):39–46.
- Young R, Dinesdurage H. 2016. Qualification of upper respiratory tract tissues for inhalation exposure of transgenic Big Blue® mice. In 55th Annual Meeting of the Society of Toxicology, New Orleans (LO).
- Yu G, Chen Q, Liu X, Guo C, Du H, Sun Z. 2014. Formaldehyde induces bone marrow toxicity in mice by inhibiting peroxiredoxin 2 expression. Mol Med Rep. 10(4):1915–1920.
- Yu GY, Song XF, Zhao SH, Liu Y, Sun ZW. 2015. Formaldehyde induces the bone marrow toxicity in mice by regulating the expression of Prx3 protein. J Huazhong Univ Sci Technolog Med Sci. 35(1):82–86.
- Yu R, Lai Y, Hartwell HJ, Moeller BC, Doyle-Eisele M, Kracko D, Bodnar WM, Starr TB, Swenberg JA. 2015. Formation, Accumulation, and Hydrolysis of Endogenous and Exogenous Formaldehyde-Induced DNA Damage. Toxicol Sci. 146(1):170–182.
- Zeller J, Neuss S, Mueller JU, Kuhner S, Holzmann K, Hogel J, Klingmann C, Bruckner T, Triebig G, Speit G. 2011. Assessment of genotoxic effects and changes in gene expression in humans exposed to formaldehyde by inhalation under controlled conditions. Mutagenesis. 26(4):555–561.