
Abstract
Amyloidosis is a disease caused by pathological fibril aggregation and deposition of proteins in different tissues and organs. Thirty-six fibril-forming proteins have been identified. So far, proteomic evaluation of amyloid focused on the detection and characterization of fibril proteins mainly for diagnostic purposes or to find novel fibril-forming proteins. However, amyloid deposits are a complex mixture of constituents that show organ-, tissue-, and amyloid-type specific patterns, that is the amyloid proteome. We carried out a comprehensive literature review on publications investigating amyloid via liquid chromatography coupled to tandem mass spectrometry, including but not limited to sample preparation by laser microdissection. Our review confirms the complexity and dynamics of the amyloid proteome, which can be divided into four functional categories: amyloid proteome-category 1 (APC1) includes exclusively fibrillary proteins found in the patient; APC2 includes potential fibril-forming proteins found in other types of amyloid; and APC3 and APC4 summarizes non-fibril proteins–some being amyloid signature proteins. Our categorization may help to systemically explore the nature and role of the amyloid proteome in the manifestation, progression, and clearance of disease. Further exploration of the amyloid proteome may form the basis for the development of novel diagnostic tools, thereby enabling the development of novel therapeutic targets.
Introduction
Amyloidosis is a disease characterized by the pathological aggregation and deposition of proteins and peptides that target various tissues and organs (Merlini and Bellotti Citation2003). Currently, 36 proteins and peptides have been identified, which are able to form amyloid and some of which can cause devastating diseases (Benson et al. Citation2020). Accurate diagnosis and classification are of paramount importance. While amyloid treatment has been greatly improved, patient management relies on the correct classification of the amyloid type (Merlini and Bellotti Citation2003). Diagnosing amyloid is reached by examining a tissue specimen using Congo red staining and polarization microscopy; subsequently, the amyloid deposit shows a typical and highly specific yellow-orange-green birefringence (Puchtler et al. Citation1962). Identification of the amyloid fibril protein is necessary as patient prognosis and management depend on the nature of the amyloid protein, the underlying and resulting disease, e.g. hereditary or acquired, localized or systemic (Merlini et al. Citation2011).
Amyloidosis is a conformation-dependent disease, that is, an autologous, physiological protein undergoes a conformational change, which propagates the aggregation into a cross-β structure, thereby forming large supramolecular structures. Predisposing factors leading to amyloid formation include the primary structure of the precursor protein (either as an intrinsic property or caused by a germ line mutation), concentration of the precursor protein, pH, proteolysis and the presence or absence of deleterious or protective chaperone molecules (Merlini et al. Citation2011). Based on experimental data, amyloid formation can be categorized into three phases. Initially, during the lag or nucleation phase, fibril assembly is energetically unfavorable, despite the presence of potentially amyloidogenic conformational intermediates. Once a critical nucleus has formed, conditions change in favor of an exponential growth phase leading to a rapid formation and extension of amyloid fibrils, which is then followed by an equilibrium phase (Chiti and Dobson Citation2017).
Apart from the fibril-forming amyloid protein, it has been known for decades that amyloid deposits also contain several other non-fibrillogenic components, such as serum amyloid P component (SAP; UniProt entry name SAMP_HUMAN), apolipoprotein E (Apo-E; APOE_HUMAN), vitronectin (VTNC_HUMAN), highly sulfated glycosaminoglycans, as well as many other components (Ancsin and Kisilevsky Citation1999; Coker et al. Citation2000; Kisilevsky Citation2000; Winter et al. Citation2015). These non-fibrillar constituents may not be simple passive bystanders of the disease. Instead, some have shown to be active contributors to disease initiation, progression, and possibly clearance (Ancsin and Kisilevsky Citation1999; Coker et al. Citation2000; Kisilevsky Citation2000).
In the preceding decades, we and others have collected ample evidence of the tissue-specific patterns from different types of amyloid deposits (Mahmood et al. Citation2015; Freudenthaler et al. Citation2016; Baumgart et al. Citation2018; Stuhlmann-Laeisz et al. Citation2019). Hence, we consider amyloidosis as a disease of cells and tissues, and amyloid itself as a “gemisch” (mixture) of constituents that show organ-, tissue-, and amyloid-type specific patterns. To test this hypothesis, we carried out a comprehensive literature review on publications investigating the proteome of amyloid and to fully demonstrate the complexity of the amyloid proteome. We hope that these data will spur future investigations on the pathogenesis and pathology of amyloid beyond the aggregated fibril protein.
Materials and methods
Literature search strategy
We retrieved proteome data on amyloid published between 1 January 2008 and 22 July 2020. Initially, publications were searched using PubMed with the following search terms: mass spectrometry, proteomics, amyloidosis, amyloid, and laser microdissection. Since many studies were published by a limited number of research groups, we then sought specific proteomic data generated via liquid chromatography (LC) and mass spectrometry (MS) originating from a limited number of research groups, e.g. from the Mayo Clinic Rochester, MN, USA or Italian research facilities (Rodriguez et al. Citation2008; Vrana et al. Citation2009; Brambilla et al. Citation2012; Theis et al. Citation2013; Vrana et al. Citation2014) using the affiliated authors’ names and “amyloid” or “amyloidosis” as additional search terms (Supplementary Table S1). Finally, reference lists from the publications retrieved by any of the two procedures described above were screened for further relevant and yet unidentified publications. The records were limited to those in the English language.
Data selection
To ensure comparability, we selected publications including proteomic data on amyloids analysis from subcutaneous fat aspirates (SFAs) via LC coupled to tandem mass spectrometry (MS/MS) and from formalin-fixed and paraffin-embedded (FFPE) tissues via laser microdissection (LMD) and LC-MS/MS. Published data included proteins from deposits found in different types of amyloidosis and organs/tissues, and their respective number of spectra. Data were extracted into single tables and selected for further analysis if the following information was included: (1) method: LMD LC-MS or LC-MS for SFA; (2) sample type: FFPE tissues or SFAs; (3) histological analysis that confirmed the presence of amyloid deposits; (4) protein name and/or comprehensible identifier; (5) number of total peptide spectra identified; and (6) protein probability score for identification of a given protein. Published samples with an unknown or outdated diagnosis were excluded. No spectra were assigned to proteins with a protein probability score <95% or a number of spectra below 4. Instead, these spectra were handled the same as proteins that were not detected in the corresponding sample.
Bioinformatics
The generated data sets containing protein names and/or identifiers were matched to a corresponding UniProt protein name and/or entry name (UniProt Consortium Citation2019). If both distinguishing terms could not be directly matched, the publication year of the article and the history of the old UniProt accession numbers were checked for potential identifiers. Proteins were considered for further data processing only if they could be linked to an UniProt accession number. All proteins that could not be clearly matched to an UniProt entry were excluded from further analysis. In case of a match, additional information on the protein including its accession number, entry name, review status, protein name, subcellular location, mass, and length were extracted from the UniProt database. Further data processing was performed with R version 4.0.0 (R Core Team Citation2020) using the “tidyverse” version 1.3.0 (Wickham et al. Citation2019) and “ggplot2” version 3.3.2 (Wickham Citation2016) package.
In total, 395 peer-reviewed, published articles were retrieved using our search strategy. Only 63 articles contained data including spectral numbers of proteins identified in amyloid. From these 63 publications, we excluded four articles as proteomic data were reprinted (Cohen and Comenzo Citation2010; Comenzo Citation2014; Nasr et al. Citation2015; Picken Citation2015), one article due to an unclear diagnosis (Damy et al. Citation2014), and nine articles as they did not contain comparable spectral numbers or protein probability scores (Vrana et al. Citation2009; Miller et al. Citation2010; Sethi, Fervenza et al. Citation2010; Klein et al. Citation2011; D’Souza et al. Citation2014; Sun et al. Citation2015; Alexander et al. Citation2018; Dasari et al. Citation2018; Klimtchuk et al. Citation2018). Therefore, 49 articles with 67 single figures could be used for data collection and were further processed.
All extracted tables, including their reference and UniProt information, were loaded into R and merged into one dataset. The protein spectra numbers were rated according to D’Souza et al. (Citation2014) into categories of 1–3, 4–10, 11–20, and >21 spectra. The median of the spectral class was determined for each type of protein. To calculate the number of cases found in the respective organ and amyloid type, the spectral numbers were averaged for samples from the same patient. Case numbers were plotted using “tidyverse” version 1.3.0 (Wickham et al. Citation2019) and “viridis” version 0.5.1 packages (Garnier Citation2018). The nomenclature of the amyloid fibril proteins follows the recommendations from the International Society of Amyloidosis (ISA) nomenclature committee (Supplementary Table S2; Benson et al. Citation2020).
To depict the number of occurrences for each protein in an amyloid-related dataset, single samples were grouped by protein name, organ- or tissue-type, and amyloidosis type. The number of positive samples and the total sample number, as well as their ratio, were determined per group. The whole dataset was arranged according to the protein with the highest ratio in all amyloidosis types and organs analyzed. Proteins that could not be detected in any of the tested samples were excluded. Amyloid types with less than 10 reported proteins were also excluded from further analysis. The ratio of positive and the total number of samples per group was plotted in a heatmap using “ComplexHeatmap” version 2.4.2 (Gu et al. Citation2016), “circlize” version 0.4.10 (Gu et al. Citation2014), and “viridis” version 0.5.1 (Garnier Citation2018) packages. As a simple annotation, the median spectral count was plotted. A bar graph annotation was added to the heatmap to show the absolute number of positive and negative samples per protein regardless of organ and amyloidosis type.
Altogether, 258 different proteins were reported; however, 54 proteins could not be matched to UniProt entries. Of these 54 unmatched proteins, 20 entries referred to mutations in amyloidogenic or amyloid-associated proteins, four entries were merged or demerged and could not be clearly matched, 13 entries referred to precursors of the respective protein, and for 17 proteins, too little information was available to sufficiently run a database search. Protein data were only included once if the same sample was mentioned multiple times in an article (Sethi, Theis et al. Citation2010; Rowczenio et al. Citation2011). Additionally, protein data from two publications were partially fused into one as the spectral number of the proteins reported in both articles were exactly the same (Nasr et al. Citation2017; Sethi et al. Citation2018). Moreover, a protein dataset was excluded from an extracted table if they were mentioned repeatedly after matching an updated accession number (D’Souza et al. Citation2013; Ravindran et al. Citation2016), were outdated leading to incorrectly diagnosed amyloidosis and its amyloidogenic protein (Dogan Citation2017), or if a protein was mentioned twice in the corresponding figure from the respective article (Helder et al. Citation2014).
Results and discussion
Until now, proteomic evaluation of amyloid has mainly focused on the detection and characterization of the fibril-forming protein itself to determine if a candidate is a diagnostic biomarker or to find novel amyloid fibril-forming proteins. A comprehensive review of LC-MS generated amyloid fibril protein data was recently published by Dasari et al. (Citation2020), who evaluated 16,175 amyloidosis cases and described the distribution of amyloidosis types and organ-specific enrichment of amyloid deposits. However, little attention has been paid to the other proteinaceous constituents present in these complexes. In addition to the fibril-forming protein, LC-MS also detects non-fibril forming components as recently shown by Kourelis et al. (Citation2020). Herein, we performed a comprehensive literature review and analysis on published datasets and recent findings including non-fibrillar constituents, i.e. the amyloid proteome.
Prominent proteins in amyloid
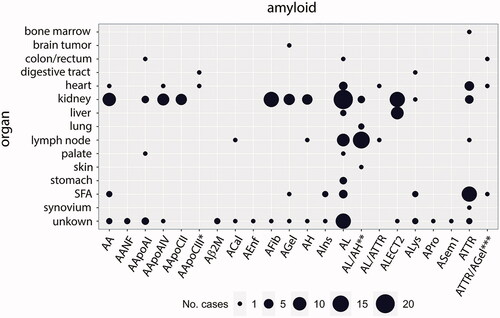
Proteomic data were extracted from 227 cases and 318 samples that refer to 22 types of amyloidosis and 15 organ-/tissue-types. The case distribution is shown in (), with light chain amyloid (AL) amyloid being the most frequently diagnosed type of amyloidosis with 58 cases. Additionally, there were 24 cases of mixed- or double-amyloidosis, which is characterized by the deposition of two different fibril proteins in a single patient. From the organs listed, most studies used kidney specimens in 96 cases and 132 single samples (Supplementary Table S3). More than 10 cases and 20 samples were isolated from SFA (25 cases, 33 samples), heart (14 cases, 27 samples), and lymph node (29 cases and samples) tissues. For the amyloid types Aβ2M, ACal, AEnf, APro, and ASem1, less than 10 different proteins were reported; therefore, they were excluded from further analysis.
Figure 1. The case distribution of amyloidoses in which proteomic data has been reported in the literature. Point size refers to the number of amyloidosis cases typed via LC-MS/MS in the respective organ sample. In three cases, the samples were derived from more than one organ type: *heart and digestive tract; **lung and skin; ***heart, subcutaneous fat aspirate (SFA), and colon/rectum. The nomenclature of the amyloid fibril is according to Benson et al. (Citation2020).
Of the 204 selected proteins, 49 were not detected in any of the samples analyzed. In addition, 72 proteins were found in 10 or less samples, whereas another 20 proteins were positively detected in less than three samples. Thus, these select proteins were all excluded from further analysis (for raw data, see Supplementary Table S4).
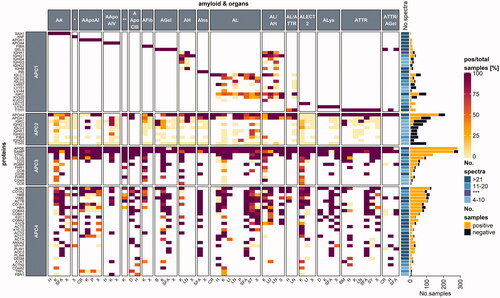
The remaining 65 proteins were grouped into four categories: amyloid proteome-category 1 (APC1) includes exclusively fibrillary proteins found in the patient; APC2 includes potentialy fibril-forming proteins found in other types of amyloidoses; and both APC3 and APC4 consists of the remaining non-fibrillary proteins (). The 65 remaining proteins were further analyzed according to the number of positive samples compared to the total number of samples tested, which was marked by numbers in brackets (positive samples/total samples).
Figure 2. A heatmap examining protein occurrence in amyloid samples analyzed with LC-MS/MS. Proteins are categorized according to their fibril formation ability into either amyloid proteome-category 1 (APC1), which contains only fibril-forming proteins in the patient; APC2: potentially fibril-forming proteins found in other types of amyloidosis.; APC3: regular amyloid components, where most are likely involved in amyloidosis pathogenesis; APC4: normal tissue constituents, that might play a role in amyloid formation. Protein names were taken from the UniProt entry name, and only human proteins are listed. Apo-CII and Apo-CIII fibril proteins are not shown as less than 10 samples were reported. Each heatmap cell is colored based on the ratio comparing the number of positive samples to the total number of samples tested per protein (left) for the corresponding organ (bottom) and amyloid type (top). White cells correspond to missing values. Proteins are arranged according to the protein with the highest ratio for all amyloid types and organs analyzed. A simple right annotation shows the median spectral number for each category per protein. The bar graph illustrates the absolute number of positive and negative samples analyzed per protein. *AANF; **AApoCII; ***median value for number of spectra categories between the >21 and 11–20 groups. H: heart; K: kidney; SFA: subcutaneous fat aspirate; X: unknown; CR: colon/rectum; P: palate; D: digestive tract; B: brain tumor; LN: lymph node; ST: stomach; S: skin; LI: liver; LU: lung; BM: bone marrow; SY: synovium (see colour version of this figure at https://www.tandfonline.com/ibmg).
Amyloid proteome–a functional classification
Amyloid proteome-category 1 (APC1)
Members of the APC1 group are the fibril-forming proteins of amyloid deposits, which are specific for only one type of amyloidosis in the patient, for example serum amyloid A (SAA, SAA1_HUMAN) for AA amyloidosis and insulin (INS_HUMAN) for AIns amyloidosis. Currently, 36 different fibril-forming proteins are known (Benson et al. Citation2020); however, sufficient proteomic data are available only from 17 different types of amyloidosis in our dataset (). Currently, the proteomic data only represent a fraction of the diverse types of amyloidosis, including the most common systemic forms–e.g. AA-, AL-, and ATTR amyloidosis–and the most common organ and tissue sites used for amyloid diagnostics, which includes tissue samples from the gastrointestinal tract, heart, kidney, and SFA. Mostly exclusive and disease-specific fibril-forming APC1-type proteins such as transthyretin (TTHY_HUMAN), gelsolin (GELS_HUMAN), lysozyme C (LYSC_HUMAN), SAA, insulin, and natriuretic peptides A (ANF_HUMAN) were detected with a high abundance in the respective tissue () and were considered as evidence of the amyloid fibril protein. For diagnostics, determining the amyloid fibril protein is essential, and proteomics is considered to be the gold standard for tissue-based classification, i.e. subgrouping, of amyloidosis. However, our review demonstrates the distinctive occurrence of potentially disease-causing and amyloid fibril-forming proteins that can be present in amyloid deposits of otherwise typed amyloidosis, e.g. Apo-AIV in ATTR amyloidosis (see below). Hence, fibril-forming proteins are differentiated into two groups (APC1 and APC2).
Amyloid proteome-category 2 (APC2)
APC2 comprises of several proteins that are known to have the ability to form amyloid fibrils, but appear as constituents of differently typed amyloidoses. For instance, apolipoproteins (Apo) Apo-AIV (APOA4_HUMAN), Apo-AI (APOA1_HUMAN), and immunoglobulins belong to this category (), which occur in a broad range of amyloidosis types, despite their fibril-forming characteristics. Apo-AIV was reported in 82% (182/223) of all samples. Although Apo-AIV can occur as a fibril protein (Sethi et al. Citation2012; Dasari et al. Citation2016), it is also considered an amyloid signature protein (Vrana et al. Citation2014). Similarly, Apo-AI and its gene variants can either be amyloid fibril proteins (Horike et al. Citation2018), or regular constituents in fat tissue; therefore, they are not suited as an amyloid surrogate marker in fat aspirates (Vrana et al. Citation2014). In our literature review, Apo-AI was found in 53% (66/125) of samples that were categorized as non-Apo-AI amyloidosis.
Even fibrinogen alpha chain (FIBA_HUMAN) and transthyretin, which normally indicate AFib or ATTR amyloidosis, respectively, have been infrequently reported in AL or AL/AH cases (). The number of spectra measured for fibrinogen alpha chain was 31 in one AL stomach, two in one kidney sample, and six in one AL/AH kidney sample. Transthyretin was found in two lymph node samples from a patient with mixed AL/AH with six and seven spectral numbers, respectively. Amyloidosis is usually determined by the most abundant protein that is able to form a fibril. Interestingly we observed that many fibrillary proteins occur with a relative abundance of more than 21 spectra (, simple annotation), except for immunoglobulin heavy and light chains. The number of spectra measurements varied over a broad range between 4 and more than 21 spectra. Immunoglobulins are ubiquitously present and found in many amyloid deposits at various abundances (). Constant regions and heavy chains from immunoglobulins appear in various amyloid types. In contrast, the variable light chains of immunoglobulins, which are characteristic of AL or mixed AL amyloidoses (; KV320_HUMAN, LV657_HUMAN, LV151_HUMAN, KVD12_HUMAN, LC144_HUMAN) are considered part of APC1. Amyloidogenic variable light chains originate from highly patient-specific sequences, which have for example been compiled into the AL-base (http://albase.bumc.bu.edu/aldb/ link last updated November 16, 2020). Immunoglobulin heavy chain peptides can be characteristic of AH amyloidosis and/or the co-occurrence of AH and AL amyloidosis, a rare condition reviewed elsewhere (Otaka et al. Citation2019). Thus, some proteins and peptides can only be categorized into APC1 or APC2 based on their relative abundance. Proteomic data largely confirm observations made by immunohistochemistry, a method that has often been considered nonspecific. In fact, proteomics confirms the presence of different putative fibril proteins, including immunoglobulins, transthyretin, and SAA in non-AL-, non-ATTR, and non-AA amyloidosis, respectively. The reasons behind this phenomenon are poorly understood. Regardless, it could be the result of cross-seeding (heterologous seeding), which refers to the stimulation of aggregation of one amyloid protein/peptide by another amyloid protein (Ke et al. Citation2020). This may lead to the formation of mixed fibrils consisting of more than one fibril-protein, which could be a far more common phenomenon than previously anticipated (Ke et al. Citation2020).
In support of this contention, our reviewed data presented several cases of mixed and double amyloids, namely AL/ATTR (Sidiqi et al. Citation2019), AL/AH (Sethi, Theis et al. Citation2010; Adachi et al. Citation2020) and ATTR/AGel (Sridharan et al. Citation2018) (). Sidiqi et al. (Citation2019) studied a case series of mixed AL and ATTR cases. They demonstrated that in those cases of mixed-type amyloidosis, both fibril proteins can occur in the same amyloid deposit (Sidiqi et al. Citation2019). However, mixed-type amyloidosis is different from double amyloidosis, a type in which the patient suffers from more than one type of amyloidosis. For instance, Sridharan et al. (Citation2018) reported a case of hereditary ATTR and AGel. Transthyretin was exclusively detected in heart samples, whereas gelsolin was only found in samples from the SFA and colon (Sridharan et al. Citation2018), which poses another challenge to the clinicians as analysis of only one sampling site might be insufficient. Both mixed-type and double amyloidosis could be a result of cross-seeding (Oskarsson et al. Citation2015), a possibility that could lead to the detection of more than a single fibril protein in an amyloid deposit or a single patient. Identifying the correct amyloidosis type is mandatory for choosing the appropriate therapy. Especially distinction between AL and ATTR amyloidosis is critical, as AL amyloidosis calls for a more drastical treatment by chemotherapy (Sidiqi et al. Citation2019). To enable a more specific amyloid typing of selected cases that are difficult to diagnose Mangione et al. (Citation2017) tested decellularisation as an additional sample preparation step before LC-MS. Decellularisation was performed on fresh cardiac tissue prior to fixation or directly on fresh SFA from patients with suspected mixed amyloidosis. Amyloid deposits did not disassemble under this treatment, resulting in a reduced number of non-fibrillar and non-amyloidogenic peptide signals (Mangione et al. Citation2017). SFA can be obtained easily and minimally invasive compared to the collection of most organ biopsies. Hence, it is a convenient sampling technique for typing of systemic amyloidoses (Vrana et al. Citation2014) and decellularisation might enhance its specificity (Mangione et al. Citation2017).
Apart from the proteins, which are generally able to form amyloid fibrils, we identified 40 proteins that were found repeatedly in amyloid deposits and categorized them as either APC3 or APC4.
Amyloid proteome-category 3 (APC3)
Members from the APC3 group, which are disease-specific, non-fibril forming proteins, are detected at different organ and tissue sites and are considered to be amyloid signature proteins, i.e., indicative of amyloid. Additionally, they are thought to play a role in amyloidogenesis and cytotoxicity. Many of them were found in more than 80% of the samples as well as over a broad range of amyloidosis and organ types (). Among these amyloid-specific components are Apo-E, SAP, members of the complement system, clusterin (CLUS_HUMAN), basement-membrane-specific heparan sulfate proteoglycan (HSPG; PGBM_HUMAN), and vitronectin (VTNC_HUMAN; ).
Apo-E was found in 99% (285/288) of the samples tested. Apo-E is considered to be an amyloid signature protein as previously proven using samples from SFA (Vrana et al. Citation2014). In Alzheimer’s disease (AD), Apo-E plays an important role as it directly interacts with the amyloid β protein (Aβ; an overview is presented by Wisniewski and Drummond (Citation2020)). The Apo-E gene variant APOE4 amplifies Aβ oligomer formation, which stabilizes the oligomers (Hashimoto et al. Citation2012).
SAP was found in 91% (262/289) of samples (). It is consistently associated with amyloid deposits and, similar to Apo-E and Apo-AIV, is considered to be an amyloid signature protein (Benson et al. Citation2020). As a result, it is often over-represented such as in SFA samples from ALλ- and ATTR amyloidosis patients (Brambilla et al. Citation2013). SAP is a member of the pentraxin family (Mantovani et al. Citation2008), synthesized mainly in the liver, and present in human plasma and elastic fibers (Pepys et al. Citation1997). Two Ca2+ atoms per subunit enable SAPs binding to various ligands (Emsley et al. Citation1994), such as DNA (Pepys and Butler Citation1987), chromatin (Butler et al. Citation1990), or several bacteria (Noursadeghi et al. Citation2000). SAP binds to amyloid fibrils in a calcium-dependent manner (Pepys et al. Citation1979) and may protect amyloids from detection by the innate immune system, thereby preventing their degradation (Pepys Citation2018). SAP depletion from serum (Pepys et al. Citation2002) in combination with antibody-mediated activation of the innate immune response (Richards et al. Citation2015) enables amyloid degradation (Richards et al. Citation2018). Interestingly, SAP may also activate and modulate the complement pathway. The complement system is part of the innate immune defense and is modulated by many different substances, such as bacteria, pentraxins, IgM or IgG molecules–many of which unleash the processing of numerous and interconnected complement components (for an overview see Sjöberg et al. (Citation2009), Ricklin et al. (Citation2010), and Hajishengallis et al. (Citation2017)). Aggregated as well as non-aggregated, SAP isolated from plasma binds complement C1q, the initiator of the classical complement pathway (Bristow and Boackle Citation1986; Ricklin et al. Citation2010; Poulsen et al. Citation2017). Although Sethi et al. (Citation2013) searched for complement C1q subunits B and C, they were not able to identify them in amyloid deposits from kidney tissues taken from single patients with AA, AL, or ALECT2 deposits. Currently, it is unknown whether SAP modulates the complement pathway in amyloidosis.
Intriguingly, our data review revealed many members of the complement system found in amyloid deposits, mainly complement C3 (C3; CO3_HUMAN), complement C4-A (C4A; CO4A_HUMAN), complement C5 (C5; CO5_HUMAN), and complement component C9 (C9; CO9_HUMAN) as well as the regulators complement factor H-related protein 1 (FHR-1; FHR1_HUMAN) and complement factor H-related protein 5 (FHR-5; FHR5_HUMAN), some of which likely belong to APC3 (). Components of the complement system were mainly reported in kidney samples. Of these, complement C3 was reported the most often as 81% (43/53) of positively tested kidney samples and 82% (49/62) of total positive samples (2/2 bone marrow, 1/1 synovium, 0/1 liver, 0/1 stomach, 1/4 heart) were found. C9 was positive in 67% of kidney samples (18/27) and 2 out of 3 stomach samples. Other complement components have been reported less often. For instance, C4A and C5 were investigated solely in the kidney, with 8/18 samples were C4A positive (44%), and 3/10 samples were positive for C5 (30%). Complement regulatory proteins were mainly analyzed in kidney samples. FHR-1 was reported in 75% of all samples tested (24/33 kidney, 3/3 heart samples), whereas FHR-5 was positive in 65% (20/31) of kidney samples.
C3 presents a nodal point that is part of all three complement pathways (i.e. classical, lectin, and alternative pathway), whereas C9 is part of the terminal complement complex (Ricklin et al. Citation2010). Several subunits from C9 form the membrane attack complex (MAC), which is a pore-like structure leading to cell lysis (Müller-Eberhard Citation1985). Hence, it is a classical marker for cell necrosis that is often used when examining tissue pathology via immunohistochemistry (Jenkins et al. Citation2010; Jasra et al. Citation2012). In our reviewed data, C3 was found in 2 out of 7 samples from patients with AL amyloidosis. For SFA, it was previously shown that C3 was up-represented in ATTR patients, but not in ALλ or ALκ patients (Brambilla et al. Citation2013). This could indicate that presence of the complement system depends on the amyloidosis type and/or cause of disease. However, more data will need to be generated to comparatively analyze and fully scrutinize this hypothesis, especially as there is not much data available regarding the complement system in various amyloid types. The role of the complement system in amyloidosis has mainly been studied and reviewed with regard to AD (Krance et al. Citation2019). Based on their reviewed data on AD patients, Krance et al. (Citation2019) found that C4A and C9 tended to be more abundant in blood samples from AD patients compared to samples from healthy elderly individuals. Moreover, C3 and clusterin were present at higher concentrations in cerebral spinal fluid in patients with AD (Krance et al. Citation2019). Many of the previously reported complement components were found in a recent study on the ATTR- and AL specific proteome found in heart samples (Kourelis et al. Citation2020). The authors demonstrated that differential expression of C3, C9, complement factor H, FHR-5 occured in ATTR, and FHR-1 in both ATTR and AL patients (Kourelis et al. Citation2020). These findings suggest an important role of the complement system in many amyloidosis-types, particularly as the complement cascade might trigger cell death in response to amyloidosis not only in the heart but also in other tissues (e.g. kidney). Hence, we consider the complement pathway components as part of the APC3 group.
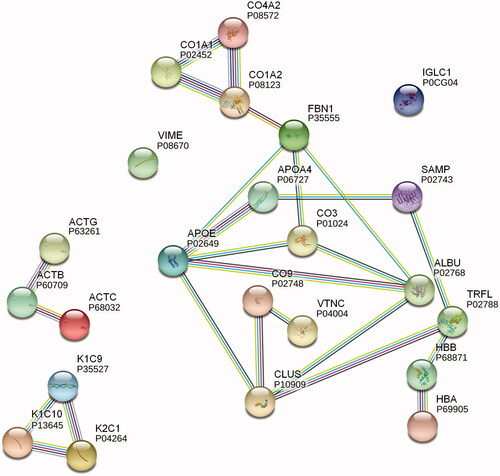
To predict possible interactions, especially between non-fibril-forming proteins found in amyloids, we performed a protein network analysis with STRING ((Szklarczyk et al. Citation2019); for settings and details, see Supplementary Methods). Some of our retrieved data that referred to kidney samples from AL cases also depicted clusterin and vitronectin as potential interactors with C9 (). It has been previously reported that clusterin and vitronectin can interact with complement components, thereby modulating the MAC assembly (Hajishengallis et al. Citation2017), but it is not clear whether this mechanism plays a role in amyloid pathogenesis.
Figure 3. STRING protein network analysis. Putative protein interactions are indicated using differently colored lines: curated database entries (pink), experimentally determined interactions (light blue), correlated gene expression (black), protein homology (light purple), and textmining (green). Only highest confidence interactions (0.900) are depicted (see colour version of this figure at https://www.tandfonline.com/ibmg).
These observations emphasize the fact that clusterin is also an extracellular chaperone, which was reported in relation to various amyloid types (as reviewed by Wilson et al. (Citation2008)). In our reviewed data, clusterin was present in 87% (85/98) of samples tested (), including samples from various tissues. Clusterin is another protein that is suggested to play an important part in AD disease progression (Krance et al. Citation2019). In vitro experiments by Narayan et al. (Citation2011) showed that clusterin was able to either dissociate Aβ fibrils or hinder the assembly of Aβ monomers into a fibril structure. It has also been reported to have an influence on Aβ amyloid cytotoxicity in vitro (Yerbury et al. Citation2007). Furthermore, clusterin has been shown to have an effect on other fibril-forming proteins; for instance, it inhibits transthyretin fibril formation by stabilizing the transthyretin tetrameric structure under acidic conditions in vitro (Lee et al. Citation2009). No data were retrieved for clusterin in SFA samples () from our systematic literature search; however, the clusterin isoform 2 has been reported by Brambilla et al. (Citation2013) as an up-represented SFA component in AL and ATTR amyloidosis patients. Greene et al. (Citation2011) evaluated the co-localization of clusterin in amyloid deposits from heart samples isolated from ATTR and AL cases in which they compared samples to one non-amyloid case via immunohistochemical and immunogold electron microscopic analysis. Kourelis et al. (Citation2020) also showed that clusterin was differentially expressed in heart samples from ATTR and AL patients. Hence, we know that clusterin can co-occur with amyloid deposits, but what kind of protein interactions are taking place within the amyloid or the surrounding tissue remains to be elucidated.
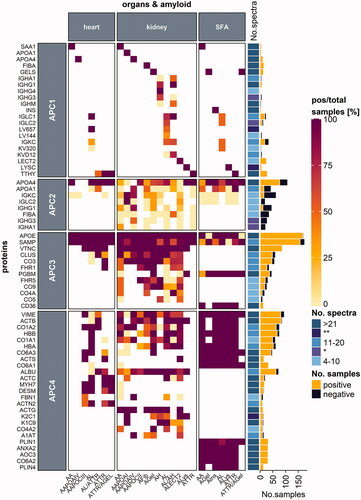
Figure 4. Protein distribution among heart and kidney tissues and SFA samples. Proteins are categorized according to their occurrence in one, two or three of the respective tissue types. Protein names refer to the UniProt entry name, and only human proteins are listed. Each heatmap cell is colored based on the ratio comparing the number of positive samples to the total number of samples tested per protein (left) for the corresponding amyloid type (bottom) and organ (top) type. White cells correspond to missing values. Proteins are arranged according to the protein with the highest ratio for all amyloid types and organs analyzed. A simple right annotation shows the median spectral number for each category per protein. The bar graph refers to the absolute number of positive and negative samples analyzed per protein. *median value for the number of spectra categories between the 11–20 and 4–10 groups (see colour version of this figure at https://www.tandfonline.com/ibmg).
We found that vitronectin was present in 99% (139/140) of amyloid samples from different organs/tissues and amyloid types (); therefore, it was categorized as a member of the APC3 group. Immunohistochemical analyses of other amyloid types and tissues showed a heterogeneous co-occurrence of vitronectin (Winter et al. Citation2015). In addition, it has been shown with matrix-assisted laser desorption/ionization mass spectrometry imaging (MALDI MSI) and MALDI MS/MS that vitronectin is specifically enriched and co-localizes in the liver with Apo-AI deposits (Winter et al. Citation2015).
Apart from apolipoproteins and SAP, HSPG was determined to be an amyloid signature protein according to the new amyloid nomenclature from 2020 (Benson et al. Citation2020). Our reviewed data included HSPG (gene name HSPG2), also known as perlecan. Our search indicated that perlecan was abundant (81% (47/58) of tested samples) in nearly all SFA samples from various amyloid types and was a constituent of the kidney amyloid proteome in single AGel and ALys samples as well as in AApoCIII digestive tract samples (). Perlecan is a component of all basement membranes and is essential in humans, particularly as it plays an important role in developing the heart and brain (Martinez et al. Citation2018). It was demonstrated that perlecan expression, amongst other membrane-associated extracellular matrix (ECM) components, was increased in patients with AD compared to control patients without neurodegenerative diseases and that it correlated with amyloid deposition (Lepelletier et al. Citation2017). Perlecan was up-represented in ALλ, ALκ, and AA from SFA, but was down-represented in ATTR patients (Brambilla et al. Citation2013). Perlecan occurs in various modified forms depending on its function, which helps to regulate its function in many pathways and association with binding partners (Martinez et al. Citation2018). Finding out more about its structure in amyloid deposits could enable the prediction of its function in amyloidosis pathogenesis.
Another protein detected in SFA samples was platelet glycoprotein 4 (CD36; CD36_HUMAN) (13/13; ). In ALλ and ALκ SFA samples, it was down-represented (Brambilla et al. Citation2013). CD36 is a receptor for long-chain fatty acids (reviewed by Glatz and Luiken (Citation2018)) and is expected to be found in fat. Alternatively, CD36 was studied for its involvement in AD as a scavenger receptor and ligand for amyloid fibrils, which is downregulated in AD progression (as previously reviewed by Dobri et al. (Citation2021)). CD36 is also a ligand for SAA (Baranova et al. Citation2010) and is proposed to initiate an inflammatory reaction in AA amyloidosis (Yang et al. Citation2017). Additionally, it was recently shown to be crucial for myelin debris clearance in neurodegenerative diseases (Bogie et al. Citation2020). Therefore, we allocated this protein into the APC3 group as it is theorized to play a crucial role in inflammatory reactions in more than one type of amyloidosis, e.g. AA and AD amyloidosis (Yang et al. Citation2017; Dobri et al. Citation2021).
Thus, proteins grouped into APC3 are of particular interest for diagnostic purposes, particularly as they could potentially be used as surrogate markers for amyloid; moreover, they are also of major scientific interest owing to their potential fundamental roles in amyloid pathology.
Amyloid proteome-category 4 (APC4)
For the remaining category, several proteins found by proteomic analyses may represent contaminants, tissue constituents present before amyloid formation, or locally enriched proteins that accumulate as a result of amyloid formation. Members of the APC4 group include a diverse range of peptides and proteins, although there may be some overlap with the APC3 group. Several ECM components were categorized into APC3 or APC4 depending on data availability. Therefore, APC4 includes proteins from the ECM, secreted or common serum constituents, keratin, and cytoskeletal proteins, as well as proteins that mediate contractility, and lipid metabolism (). For a more condensed overview, we also compared proteins found in samples from SFA or kidney and heart tissues (), as these tissues were reported most often.
From the literature, we retrieved proteins in amyloids that belonged to the ECM, including interstitial matrix and basement membrane proteins. A detailed description of basement membrane assembly and composition has been reviewed elsewhere (Pozzi et al. Citation2017). Although perlecan is considered to be an amyloid-associated protein (i.e., APC3), the basement membrane protein collagen alpha-2(IV) chain (COL4A2; CO4A2_HUMAN) was also reported in amyloid (Sethi, Theis, Quint et al. Citation2013; Sethi, Theis, Vrana et al. Citation2013; Efebera et al. Citation2014). In mammals COL4A2 is present early and throughout development and is essential for vasculogenesis (Pozzi et al. Citation2017). Data for COL4A2 were published for amyloids from kidney samples, and 75% (9/12) of samples were positive. COL4A2 was down-represented in SFA samples from ALκ- and ATTR amyloidosis patients compared to normal adipose tissue (Brambilla et al. Citation2013). Annexin A2 (ANXA2_HUMAN) is a membrane-binding protein that was found in all 34 samples (31 SFA (), 3 digestive tract samples) tested. Annexin A2 is proposed to participate in both anti- and pro-inflammatory processes, support internal membrane repair (Dallacasagrande and Hajjar Citation2020), and interact with complement components in a murine model (Renner et al. Citation2016); therefore, it would be an interesting candidate to investigate in human amyloid samples. Other extracellular components reported in the literature on amyloid composition were collagen (COL) isoforms. COL1A2 (CO1A2_HUMAN; 85%, 87/103), COL1A1 (CO1A1_HUMAN; 83%, 70/84), COL6A3 (CO6A3_HUMAN; 85%, 73/86), COL6A1 (CO6A1_HUMAN; 88%, 52/59), and COL6A2 (CO6A2_HUMAN; 100%, 51/51) were frequently found in many amyloidosis- and organ-types. Collagen VI isotypes were found in all tested SFA samples (97/97, 33 COL6A1, 31 COL6A2, and 33 COL6A3; ). These isotypes also associate with adipose tissue ECM (Khan et al. Citation2009). Brambilla et al. (Citation2013) analyzed COL1A1, COL6A1, COL6A2, COL6A3 as these subunits were up-represented in SFA samples from ALλ, ALκ, ATTR, and AA patients, indicating that matrix remodeling potentially occurs to provide a pro-amyloidogenic environment. Kourelis et al. (Citation2020) determined that COL6A1 and COL6A2 were part of the ATTR-specific proteome, whereas COL1A1 and COL1A2 were found in the ATTR- and AL-specific proteome derived from heart samples, suggesting that matrix remodeling potentially occurs in amyloids. Fibrillin-1 (FBN1_HUMAN) was found in only one of two heart samples from a patient with AApoCIII, and four out of 10 kidney samples from various amyloidosis types (). Alpha-1-antitrypsin (A1AT_HUMAN) was found in 62% (13/21) of samples analyzed (). Lactotransferrin (TRFL_HUMAN) was found in five out of 14 samples (36%).
Proteins abundant in blood or skin can occur as contaminants in proteomic investigations. Many are listed in the common repository of adventitious proteins (cRAP) (https://www.thegpm.org/crap/; link last updated December 11, 2020). This collection lists protein contaminants that must be carefully evaluated as sample contamination can come from the operator, the laboratory environment, or during sample preparation. Therefore, it is sometimes difficult to determine whether these proteins are truly enriched in a sample or categorized as contaminants.
APC4 includes serum proteins such as albumin (ALBU_HUMAN), hemoglobulin subunit alpha (HBA; HBA_HUMAN), and beta (HBB; HBB_HUMAN), which are expected to be found in most samples. Albumin was reported in 92% (118/129) of tested samples, whereas HBA and HBB were present in 75% (71/95) and 82% (98/119) of samples, respectively (). These three proteins might have been enriched owing to sample preparation procedures (bleeding) or amyloid-associated tissue fragility (hemorrhage).
Keratins are highly enriched in specific tissues, which include keratin type II cytoskeletal 1 (K2C1; K2C1_HUMAN) in skin or keratin type I cytoskeletal 9 (K1C9; K1C9_HUMAN) in skin and lymphoid tissues. Keratins found in amyloid deposits were K2C1 (83%, 30/36), K1C9 (71%, 27/38), and keratin, type I cytoskeletal 10 (K1C10_HUMAN; 77%, 20/26) (). These keratins are all listed in the cRAP. Only comparative analyses can show if these keratins are enriched in amyloids or if they are a contamination from human skin.
Actin, myosin, and desmin (DESM_HUMAN) are cytoskeletal and contractile proteins (). The actin (ACT) isoforms, ACTB (ACTB_HUMAN; 94%, 102/108), ACTS (ACTS_HUMAN; 100%, 15/15), and ACTG (ACTG_HUMAN; 100%, 12/12; solely kidney samples), were found in nearly all of the samples tested. Moreover, ACTC (ACTC_HUMAN; 71%, 20/28, including 9/9 positive heart samples) and ACTA (ACTA_HUMAN; 87%, 20/23) were frequently reported. The bundling protein alpha-actinin-2 (ACTN2_HUMAN) was positively detected in 82% of heart samples (9/11; ). When heart samples were analyzed for myosin-7 (MYH7_HUMAN) and desmin, most samples were positive with 100% (17/17) detected for myosin-7 and 74% (13/15) detected for desmin, which are proportions that are characteristic of cardiac tissue (). Vimentin (VIME_HUMAN) was often detected (85% (96/113)) in samples from many organs and amyloidosis types. As described by Doll et al. (Citation2017), many of these proteins are also found in heart tissues from healthy patients. The authors’ proteomic analysis of heart samples from trauma patients showed that myosin-7, ACTC, HBA, HBB, alpha-actinin-2, and titin made up to 25% of the total protein in heart cavities, with similar values for vessels and valves (Doll et al. Citation2017). Conversely, recent findings on desmin led to its addition to the list of “potential amyloid fibril proteins under investigation” by the nomenclature committee from ISA (Benson et al. Citation2020) as desmin was shown to have amyloidogenic features (Kedia et al. Citation2019). Hence, desmin might be listed as an APC1, fibril-forming protein in the future.
In the reviewed amyloid-related data on SFA samples, we observed a very homogeneous protein pattern, that is, the ratio of positive to the total sample number was usually 100% (). The reason could be that SFA does not only contain a dissected sample part but the whole mixture of fibril-forming, amyloid-associated proteins and peptides, in addition to other tissue constituents. We have already described Apo-AI (APC1/APC2), perlecan and CD36 (APC3), annexin A2, and collagen VI (APC4) as amyloid constituents in SFA samples. Additionally, ACTB, vimentin, and HBB were found in every SFA sample as well. Moreover, these proteins could also be identified in SFA samples from non-amyloid patients (Lavatelli et al. Citation2008). Thus, some APC4, non-fibrillar constituents of the amyloid proteome are present before the amyloids form, which could be viewed as “physiological contaminants.” However, the relative and absolute abundance of these proteins may vary depending on the extent of amyloid formation as shown by Brambilla et al. (Citation2012). Their data largely confirm the suitability of categorizing the amyloid proteome into four categories. Membrane primary amine oxidase (AOC3_HUMAN) was also found in all 31 SFA samples tested. Lipid metabolism modulating proteins such as perilipin-1 (PLIN1_HUMAN) and perlilipin-4 (PLIN4_HUMAN) were reported in 94% (32/34) and 100% (13/13) of SFA samples, respectively; additionally, they were categorized as APC4 as their detection was specific depending on organ- or tissue-type. Both proteins were down-represented in SFA samples from ALκ, ALλ, ATTR, and AA patients, which may be because of preferred fatty acid mobilization over lipid storage as these patients typically lose weight (Brambilla et al. Citation2013).
While some proteins in the APC4 group might indeed be contaminants without any relation to amyloids, other proteins in the category might reflect the organ- and tissue-specific modulators or determinants of the disease. It is well known that different types of amyloidosis show remarkable and distinctive patterns of histoanatomical deposition. These deposition patterns most likely stem from local “environmental” factors, which may be detected via proteomics. Further research on this topic is urgently needed.
Recommendations on handling mass spectrometry data
Our literature review also unraveled some short comings within the field that should be taken into consideration with future investagtions. There have been reports on comparative proteome analysis of amyloids, with raw data being published and made available. In contrast, data generated for diagnostic purposes using mass spectrometry were often partly published. As reevaluating and re-analyzing raw data from the past is possible, these datasets should be made fully available by transferring them to a database. Data on all identified peptides and proteins (e.g., number of spectra, false discovery rate (FDR), number of unique peptides, number of peptides per protein, and sequence coverage) would help researchers to better understand amyloid composition and identify new candidates to study during amyloid pathogenesis. Hence, guidelines for publishing mass spectrometry data should embrace the following points: (1) traceability of sample origin and amyloid type should be indicated for all proteomic data shown in the literature; (2) use of traceable protein accession numbers whenever possible (as advised by big databases, e.g. UniProt) instead of entry names that can vary over time as new studies are published; and (3) the raw data should contain the number of unique peptides and the total number of peptides per protein, protein sequence coverage, FDR, the quantification methods used, which proteins were considered to be contaminants, and others as recommended by the leading journals in proteome research.
The same principles apply to other mass spectrometry-based approaches to help enable a better understanding of amyloid formation and progression. For instance, if coupled with ion mobility separation (IMS), the MALDI-IMS MSI technique enables the spatially resolved analysis of amyloid-associated proteins (such as those from the APC3 group). This approach has been shown to differentiate between amyloid types according to their respective peptide patterns by Winter et al. (Citation2017). MALDI imaging was also used to characterize Aβ (from the APC1 group) in brain tissue by another research group (Ikegawa et al. Citation2019). Compared to LMD LC-MS/MS analyses, the tissue environment remains unchanged when using MALDI-IMS MSI. Gabelica et al. (Citation2019) shared recommendations on how to conduct and report ion mobility data. In combination with other mass spectrometry techniques analyzing proteins expression levels in amyloid deposits and the surrounding tissue, MALDI-IMS MSI adds to the methodological repertoire to obtain insight into amyloid pathology.
Recommendations for the classification of proteins in amyloid deposits
Recently, both fibril-forming and potential fibril-forming proteins were neatly classified and listed by the ISA (Benson et al. Citation2020). Additionally, co-localized proteins that associated with amyloids were mentioned as well, but were not explicitly listed. We know that a strict distinction between constitutents from normal tissues and amyloid-associated and fibril-forming proteins might be difficult, especially as an assignment to a protein class that we have suggested in this review is highly dynamic; however, an explicit allocation might not be possible since important information is still missing for every protein. Nevertheless, we recommend listing the repetitive occurrence of amyloid-associated and co-localized proteins, particularly as we know many components that play an important role in amyloid formation and disease progression. Hence, their designation according to their proposed function in amyloids should be regularly reviewed, listed, and updated as needed.
Study limitations
As we collected LC-MS data from different research institutions for our meta-analysis we know that there might be variations between publications, and spectral counts might not be accurately comparable in every case. Usage of spectral counts as a tool for quantification has been reviewed elsewhere (Lundgren et al. Citation2014). However, by classifying spectral counts one is able to roughly estimate the relative abundance, as the focus of this study was to illustrate, which proteins belong to the amyloid-specific proteome with a spectral count >4. Since we were able to show repetitive amyloid- and tissue-specific patterns, we want to encourage further research on the amyloid proteome beyond the fibril-forming proteins.
Conclusion
Our literature review of proteomic data confirms that amyloid constitutes a complex “gemisch” (mixture) of disease and organ-/tissue-specific peptides and proteins, i.e., the amyloid proteome. The amyloid proteome is dynamic and can be divided into four categories depending on the putative role and function of the individual peptides and proteins in amyloid pathology: APC1 includes only fibrillary proteins; APC2 includes potential fibril-forming proteins found in other types of amyloidosis; and non-fibril proteins are categorized as APC3 and APC4, some of which are specific for the presence of amyloids–i.e., amyloid signature proteins. This categorization may help to systemically explore the nature and role of the amyloid proteome when diseases manifest, progress, and likely clear. Further investigations, specifically on non-fibril-forming amyloid constituents, may form the basis for the development of novel diagnostic tools and therapeutic targets. However, the analysis of the amyloid proteome also requires internationally accepted standards of documentation and reporting.
Author contributions
The manuscript was written through contributions from both authors. JG collected, processed, and analyzed the proteomic data and prepared the script for , and Supplementary Figure S1. Both authors have approved the final version of the manuscript.
| Abbreviations | ||
| ACT | = | actin |
| AD | = | Alzheimer’s disease |
| AFib: amyloid fibrinogen alpha chain; Aβ | = | amyloid β protein |
| AH: amyloid heavy chain; AL: amyloid light chain; APC | = | amyloid proteome-category |
| Apo | = | apolipoprotein |
| ATTR: amyloid transthyretin; COL4A2 | = | basement membrane protein collagen alpha-2(IV) chain |
| COL | = | collagen |
| cRAP | = | common repository of adventitious proteins |
| C3 | = | complement C3 |
| C4A | = | complement C4-A |
| C5 | = | complement C5 |
| C9 | = | complement component C9 |
| ECM | = | extracellular matrix |
| FFPE | = | formalin-fixed paraffin-embedded |
| FHR-1 | = | factor H-related protein 1 |
| FHR-5 | = | factor H-related protein 5 |
| FDR | = | false discovery rate |
| HBA | = | hemoglobulin subunit alpha |
| HBB | = | hemoglobulin subunit beta |
| HSPG | = | heparan sulfate proteoglycan |
| ISA | = | International Society of Amyloidosis |
| IMS | = | ion mobility separation |
| K1C9 | = | keratin type I cytoskeletal 9 |
| K1C10 | = | keratin, type I cytoskeletal 10 |
| K2C1 | = | keratin type II cytoskeletal 1 |
| LMD | = | laser microdissection |
| LC | = | liquid chromatography |
| MS | = | mass spectrometry |
| MALDI MSI | = | matrix-assisted laser desorption/ionization mass spectrometry imaging |
| MAC | = | membrane attack complex |
| CD36 | = | platelet glycoprotein 4 |
| SAA | = | serum amyloid A |
| SAP | = | serum amyloid P component |
| SFA | = | subcutaneous fat aspirate |
| MS/MS | = | tandem mass spectrometry. |
Supplemental Material
Download MS Excel (490.3 KB)Supplemental Material
Download PDF (571.5 KB)Supplemental Material
Download PNG Image (2.3 MB)
Disclosure statement
The authors declare no conflict of interest.
Additional information
Funding
References
- Adachi M, Kitamura M, Muta K, Maekawa A, Uramatsu T, Tadokoro M, Funakoshi S, Hisano S, Kuwahara N, Shimizu A, et al. 2020. IgM monoclonal gammopathy with heavy-and-light-chain amyloidosis resembling fibrillary glomerulonephritis determined by tandem mass spectrometry: a case report. BMC Nephrol. 21:195.
- Alexander MP, Dasari S, Vrana JA, Riopel J, Valeri AM, Markowitz GS, Hever A, Bijol V, Larsen CP, Cornell LD, et al. 2018. Congophilic fibrillary glomerulonephritis: a case series. Am J Kidney Dis. 72:325–336. eng.
- Ancsin JB, Kisilevsky R. 1999. The heparin/heparan sulfate-binding site on apo-serum amyloid A. J Biol Chem. 274:7172–7181.
- Baranova IN, Bocharov AV, Vishnyakova TG, Kurlander R, Chen Z, Fu D, Arias IM, Csako G, Patterson AP, Eggerman TL. 2010. CD36 is a novel Serum Amyloid A (SAA) receptor mediating SAA binding and SAA-induced signaling in human and rodent cells. J Biol Chem. 285:8492–8506. eng.
- Baumgart J-V, Stuhlmann-Laeisz C, Hegenbart U, Nattenmüller J, Schönland S, Krüger S, Behrens H-M, Röcken C. 2018. Local vs. systemic pulmonary amyloidosis-impact on diagnostics and clinical management. Virchows Arch. 473:627–637. eng.
- Benson MD, Buxbaum JN, Eisenberg DS, Merlini G, Saraiva MJM, Sekijima Y, Sipe JD, Westermark P. 2020. Amyloid nomenclature 2020: update and recommendations by the International Society of Amyloidosis (ISA) nomenclature committee. Amyloid. 27:217–222.
- Bogie JFJ, Dierckx T, Erens C, Grajchen E, Haidar M, Hardonnière K, Hendriks JJA, Hendrix S, Kerdine-Römer S, Broeckhoven JV, et al. 2020. CD36-mediated uptake of myelin debris by macrophages and microglia reduces neuroinflammation. J Neuroinflammation. 17:224. eng.
- Brambilla F, Lavatelli F, Di Silvestre D, Valentini V, Palladini G, Merlini G, Mauri P. 2013. Shotgun protein profile of human adipose tissue and its changes in relation to systemic amyloidoses. J Proteome Res. 12:5642–5655.
- Brambilla F, Lavatelli F, Di Silvestre D, Valentini V, Rossi R, Palladini G, Obici L, Verga L, Mauri P, Merlini G. 2012. Reliable typing of systemic amyloidoses through proteomic analysis of subcutaneous adipose tissue. Blood. 119:1844–1847.
- Bristow CL, Boackle RJ. 1986. Evidence for the binding of human serum amyloid P component to C1q and Fabγ. Mol Immunol. 23(10):1045–1052.
- Butler PJG, Tennent GA, Pepys MB. 1990. Pentraxin-chromatin interactions: serum amyloid P component specifically displaces H1-type histones and solubilizes native long chromatin. J Exp Med. 172:13–18. eng.
- Chiti F, Dobson CM. 2017. Protein misfolding, amyloid formation, and human disease: a summary of progress over the last decade. Annu Rev Biochem. 86:27–68.
- Cohen AD, Comenzo RL. 2010. Systemic light-chain amyloidosis: advances in diagnosis, prognosis, and therapy. Hematology Am Soc Hematol Educ Program. 2010:287–294. eng.
- Coker AR, Purvis A, Baker D, Pepys MB, Wood SP. 2000. Molecular chaperone properties of serum amyloid P component. FEBS Lett. 473(2):199–202.
- Comenzo RL. 2014. LECT2 makes the amyloid list. Blood. 123:1436–1437.
- Dallacasagrande V, Hajjar KA. 2020. Annexin A2 in inflammation and host defense. Cells. 9(6):1499.
- Damy T, Plante-Bordeneuve V, Dogan A. 2014. Characterization of untyped cardiac amyloidosis by mass spectrometry in a patient with Gly6Ser transthyretin polymorphism in fatal cardiogenic shock. Arch Cardiovasc Dis. 107:706–708.
- Dasari S, Alexander MP, Vrana JA, Theis JD, Mills JR, Negron V, Sethi S, Dispenzieri A, Highsmith WE, Jr., Nasr SH, et al. 2018. DnaJ heat shock protein family B member 9 is a novel biomarker for fibrillary GN. J Am Soc Nephrol. 29:51–56.
- Dasari S, Amin MS, Kurtin PJ, Vrana JA, Theis JD, Grogg KL, Alexander MP, Nasr SH, Fervenza FC, Leung N, et al. 2016. Clinical, biopsy, and mass spectrometry characteristics of renal apolipoprotein A-IV amyloidosis. Kidney Int. 90:658–664.
- Dasari S, Theis JD, Vrana JA, Rech KL, Dao LN, Howard MT, Dispenzieri A, Gertz MA, Hasadsri L, Highsmith WE, et al. 2020. Amyloid typing by mass spectrometry in clinical practice: a comprehensive review of 16,175 samples. Mayo Clin Proc. 95(9):1852–1864.
- Dobri A-M, Dudău M, Enciu A-M, Hinescu ME. 2021. CD36 in alzheimer's disease: an overview of molecular mechanisms and therapeutic targeting. Neuroscience. 453:301–311.
- Dogan A. 2017. Amyloidosis: insights from proteomics. Annu Rev Pathol Mech Dis. 12:277–304.
- Doll S, Dreßen M, Geyer PE, Itzhak DN, Braun C, Doppler SA, Meier F, Deutsch M-A, Lahm H, Lange R, et al. 2017. Region and cell-type resolved quantitative proteomic map of the human heart. Nat Commun. 8:1469.
- D’Souza A, Theis J, Quint P, Kyle R, Gertz M, Zeldenrust S, Vrana J, Dogan A, Dispenzieri A. 2013. Exploring the amyloid proteome in immunoglobulin-derived lymph node amyloidosis using laser microdissection/tandem mass spectrometry. Am J Hematol. 88:577–580.
- D’Souza A, Theis JD, Vrana JA, Dogan A. 2014. Pharmaceutical amyloidosis associated with subcutaneous insulin and enfuvirtide administration. Amyloid. 21:71–75.
- Efebera YA, Sturm A, Baack EC, Hofmeister CC, Satoskar A, Nadasdy T, Nadasdy G, Benson DM, Gillmore JD, Hawkins PN, et al. 2014. Novel gelsolin variant as the cause of nephrotic syndrome and renal amyloidosis in a large kindred. Amyloid. 21:110–112.
- Emsley J, White HE, O'Hara BP, Oliva G, Srinivasan N, Tickle IJ, Blundell TL, Pepys MB, Wood SP. 1994. Structure of pentameric human serum amyloid P component. Nature. 367:338–345.
- Freudenthaler S, Hegenbart U, Schönland S, Behrens H-M, Krüger S, Röcken C. 2016. Amyloid in biopsies of the gastrointestinal tract-a retrospective observational study on 542 patients. Virchows Arch. 468(5):569–577.
- Gabelica V, Shvartsburg AA, Afonso C, Barran P, Benesch JLP, Bleiholder C, Bowers MT, Bilbao A, Bush MF, Campbell JL, et al. 2019. Recommendations for reporting ion mobility Mass Spectrometry measurements. Mass Spectrom Rev. 38:291–320.
- Garnier S. 2018. viridis: Default Color Maps from 'matplotlib'. [place unknown]: [publisher unknown]. R package version 0.5.1; [accessed 2020 Oct 4]. https://cran.r-project.org/package=viridis.
- Glatz JFC, Luiken JJFP. 2018. Dynamic role of the transmembrane glycoprotein CD36 (SR-B2) in cellular fatty acid uptake and utilization. J Lipid Res. 59:1084–1093.
- Greene MJ, Sam F, Soo Hoo PT, Patel RS, Seldin DC, Connors LH. 2011. Evidence for a functional role of the molecular chaperone clusterin in amyloidotic cardiomyopathy. Am J Pathol. 178:61–68.
- Gu Z, Eils R, Schlesner M. 2016. Complex heatmaps reveal patterns and correlations in multidimensional genomic data. Bioinformatics. 32:2847–2849.
- Gu Z, Gu L, Eils R, Schlesner M, Brors B. 2014. circlize implements and enhances circular visualization in R. Bioinformatics. 30:2811–2812.
- Hajishengallis G, Reis ES, Mastellos DC, Ricklin D, Lambris JD. 2017. Novel mechanisms and functions of complement. Nat Immunol. 18:1288–1298.
- Hashimoto T, Serrano-Pozo A, Hori Y, Adams KW, Takeda S, Banerji AO, Mitani A, Joyner D, Thyssen DH, Bacskai BJ, et al. 2012. Apolipoprotein E, especially apolipoprotein E4, increases the oligomerization of amyloid β peptide. J Neurosci. 32(43):15181–15192.
- Helder MRK, Schaff HV, Nishimura RA, Gersh BJ, Dearani JA, Ommen SR, Mereuta OM, Theis JD, Dogan A, Edwards WD. 2014. Impact of incidental amyloidosis on the prognosis of patients with hypertrophic cardiomyopathy undergoing septal myectomy for left ventricular outflow tract obstruction. Am J Cardiol. 114(9):1396–1399.
- Horike K, Takeda A, Tsujita M, Goto N, Watarai Y, Uchida K, Katayama A, Nishihira M, Shimizu A, Nozu K, et al. 2018. Two novel APOA1 gene mutations in a Japanese renal transplant recipient with recurrent apolipoprotein A-I related amyloidosis. Nephrology. 23 (Suppl 2):17–21.
- Ikegawa M, Nirasawa T, Kakuda N, Miyasaka T, Kuzuhara Y, Murayama S, Ihara Y. 2019. Visualization of Amyloid β deposits in the human brain with matrix-assisted laser desorption/ionization imaging mass spectrometry. J Vis Exp.
- Jasra SK, Badian C, Macri I, Ra P. 2012. Recognition of early myocardial infarction by immunohistochemical staining with cardiac troponin-I and complement C9. J Forensic Sci. 57(6):1595–1600.
- Jenkins CP, Cardona DM, Bowers JN, Oliai BR, Allan RW, Normann SJ. 2010. The utility of C4d, C9, and troponin T immunohistochemistry in acute myocardial infarction. Arch Pathol Lab Med. 134:256–263.
- Ke PC, Zhou R, Serpell LC, Riek R, Knowles TPJ, Lashuel HA, Gazit E, Hamley IW, Davis TP, Fändrich M, et al. 2020. Half a century of amyloids: past, present and future. Chem Soc Rev. 49:5473–5509.
- Kedia N, Arhzaouy K, Pittman SK, Sun Y, Batchelor M, Weihl CC, Bieschke J. 2019. Desmin forms toxic, seeding-competent amyloid aggregates that persist in muscle fibers. Proc Natl Acad Sci USA. 116:16835–16840.
- Khan T, Muise ES, Iyengar P, Wang ZV, Chandalia M, Abate N, Zhang BB, Bonaldo P, Chua S, Scherer PE. 2009. Metabolic dysregulation and adipose tissue fibrosis: role of collagen VI. Mol Cell Biol. 29:1575–1591.
- Kisilevsky R. 2000. The relation of proteoglycans, serum amyloid P and apo E to amyloidosis current status, 2000. Amyloid. 7:23–25.
- Klein CJ, Vrana JA, Theis JD, Dyck PJ, Dyck PJB, Spinner RJ, Mauermann ML, Bergen HR, III, Zeldenrust SR, Dogan A. 2011. Mass spectrometric-based proteomic analysis of amyloid neuropathy type in nerve tissue. Arch Neurol. 68:195–199.
- Klimtchuk ES, Prokaeva T, Frame NM, Abdullahi HA, Spencer B, Dasari S, Cui H, Berk JL, Kurtin PJ, Connors LH, et al. 2018. Unusual duplication mutation in a surface loop of human transthyretin leads to an aggressive drug-resistant amyloid disease. Proc Natl Acad Sci USA. 115:E6428–E6436.
- Kourelis TV, Dasari SS, Dispenzieri A, Maleszewski JJ, Redfield MM, Fayyaz AU, Grogan M, Ramirez-Alvarado M, Abou Ezzeddine OF, McPhail ED. 2020. A proteomic atlas of cardiac amyloid plaques. CardioOncology. 2:632–643.
- Krance SH, Wu C-Y, Zou Y, Mao H, Toufighi S, He X, Pakosh M, Swardfager W. 2019. The complement cascade in Alzheimer's disease: a systematic review and meta-analysis. Mol Psychiatry.
- Lavatelli F, Perlman DH, Spencer B, Prokaeva T, McComb ME, Théberge R, Connors LH, Bellotti V, Seldin DC, Merlini G, et al. 2008. Amyloidogenic and associated proteins in systemic amyloidosis proteome of adipose tissue. Mol Cell Proteomics. 7:1570–1583.
- Lee K-W, Lee D-H, Son H, Kim Y-S, Park J-Y, Roh G-S, Kim H-J, Kang S-S, Cho G-J, Choi W-S. 2009. Clusterin regulates transthyretin amyloidosis. Biochem Biophys Res Commun. 388:256–260.
- Lepelletier F-X, Mann DMA, Robinson AC, Pinteaux E, Boutin H. 2017. Early changes in extracellular matrix in Alzheimer's disease. Neuropathol Appl Neurobiol. 43:167–182.
- Lundgren DH, Hwang S-I, Wu L, Han DK. 2014. Role of spectral counting in quantitative proteomics. Expert Rev Proteomics. 7:39–53.
- Mahmood S, Bridoux F, Venner CP, Sachchithanantham S, Gilbertson JA, Rowczenio D, Wagner T, Sayed R, Patel K, Fontana M, et al. 2015. Natural history and outcomes in localised immunoglobulin light-chain amyloidosis: a long-term observational study. Lancet Haematol. 2(6):e241–e250.
- Mangione PP, Mazza G, Gilbertson JA, Rendell NB, Canetti D, Giorgetti S, Frenguelli L, Curti M, Rezk T, Raimondi S, et al. 2017. Increasing the accuracy of proteomic typing by decellularisation of amyloid tissue biopsies. J Proteomics. 165:113–118.
- Mantovani A, Garlanda C, Doni A, Bottazzi B. 2008. Pentraxins in innate immunity: from C-reactive protein to the long pentraxin PTX3. J Clin Immunol. 28:1–13.
- Martinez JR, Dhawan A, Farach-Carson MC. 2018. Modular proteoglycan perlecan/HSPG2: mutations, Phenotypes, and Functions. Genes. 9(11):556.
- Merlini G, Bellotti V. 2003. Molecular mechanisms of amyloidosis. N Engl J Med. 349:583–596.
- Merlini G, Seldin DC, Gertz MA. 2011. Amyloidosis: Pathogenesis and new therapeutic options. J Clin Oncol. 29:1924–1933.
- Miller DV, Dogan A, Sethi S. 2010. New-onset proteinuria with massive amorphous glomerular deposits. Am J Kidney Dis. 55:749–754.
- Müller-Eberhard HJ. 1985. The killer molecule of complement. J Invest Dermatol. 85:47s–52s.
- Narayan P, Orte A, Clarke RW, Bolognesi B, Hook S, Ganzinger KA, Meehan S, Wilson MR, Dobson CM, Klenerman D. 2011. The extracellular chaperone clusterin sequesters oligomeric forms of the amyloid-β(1-40) peptide. Nat Struct Mol Biol. 19:79–83.
- Nasr SH, Dasari S, Hasadsri L, Theis JD, Vrana JA, Gertz MA, Muppa P, Zimmermann MT, Grogg KL, Dispenzieri A, et al. 2017. Novel type of renal amyloidosis derived from apolipoprotein-CII. J Am Soc Nephrol. 28:439–445.
- Nasr SH, Dogan A, Larsen CP. 2015. Leukocyte cell-derived chemotaxin 2-associated amyloidosis: a recently recognized disease with distinct clinicopathologic characteristics. Clin J Am Soc Nephrol. 10:2084–2093.
- Noursadeghi M, Bickerstaff MC, Gallimore JR, Herbert J, Cohen J, Pepys MB. 2000. Role of serum amyloid P component in bacterial infection: Protection of the host or protection of the pathogen. Proc Natl Acad Sci USA. 97:14584–14589.
- Oskarsson ME, Paulsson JF, Schultz SW, Ingelsson M, Westermark P, Westermark GT. 2015. In vivo seeding and cross-seeding of localized amyloidosis: a molecular link between type 2 diabetes and alzheimer disease. Am J Pathol. 185(3):834–846.
- Otaka Y, Nakazato Y, Tsutsui T, Tamura J. 2019. Cardiac involvement in heavy and light chain amyloidosis: a case report and literature review. Medicine. 98:e17999.
- Pepys MB, Booth DR, Hutchinson WL, Gallimore JR, Collins IM, Hohenester E. 1997. Amyloid P component. A Critical Review. Amyloid. 4(4):274–295.
- Pepys MB, Butler PJG. 1987. Serum amyloid P component is the major calcium-dependent specific DNA binding protein of the serum. Biochem Biophys Res Commun. 148(1):308–313.
- Pepys MB, Dyck RF, Fc de B, Skinner M, Cohen AS. 1979. Binding of serum amyloid P-component (SAP) by amyloid fibrils. Clin Exp Immunol. 38:284–293.
- Pepys MB, Herbert J, Hutchinson WL, Tennent GA, Lachmann HJ, Gallimore JR, Lovat LB, Bartfai T, Alanine A, Hertel C, et al. 2002. Targeted pharmacological depletion of serum amyloid P component for treatment of human amyloidosis. Nature. 417:254–259.
- Pepys MB. 2018. The pentraxins 1975-2018: serendipity, diagnostics and drugs. Front Immunol. 9:2382.
- Picken MM. 2015. Proteomics and mass spectrometry in the diagnosis of renal amyloidosis. Clin Kidney J. 8(6):665–672.
- Poulsen ET, Pedersen KW, Marzeda AM, Enghild JJ. 2017. Serum amyloid P Component (SAP) interactome in human plasma containing physiological calcium levels. Biochemistry. 56:896–902.
- Pozzi A, Yurchenco PD, Iozzo RV. 2017. The nature and biology of basement membranes. Matrix Biol. 57-58:1–11.
- Puchtler H, Sweat F, Levine M. 1962. On the binding of congo red by amyloid. J Histochem Cytochem. 10(3):355–364.
- R Core Team 2020. R: A language and environment for statistical computing. R 4.0.0. Vienna, Austria: R Foundation for Statistical Computing. https://www.r-project.org/.
- Ravindran A, Grogg KL, Domaas DA, Go RS. 2016. Polyclonal localized light chain amyloidosis—a distinct entity? Clin Lymphoma Myeloma Leuk. 16:588–592.
- Renner B, Tong HH, Laskowski J, Jonscher K, Goetz L, Woolaver R, Hannan J, Li YX, Hourcade D, Pickering MC, et al. 2016. Annexin A2 enhances complement activation by inhibiting factor H. J Immunol. 196:1355–1365.
- Richards DB, Cookson LM, Barton SV, Liefaard L, Lane T, Hutt DF, Ritter JM, Fontana M, Moon JC, Gillmore JD, et al. 2018. Repeat doses of antibody to serum amyloid P component clear amyloid deposits in patients with systemic amyloidosis. Sci Transl Med. 10(422):eaan3128.
- Richards DB, Cookson LM, Berges AC, Barton SV, Lane T, Ritter JM, Fontana M, Moon JC, Pinzani M, Gillmore JD, et al. 2015. Therapeutic clearance of amyloid by antibodies to serum amyloid P component. N Engl J Med. 373:1106–1114.
- Ricklin D, Hajishengallis G, Yang K, Lambris JD. 2010. Complement: a key system for immune surveillance and homeostasis. Nat Immunol. 11:785–797.
- Rodriguez FJ, Gamez JD, Vrana JA, Theis JD, Giannini C, Scheithauer BW, Parisi JE, Lucchinetti CF, Pendlebury WW, Bergen HR, III, et al. 2008. Immunoglobulin derived depositions in the nervous system: novel mass spectrometry application for protein characterization in formalin-fixed tissues. Lab Invest. 88:1024–1037.
- Rowczenio D, Dogan A, Theis JD, Vrana JA, Lachmann HJ, Wechalekar AD, Gilbertson JA, Hunt T, Gibbs SDJ, Sattianayagam PT, et al. 2011. Amyloidogenicity and clinical phenotype associated with five novel mutations in apolipoprotein A-I. Am J Pathol. 179:1978–1987.
- Sethi S, Dasari S, Plaisier E, Ronco P, Nasr SH, Brocheriou I, Theis JD, Vrana JA, Zimmermann MT, Quint PS, et al. 2018. Apolipoprotein CII amyloidosis associated with p.Lys41Thr mutation. Kidney Int Rep. 3:1193–1201.
- Sethi S, Fervenza FC, Miller D, Norby S, Leung N. 2010. Recurrence of amyloidosis in a kidney transplant. Am J Kidney Dis. 56:394–398.
- Sethi S, Theis JD, Leung N, Dispenzieri A, Nasr SH, Fidler ME, Cornell LD, Gamez JD, Vrana JA, Dogan A. 2010. Mass spectrometry-based proteomic diagnosis of renal immunoglobulin heavy chain amyloidosis. Clin J Am Soc Nephrol. 5:2180–2187.
- Sethi S, Theis JD, Quint P, Maierhofer W, Kurtin PJ, Dogan A, Highsmith EW. Jr. 2013. Renal amyloidosis associated with a novel sequence variant of gelsolin. Am J Kidney Dis. 61(1):161–166.
- Sethi S, Theis JD, Shiller SM, Nast CC, Harrison D, Rennke HG, Vrana JA, Dogan A. 2012. Medullary amyloidosis associated with apolipoprotein A-IV deposition. Kidney Int. 81:201–206.
- Sethi S, Theis JD, Vrana JA, Fervenza FC, Sethi A, Qian Q, Quint P, Leung N, Dogan A, Nasr SH. 2013. Laser microdissection and proteomic analysis of amyloidosis, cryoglobulinemic GN, fibrillary GN, and immunotactoid glomerulopathy. Clin J Am Soc Nephrol. 8:915–921.
- Sidiqi MH, McPhail ED, Theis JD, Dasari S, Vrana JA, Drosou ME, Leung N, Hayman S, Rajkumar SV, Warsame R, et al. 2019. Two types of amyloidosis presenting in a single patient: a case series. Blood Cancer J. 9(3):1924.
- Sjöberg AP, Trouw LA, Blom AM. 2009. Complement activation and inhibition: a delicate balance. Trends Immunol. 30:83–90.
- Sridharan M, Highsmith WE, Kurtin PJ, Zimmermann MT, Theis JD, Dasari S, Dingli D. 2018. A patient with hereditary ATTR and a novel AGel p.Ala578Pro amyloidosis. Mayo Clin Proc. 93:1678–1682.
- Stuhlmann-Laeisz C, Schönland SO, Hegenbart U, Oschlies I, Baumgart J-V, Krüger S, Röcken C. 2019. AL amyloidosis with a localized B cell neoplasia. Virchows Arch. 474:353–363.
- Sun W, Sun J, Zou L, Shen K, Zhong D, Zhou D, Sun W, Li J. 2015. The successful diagnosis and typing of systemic amyloidosis using a microwave-assisted filter-aided fast sample preparation method and LC/MS/MS analysis. PLoS One. 10:e0127180.
- Szklarczyk D, Gable AL, Lyon D, Junge A, Wyder S, Huerta-Cepas J, Simonovic M, Doncheva NT, Morris JH, Bork P, et al. 2019. STRING v11: Protein-protein association networks with increased coverage, supporting functional discovery in genome-wide experimental datasets. Nucleic Acids Res. 47:D607–D613.
- Theis JD, Dasari S, Vrana JA, Kurtin PJ, Dogan A. 2013. Shotgun-proteomics-based clinical testing for diagnosis and classification of amyloidosis. J Mass Spectrom. 48:1067–1077.
- UniProt Consortium. 2019. UniProt: a worldwide hub of protein knowledge. Nucleic Acids Res. 47:D506–D515.
- Vrana JA, Gamez JD, Madden BJ, Theis JD, Bergen HR, III, Dogan A. 2009. Classification of amyloidosis by laser microdissection and mass spectrometry-based proteomic analysis in clinical biopsy specimens. Blood. 114:4957–4959.
- Vrana JA, Theis JD, Dasari S, Mereuta OM, Dispenzieri A, Zeldenrust SR, Gertz MA, Kurtin PJ, Grogg KL, Dogan A. 2014. Clinical diagnosis and typing of systemic amyloidosis in subcutaneous fat aspirates by mass spectrometry-based proteomics. Haematologica. 99:1239–1247.
- Wickham H, Averick M, Bryan J, Chang W, McGowan L, François R, Grolemund G, Hayes A, Henry L, Hester J, et al. 2019. Welcome to the Tidyverse. JOSS. 4(43):1686.
- Wickham H. 2016. ggplot2: elegant graphics for data analysis. Cham: Springer. p. 140. p. (Use R!). https://ggplot2.tidyverse.org/.
- Wilson MR, Yerbury JJ, Poon S. 2008. Potential roles of abundant extracellular chaperones in the control of amyloid formation and toxicity. Mol Biosyst. 4:42–52.
- Winter M, Tholey A, Kristen A, Röcken C. 2017. MALDI mass spectrometry imaging: a novel tool for the identification and classification of amyloidosis. Proteomics. 17(22):1700236.
- Winter M, Tholey A, Krüger S, Schmidt H, Röcken C. 2015. MALDI-mass spectrometry imaging identifies vitronectin as a common constituent of amyloid deposits. J Histochem Cytochem. 63:772–779.
- Wisniewski T, Drummond E. 2020. APOE-amyloid interaction: therapeutic targets. Neurobiol Dis. 138:104784.
- Yang X, Okamura DM, Lu X, Chen Y, Moorhead J, Varghese Z, Ruan XZ. 2017. CD36 in chronic kidney disease: novel insights and therapeutic opportunities. Nat Rev Nephrol. 13:769–781.
- Yerbury JJ, Poon S, Meehan S, Thompson B, Kumita JR, Dobson CM, Wilson MR. 2007. The extracellular chaperone clusterin influences amyloid formation and toxicity by interacting with prefibrillar structures. Faseb J. 21:2312–2322.