
ABSTRACT
Previous neoichnological studies with arthropods, especially arachnids, have often conducted experiments with only a small number of trackways produced in a subset of subaerial conditions. Thus, we conducted a comprehensive neoichnological study of scorpions (Hadrurus arizonensis), tarantulas (Grammostola rosea), and crayfish (Procambarus clarkii), under various moisture levels (dry, damp, wet drying, wet saturated, and subaqueous [or wading]) and horizontal, shallow, and steep slope angles. The invertebrates made a total of 473 trackway runs resulting in 489 symmetric trackway segments that were characterized and digitally measured. We analyzed the trackways using trackway parameter trend diagrams and non-metric multidimensional scaling (N-MDS) visualizations to compare trackway morphology among the sand moisture conditions. Results generally show imprints become progressively smaller, with more dotted multifid imprints going from loose to stiff sand. N-MDS showed trackway morphology overlapped among some conditions, including those with disparate water content (e.g. dry and wet saturated sand, or subaqueous and wet drying sand). Additionally, trackways consisted usually of a four-imprint series, though species- and condition-specific exceptions were found. Interestingly, the scorpions rarely dragged their metasomas, while the crayfish always dragged their tail fan except sometimes underwater. Our neoichnological photos and quantitative dataset provide a basis for future comparative ichnological studies.
Introduction
Neoichnology is the subset of ichnology that involves the study of modern (recent) animal traces. Ichnological research seeks to interpret trace producer behavior, determine the most likely animal producer of a trace fossil, and determine the most likely substrate condition at the location and time of trace formation. In order to accomplish this last purpose, neoichnological experiments with living animals under different substrate conditions must be performed to serve as a standard for comparison. Over the years, comparative ichnological methods have evolved from claims of broad visual similarity based on a handful of characteristics, to the use of a small number of univariate measurements, to a more comprehensive qualitative and quantitative univariate or multivariate analysis using a larger number of morphological trackway parameters, made possible by the advancement of computing technology.
The conclusions obtained from comparative ichnological studies are only as good as the quality and breadth of the neoichnological experiments underlying them. If few experimental trials are run, the small sample size may exclude certain behaviors and their resulting trace morphologies. On the other hand, if certain conditions (e.g. sand with higher water content) are not tested, trace morphology in those conditions remains unknown and morphological similarities with other conditions may be missed. Thus, new neoichnological studies should build upon previous studies by using a wider range of experimental conditions and producers, and acquiring larger sample sizes to not only capture a wider range of behaviors displayed in the various conditions tested, but also facilitate multivariate analysis, which may provide more information about the condition(s) in which a fossil or recent trackway formed.
The focus of this study is to conduct a quantitative, neoichnological analysis of 489 symmetric experimental trackway segments produced by scorpions, tarantulas, and crayfish in dry, damp, wet, and subaqueous conditions at horizontal, shallow, and steep slope angles. For comprehensiveness, we tested arachnids in wet saturated and subaqueous (or wading) conditions to respectively represent a sand dune slope with a high water table and (e.g. storm-induced) flooding event causing at least partially submerged dunes, in which flooded out, air-breathing animals would need to move up to the drier ground to survive. The experimental results of this study will enable detailed ichnological comparisons with similar fossil or recent trackways where scorpions, tarantulas, or crayfish are considered possible modern analogs or actual producers.
Previous invertebrate ichnological work
This section chronicles previously conducted neoichnological trackway studies with scorpions, tarantulas (or other mygalomorphs), and crayfish. For each study summarized, we examined the number of experiments performed, the substrate conditions used (and how they were made), the analytical methods used, and their results.
Brady (Citation1939, Citation1947, Citation1961) performed an unspecified (but apparently small) number of comparative neoichnological experiments, finding that scorpions only made visible trackways in dry sand, made invisible trackways on sand dampened with a spray bottle, and made no movement at all on sand that was too wet. Alf (Citation1968) conducted an unspecified (but apparently small) a number of tarantula, trapdoor, and wolf spider experimental trackways made by walking with inked feet on paper instead of on sand. Manton (Citation1973, Pl. 2) had the scorpions Euscorpius carpathicus and Buthus australis walk on smoked paper as well.
Sadler (Citation1993) conducted experiments with a scorpion (16 runs) and a tarantula (11 runs) on a runway with flat, dry sand with a 25° sloped dune in the middle, and also a flat portion that had the sand moistened with a spray bottle. Sadler recognized bifurcated imprints opening in the direction of travel, elongate ‘tic’ marks produced as the animal’s foot was dragged forward, and that the shape and orientation of series can vary in a single trackway. Sadler also found that imprints were bigger, deeper, and more amorphous in dry sand with avalanche structures obscuring detail, while those made in damp sand were small and sharp; however, sand moistened too much balled up on the animal or no imprints were left. It is not clear the amount of moisture sprayed on the sand though, and only one half of the photo shows imprints made on ‘wet’ sand (Sadler, Citation1993). No detail is provided on the effect of slope aside from noting the imprints were not as ‘clear’ as on the flat surface, but still ‘discernible, if not perfectly distinct.’
Braddy (Citation1995) conducted unspecified neoichnological work with spiders, scorpions, and whip scorpions; however, Braddy did not specify the sand conditions tested. In a thesis, Azain (Citation2006) described experiments (N ≥ 10) with African emperor scorpions and pink-toed tarantulas on dry and damp sand, sometimes on a 20° slope, and found no imprints were left on damp or slightly moist sand (too cohesive).
One of the more comprehensive neoichnological studies was performed by Davis et al. (Citation2007) with various arthropods, including emperor scorpions and Chilean rose tarantulas, using a range of grain sizes and two experimental protocols to produce a total of at least 83 trackways. The first (subaerial eolian) protocol involved spraying dry sand with increasing amounts of water to create a ‘dryground to dampground’ moisture gradient, and the second (tidal flat or floodplain) protocol involved flooding sand and siphoning off the water and waiting increasing lengths of time to create a looseground to stiffground gradient. Some of their key findings include (1) that moisture level has a greater affect than grain size on trackway morphology, (2) that increasing stiffness of the substrate caused by either additional dampening (first protocol) or additional drying time (second protocol) resulted in narrower imprints and track rows, or a decreasing amount of visible imprints forming at all, and (3) trackways formed in dry sand have low preservation potential, which increased with added moisture and clay content. No trackways were made under subaqueous/wading or sloped conditions.
Fairchild and Hasiotis (Citation2011) conducted neoichnological experiments (N ≥ 22) with crayfish in which they varied the grain size (silt and clay, very fine, fine, and medium-grained sand), moisture (dry, damp, saturated, and subaqueous), and incline (0° and 10° in subaerial trials only though). With regards to grain size, they found that with the same moisture levels, trackways were morphologically similar, but imprint detail decreased with increasing grain size, corroborating the findings of Davis et al. (Citation2007). Additionally, they discovered that saturated and subaqueous trackways in silt and clay could not support the weight of crayfish, resulting in mostly disturbed sediment.
Schmerge et al. (Citation2013) conducted experiments (N = 9) with vinegaroons (arachnids with three pairs of walking legs) on dry and moist (two spray levels) sand of fine, medium, and coarse textures. Vinegaroon trackways consist of staggered or alternately symmetrical, triplet imprint series with no tail drag. In dry sand, imprints are largest and crescent shaped, while the size decreases and imprints become more circular as the sand becomes more damp and cohesive. Although they relied on previous studies for comparison, they described how scorpion and tarantula trackway series could be poorly preserved such that only three imprints are clearly visible; if so, they concluded these trackway producers can be differentiated from the three-imprint trackway series of vinegaroons by noting that the interior altitude of the series triangle shape points obliquely outward in vinegaroon trackways but parallel to the direction of motion with scorpion and tarantula trackways (Schmerge et al., Citation2013). They recommended future neoichnological work to be more systematic, and to test for higher moisture levels obtained by volumetric methods rather than spraying the surface.
In summary, previous relevant neoichnological studies were limited by having only about one trackway per experimental combination and experimenting with mostly arachnids in a subset of subaerial conditions (no experiments done with saturated or subaqueous conditions). This study seeks to build on previous neoichnological experimental work, especially that of Davis et al. (Citation2007) and Fairchild and Hasiotis (Citation2011), by performing a comprehensive, methodical neoichnological study utilizing the largest set of neoichnological experimental trials to date. Scorpions, tarantulas, and crayfish produced over four hundred experimental trackways. We focused on water content and slope as the most important independent variables while maintaining a constant sediment texture. As terrestrial invertebrates, scorpions and tarantulas would typically be expected to make trackways in dry and moist substrates, while crayfish as aquatic invertebrates would typically be expected to make trackways in subaqueous sediments. However, the normal occurrence of an animal does not preclude the possibility that it made traces in unusual conditions, which may have good preservation potential. As discussed above, for more comprehensive experimentation to undergird valid comparative ichnological deductions, we tested these invertebrates under conditions they would not usually experience. With scorpions and tarantulas, for example, in addition to dry and damp sand we included conditions with a higher water content to replicate a submerged sand setting, a rainy or immediately post-inundation wet saturated setting, and a wet drying setting, which would occur shortly after the rain stopped and/or the water table dropped. Significantly, our analysis is highly quantitative, making it the first study to not only make univariate descriptive comparisons, but also use a multivariate approach for comparing sand moisture conditions.
Methods
Neoichnological experimental setup
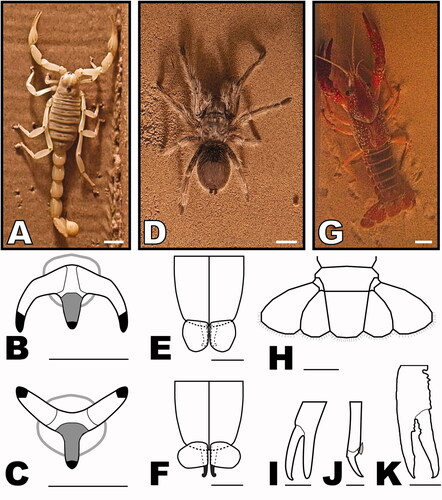
Neoichnological laboratory experiments were conducted during parts of two summers (totaling over 90 h of experimental work) with six Arizona desert hairy scorpions (Hadrurus arizonensis, weighing ∼ 6–7 g), two Chilean rose tarantulas (Grammostola rosea, weighing ∼ 6 g), and four red swamp crayfish (Procambarus clarkii, weighing ∼ 27 g). The types of invertebrates used were based on previous research, with the exact species used based on obtainability. The invertebrates and their feet were photographed and illustrated accordingly (). The invertebrates were obtained from the Department of Earth and Biological Sciences at Loma Linda University, local pet stores, or, in the case of three scorpions, collected locally near Palm Springs, CA (33° 52′ 8″ N, 116° 34′ 43″ W).
Figure 1. Invertebrates used in neoichnological experimentation and illustrations of their feet. (A–C) The scorpion, Hadrurus arizonensis, with illustrations showing the walking legs’ pretarsus, ungues, and dactyl (in grey) in (B) lateral end view, and (C) ventral end view. (D–F) The tarantula, Grammostola rosea, with illustrations showing a distal tarsal tip and tarsal claws in ventral view with (E) the tarsal claws retracted and covered by claw tufts, and (F) the tarsal claws depressed and the claw tufts rotated out on both sides. (G–K) The crayfish, Procambarus clarkii, with illustrations showing (H) the tail fan with a central telson flanked by two pairs of uropods, (I) the small chelae on the second and third pereiopods, (J) the dactylopodite (=pretarsus) and most of the propodite (=tarsus) on the fourth and fifth pereiopods, and (K) the dactylopodite and propodite of the cheliped (largest claw). Scale bars are 10 mm (A, D, G, H, K), 1 mm (B, C), and 3 mm (E, F, I, J).
The sediment used in all experiments was fine to very fine sand. The sand was originally collected from the southeast part of the Imperial Sand Dunes Recreation Area, CA, just north of the Mexican border (32° 46′ 4″ N, 114° 50′ 54″ W). The sand was rinsed with DI water multiple times, dried, and then sieved into fine (125–250 μm) and finer (< 125 μm) fractions that were recombined in a 40:60 mixture, respectively, to provide an optimum texture for preservation of imprint details based on previous neoichnological studies (Davis et al., Citation2007; Fairchild & Hasiotis, Citation2011). The sand used in subaqueous and wet trials was additionally sieved to remove at least some ultra-fine (< 63 μm) particles, which would cloud the water. Aluminum sheet cake pans (originally 14 in. × 22 in. × 2 in. or 35.6 cm × 55.9 cm × 5.1 cm, and 11 in. × 15 in. × 2 in. or 28.6 cm × 38.1 cm × 5.1 cm) were used to hold the sand during trackway-making experiments. The pans were placed in glass aquariums (the side lips of the pans were sawn off to make them fit) to prevent animals from escaping during trials. The sand layer in the pans was about 1.5–1.75 in. or about 3.8–4.4 cm thick.
Experimental conditions involved various combinations of water content and slope angle. To simplify comparison among the possible experimental sand water content + slope combinations, the trackways were grouped in five ‘target’ conditions representing different water content levels: dry, damp, wet drying, wet saturated, and subaqueous. Each of the five conditions included level, shallow, and steep slopes so that slope was incorporated as variation within a given condition. The methods for creating these sand water content conditions is detailed below.
For sloped trials, two supporting structures made out of wood (for drier conditions) and two structures made out of 0.25 in. (∼6 mm) thick plexiglass (for wetter conditions) were constructed with diagonal supports at either a 15° or 25° incline (). The bases of the pans rested on these supports, and the pan lips rested on two plexiglass platforms at the top and bottom ends (serving as animal staging areas before and after trackway making; see examples in ).
Figure 2. Drawings of some support structures used in spider, scorpion, and crayfish neoichnological experiments. Components were made out of wood or plexiglass, except for the aluminum pan holding the sand. (A) Drawing of the 15° angled wooden support structure made for dry/damp experiments (see C). (B) Drawing of the 15° angled plexiglass support structure for wet/subaqueous experiments (25° angled one not shown). (C) Drawing of the 25° angled wooden support structure, shown inside a dry aquarium.
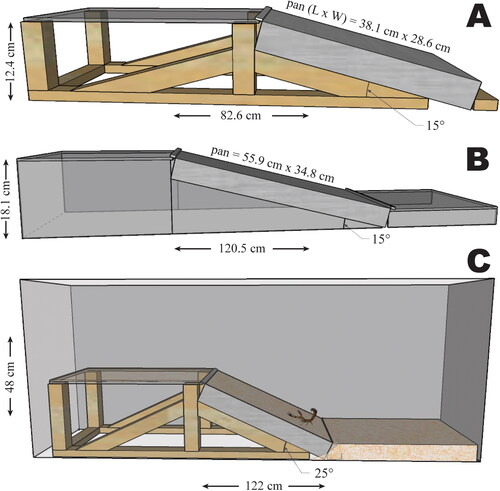
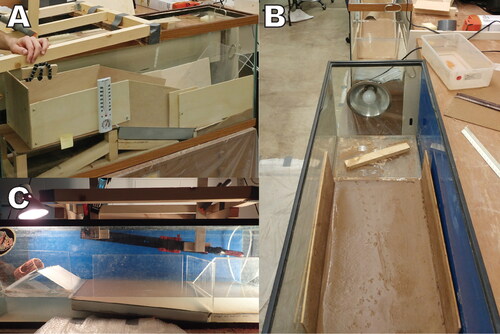
Figure 3. Examples of neoichnological experimental setups used to generate spider, scorpion, and crayfish trackways. (A) Dry aquarium (L: 122 cm; W: 30.5 cm; H: 48 cm) containing a wooden supporting platform with a 15° slope angle, suitable for dry or damp conditions; note the pieces of wood to contain and direct the animals. (B) The setup shown in (A) is at the top of the photo, showing dry sand and a shelter at the top to entice animals upwards; the bottom shows the larger tank (L: 122 cm; W: 38 cm; H: 40.5 cm) used for wet drying, wet saturated, or subaqueous experiments with the pan lying horizontal (0°) containing wet saturated sand with a plexiglass staging platform. (C) Setup for sloped, subaqueous scorpion experiments; cloudiness of water due to sand being reset multiple times after much trackway making (further experiments would have required changing the water or allowing clay particles to settle overnight).
Damp sand was created with a water content of 3% by the following method: (1) A Smart Weigh digital shipping scale was used to weigh an appropriate amount of dry sand; (2) that mass was divided by 0.97 (since 100%–3% = 97%) to get the desired total mass of sand and water; (3) the mass of dry sand was subtracted from the desired total mass to get the necessary mass of water to add; and (4) the calculated amount of water was weighed and added to the dry sand and mixed in a 30 quart mixing bowl until a uniform damp consistency was reached (∼5 min. of stirring). Surface samples taken at various times during experimentation and dried in an oven had a range of 1.7–8.0% H2O with most ranging from 2 to 5% H2O. Water was lost due to evaporation over time, so the higher water content samples are due to sampling after additional water was added (using a spray bottle and mixing the sand again) to increase the moisture content at the surface.
Wet drying sand was created by submerging the sand, then tilting the pan and allowing the water to drain. For horizontal (0°) trials, the pan was then laid flat, and time allowed to pass for the sand to desaturate due to evaporation; Wet drying (horizontal) trials were run between 37 and 111 min after drying started, although a few trials were left overnight to dry. For wet drying sloped trials the pan was set at either angle (15° or 25°) and as water percolated downslope, a gradient formed with relatively drier, stiffer sand at the top of the tilted pan and wetter, looser sand at the bottom. To capture the resulting changes in trackway morphology this gradient caused, wet drying trackways were analyzed in up to five slope/pan locations: bottom, mid-bot, middle, mid-top, and top. Surface samples taken at various times during experimentation and dried in an oven had a range of 20.6–23.8% H2O with most ranging from 21 to 23% H2O.
Wet saturated sand was formed as above for wet drying sand except the sand was not allowed to desaturate over time before trackway formation. To obtain consistently wet, (nearly) saturated sand on slopes, a 0.25 in. (∼6 mm) soaker hose was buried in the sand at the top of the sloped pan. Using a Stenner E20VXC peristaltic pump, water was drawn up from the bottom of the tank through an APEC Water Systems Ultimate Stage 1 sediment filter using 0.25 in. (∼6 mm) tubing. A combination of controlling the speed of the pump and how much water was released through an alternate outlet just before reaching the soaker hose allowed for fine-tuning of the water flow rate exiting the soaker hose. Thus, with the input of only a very small amount of water at the top of the slope, the water percolating downwards or evaporating off was replaced, resulting in a more consistently wet slope.
The subaqueous experiments were tailored to the abilities of the species tested. Tarantulas floated in deeper water, so for them only horizontal wading trials were conducted using a level pan of sand submerged in about 0.75 cm of water. This was also the setup for four horizontal wading trials with scorpions. Crayfish were fully submerged in deeper water in horizontal, shallow, and steep-sloped conditions utilizing the acrylic supports. To minimize water cloudiness, water was siphoned in slowly until it was about 30–35 cm deep, and then left overnight to allow the clay particles to settle. This depth of water required was considered too risky for scorpions, as it increased the time needed for catching them to rescue them out of the water if necessary, so steeper sloped trials were not conducted. To minimize water depth for the scorpions, submerged shallow sloped trials were performed with the pan simply resting on a submerged plastic container, inclining the pan at a shallow (∼12°) slope angle, with a structure for them to climb up on after coming out of the water at the top of the pan (). Horizontal submerged trials for scorpions (additional to the previously mentioned four horizontal wading trials) were conducted in the tank with a layer of sand on the bottom, slightly inclined (≤ 5°) such that the water depth decreased from 3 to 4 cm (enough to make the submerged scorpions buoyant) to 0 cm at an exposed, higher area at the other end of the tank. This was done so that the scorpions, once submerged in the deeper end, were less likely to randomly go to the sides of the tank (a futile endeavor making shorter trackways), and more likely to make a longer trackway going to the other end of the tank, since they could feel (by slight increase of traction) which way led up out of the water. Since these trials were made on nearly horizontal sand, for simplicity they are classified as horizontal trials. If at any time during subaqueous experimentation an animal started moving slower than normal (indicating reduced metabolism due to lack of oxygen), it was immediately taken out and dried under a heat lamp. No animals died from subaqueous testing.
Neoichnological methods
The general methods for the neoichnology experiments were as follows. First, a specific combination of invertebrate, slope, and moisture level was selected to test. Next, the proper platform was placed in the tank and the sand prepared with the proper water content. For each trial, the sand in the pan was smoothed with a straight edge to erase any prior markings. Then the selected invertebrate was placed in the experimental tank for trace making. Generally, the animal was videotaped from above (except when the animal made a valid trackway before it could be videoed). After each trial, a 5 cm scale was placed near the trackway (in subaqueous conditions, a duplicate scale with a wheel weight attached was used), and pictures taken (perpendicular to the sand surface) of the trackway (often multiple, over-lapping photos were taken for photogrammetry). The process was then repeated. Photos and videos were taken using an Olympus TG-4 Tough or a SeaLife DC2000 camera (with raw files saved). For each trial, the following data were recorded: a trial identifier code, the direction of travel, photo/video file number(s), temperature (air or water, as appropriate), time of day, and anything else unusual or noteworthy about the trial or trackway.
To get a good picture of the variation and enable future multivariate statistical analyses, as much as possible, the most capable individuals were run through each applicable experimental combination of water content and slope 3–10 times (), though this was reduced if trackways were unanalyzable or continuing would threaten the survival of the individual.
Table 1. Number of experimental runs, analyzed trackway segments (ATS), and symmetric ATS (Sym) per condition for scorpion, spider, and crayfish trackways.
To better visualize trackways, trackway photos (raw files) were edited using Adobe Camera Raw and Adobe Photoshop as needed to increase clarity and contrast and correct any color and lens distortion. Overlapping photos were merged into panoramas using Adobe Camera Raw and Microsoft Image Composite Editor (v. 2.0; no longer officially supported) (Joshi & Gutierrez, Citation2015). The 5 cm scale, walls/edges, and trackways themselves usually provided sufficient landmarks for the software to create error-free panoramas, but if not, the faulty panoramas were discarded.
Trackways were annotated prior to analysis using FIJI (FIJI Is Just ImageJ; Schindelin et al., Citation2012; Schneider et al., Citation2012). If available and useful, previously created panoramas were used, otherwise single raw images were imported into FIJI using the plugin DCRaw Reader (v. 1.4.0; Coffin, Citation2013). Images were annotated in FIJI to first mark off analyzable trackway segments. Then, if the trackway was more complex (as was often the case), and video footage was available, the images were further annotated with leg numbers assigned to imprints (for identifying series), with letters indicating trackway series shapes, with circles or letters (‘B’ or ‘T’) identifying bifid or trifid imprints, and anything else noteworthy.
Trackway parameters and terminology
Various trackway measurements were selected based upon comparing pictures of experimental trackways made in different conditions, looking for potential condition differentiators (). Trackway terminology used herein is taken from Minter et al. (Citation2007) and imprint morphology is adapted from Trewin (Citation1994). The term ‘imprint’ (historically often used interchangeably with ‘track’) is used to refer to marks made by walking legs (or chelae), while the terms ‘impression’ and ‘internal linear mark’ refer to other body-part drag marks.
Figure 4. Illustrated trackway terminology showing the measurements and some arthropod trackway characteristics examined in this study (q.v., ). The overall internal mark width (OIMW) refers to the total width of internal linear drag marks made by the crayfish tail fan, while the narrower internal linear marks could be made, for example, by a scorpion’s metasoma or only part of the crayfish’s tail fan.
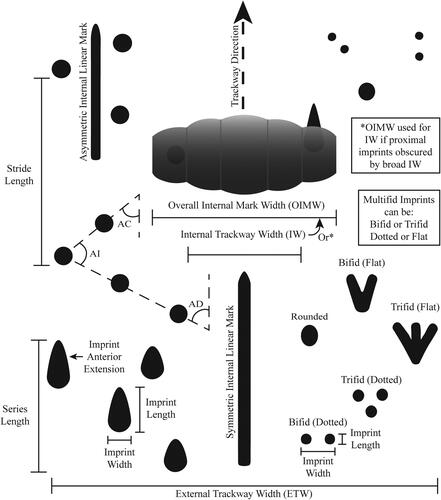
Each trackway was analyzed (as applicable) by making digital measurements, characterizing, and counting specific features. A full explanation of the trackway parameters used and how the ratio variables were calculated is in Supplementary Material A. To make digital measurements, annotated images were imported into FIJI and the scale set by drawing a 1 cm line on top the 5 cm scale in the photo, and setting that distance in pixels as a known distance of 10 mm. For each continuous variable, such as the internal width (IW), multiple measurements were taken, and the mean and standard deviation of these measurements were recorded in an Excel spreadsheet (primary data set).
These measurements were then standardized by the external trackway width (ETW) to form size-independent ratios (). Instead of the ratio ETW/IW proposed by Trewin (Citation1994), the inverse ratio IW/ETW is adopted for three reasons: (1) consistency, (2) it has much less skew, and (3) to prevent any possibility of having to divide by zero (Peixoto et al., Citation2020). Using Orange Data Mining software (Demsar et al., Citation2013), the ETW, grouped by target condition(s), was examined within each species to check the suitability of using the ETW as a denominator for creating standardized ratios of measured variables. Using the boxplot widget, we selected the option to ‘compare means,’ which automatically provided the results of a one-way ANOVA or student’s t-test depending on the number of condition groups selected (Supplementary Material B1 − 4). Two non-measurement ratios involved counts of specific features: (1) the number of multifid imprints over the total number of imprints analyzed, and (2) the number of imprints with anterior extensions (i.e. tapered imprints) over the total number of imprints analyzed (; ). Categorical variables include the presence or absence of internal linear marks, whether those are asymmetric (i.e. cross-cut track rows), the presence of a certain number of imprints in the majority of series (2–5), the presence of dotted and/or flat multifid imprints, and the presence of various imprint morphologies (; ). Each characteristic was treated independently as a binary (presence/absence) variable (rather than as categories of a single categorical variable such as ‘imprint morphology’) due to a single analyzed trackway segment often possessing multiple categories ().
Table 2. List of important binary and ratio variables used in neoichnological experiments with scorpion, spider, and crayfish trackways, along with their abbreviations.
Preliminary analysis
Orange Data Mining software was used to preliminarily examine individual parameters visually (Supplementary Material B). For example, the effect of slope on causing imprint push mounds was determined from inspecting a boxplot chart split by the grouping variable ‘Condition’ (grouping by the original experimental combinations of water content and slope) (Supplementary Material B5). We also compared the parameter ranges and distributions when grouped by experimental species, which revealed that because of significant differences in stride length, internal impressions, number of imprints, etc., an overall combined-species approach could not be used, and we could only analyze one type of invertebrate at a time (Supplementary Material B6).
An important note is that some (n = 25) sloped ‘wet drying’ trackways were formed at the bottom of the slope (Wdr15/25-b) of the pan where the sand was actually saturated, and some (n = 6) wet drying slopes (Wdr15/25-mb to t) were quickly walked on while the higher portion was still (nearly) saturated immediately after the sand was re-smoothed with a straight-edge, which brought up some of the water pooled at the bottom of the pan. This wetter-than-usual wet drying trackway group was merged with the wet saturated group because of the similar water content. Orange Data Mining software (Demsar et al., Citation2013) was used to verify that the ranges of the two groups and distributions for all relevant ratio variables (excluding OIMW/ETW) were not practically different (i.e. had significantly overlapping ranges), and linear projection and multidimensional scaling (based on a normalized Euclidean distance matrix) visualizations generally showed the wetter-than-usual wet drying trackways mixed in with the wet saturated trackways, demonstrating they belong to the same group morphologically (Supplementary Material B7–B8).
Descriptive statistics
Next, we created illustrations showing variable trends across the five target conditions and relevant ichnotaxa for each species analog. The ‘arsenal’ package in R was used (1) for binary variables, to gather the percentages of absent, present, and missing trackway characteristics, and (2) for ratio variables, to gather the number of analyzed trackway segments (ATS) with positive values, the number of ATS with missing values, and the maximum, median, and minimum values (Heinzen et al., Citation2021; R Core Team, Citation2020). These values were copied to an Excel spreadsheet, and then the values for each ratio (not binary) variable were divided by the maximum value across all five conditions and relevant ichnotaxa, multiplied by 100, and rounded to the nearest integer (Supplementary Material C). The resulting presence/absence percentages, and the maximum, median, and minimum ratio value percentages, were then visualized by creating custom charts in Adobe Illustrator. With regards to the binary variables, for the number of imprints in the majority of series in ATS and for the shapes of those series, we copied over the percentages to another Excel spreadsheet for proper data formatting. Then we created bar charts in Excel, clustering by type of invertebrate (species), showing species trends for the percentage of ATS for each imprint number category or series shape.
To visualize the amount of overlap among the experimental conditions of each invertebrate species in a multivariate context, we performed non-metric multidimensional scaling (N-MDS). Visualizing the relationships among more than three variables (up to nine in our case) is difficult as it requires plotting in as many dimensions as there are variables. The algorithm of N-MDS, given a similarity matrix, attempts to place the data points in a two- or three-dimensional coordinate system such that the ranked differences are preserved. We used PAST3 (Paleontological Statistics software version 3) to make a two-dimensional N-MDS visualization for each of the three analog species by grouping trackways by target condition, selecting all the variables to include (the list of variables included or excluded for each N-MDS visualization, as well as the reasons for exclusion, is found in ), and selecting ‘Gower’ for the ‘similarity index,’ because both quantitative (ratio) and qualitative (binary) variables were included (Gower, Citation1971; Hammer et al., Citation2001; Taguchi & Oono, Citation2005). The N-MDS graphics produced by PAST3 were exported as SVG files and edited with Adobe Illustrator to overlay an interpretive key and overall stress value. Stress represents the total amount of disagreement between the original matrix and plotted ranking order distances. Though stress tends to increase with the number of independent variables used and sample size, as a rule of thumb an N-MDS plot with a stress value of > 0.2 cannot be reliably interpreted as the positioning of the points may not accurately reflect the among-sample relationships (Clarke, Citation1993). Given the larger sample size with scorpion trackways, we found it necessary to reduce stress below the 0.2 threshold by taking a random sample of the experimental scorpion analyzed trackway segments (ATS) by randomly selecting (up to) seven ATS per condition (each combination of one of the five target conditions and one of the slope angles) except for sloped wet drying ATS, which was allowed 14 ATS per condition for better coverage due to the greater range in sand stiffness and thus morphology.
Table 3. Variables included or excluded (with reason given) in N-MDS visualizations for experimental tarantula, scorpion, and crayfish trackways.
Results
The invertebrates successfully produced a total of 489 symmetric trackway segments that were analyzed, of which only a subset are depicted herein (). The invertebrates originally performed 473 runs producing a total of 585 analyzable trackway segments including asymmetric trackways (). Asymmetric trackways were excluded from analysis because they did not have two complete track rows, and were usually the result of the animal walking along a wall such that the track row on the wall side was missing some imprints. Annotated pictures of all the symmetric ATS and the spreadsheet (primary data set) giving the associated photo number, condition, and parameters for each trackway can be accessed through FigShare, an online data repository (Clendenon & Brand, Citation2024). During the experiments air temperature ranged from 22° to 31 °C, but was usually 23° to 26 °C. Deionized water temperature ranged from 21° to 30 °C, slowly cooling down after being put in the tanks.
Figure 5. Examples of experimental traces made by six Arizona desert hairy scorpions. The pictures are representative, but not necessarily comprehensive, in terms of the variability in morphology in each condition (water content + slope angle). Upslope is towards the top of the photos in the shallow and steep slope rows (not applicable to the first row which is flat without slope). Larger, annotated photographs of all the trackways analyzed in this study are available online via FigShare (Clendenon & Brand, Citation2024).
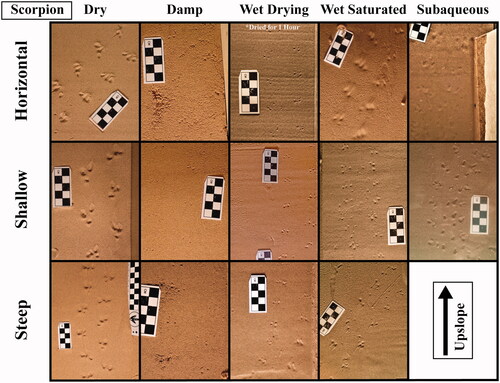
Figure 6. Examples of experimental traces made by two Chilean rose tarantulas. The pictures are representative, but not necessarily comprehensive, in terms of the variability in morphology in each condition (water content + slope angle). Upslope is towards the top of the photos in the shallow and steep slope rows (not applicable to the first row which is flat without slope). Larger, annotated photographs of all the trackways analyzed in this study are available online via FigShare (Clendenon & Brand, Citation2024).
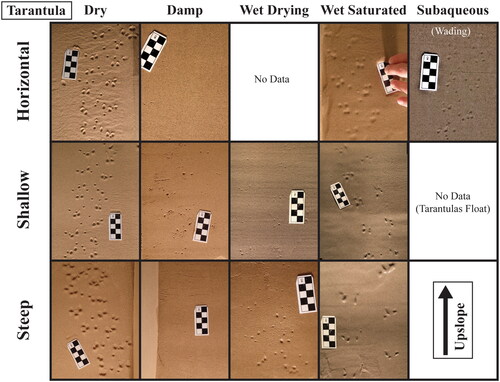
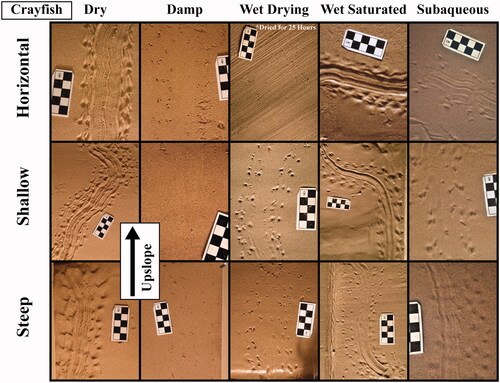
Figure 7. Examples of experimental traces made by four red swamp crayfish. The pictures are representative, but not necessarily comprehensive, in terms of the variability in morphology in each condition (water content + slope angle). Upslope is towards the top of the photos in the shallow and steep slope rows (not applicable to the first row which is flat without slope). Larger, annotated photographs of all the trackways analyzed in this study are available online via FigShare (Clendenon & Brand, Citation2024).
General observations
Generalized Condition Trends In dry sand, imprints are generally large, broad, and often tapering in the forward direction. Wet saturated sand often produced similar trackway morphology, with vague, rounded imprints with long anterior extensions (tapering). The latter were replaced by posterior push mounds going up steeper dry and wet saturated slopes. The sloped wet saturated condition produced much more morphologically consistent trackways compared to wet drying slopes, which lacked the additional water input from the soaker hose. Going upslope on wet drying sand, trackways had imprints that progressively became smaller and more detailed, with multifid imprints (especially more dotted multifid imprints), and less tapered imprints (shorter anterior extensions). At the top end, imprints tended to be small, shallow, and barely visible dots created by the ungues or claws puncturing the stiffer sand. This latter morphology is also reflected in horizontal wet drying sand set out for an extended time or overnight, which produced a very stiff surface.
Damp sand produced variably sized and detailed imprints depending on compaction. If during the smoothing process the damp sand was more compacted, the result was very stiff sand with only claw marks. If the damp sand was stirred up and very gently smoothed over, the resulting surface was softer and gave larger dotted, multifid to even rounded imprints. Some imprints were unexpectedly large due to the feet impressing in areas with abnormally large pore spaces remaining below the surface, creating miniature sinkholes.
Subaqueous trackway morphology often fell in the middle of the range of morphologies demonstrated by the other conditions; however, when the arachnids had poor traction due to buoyancy, their floundering-like behavior often resulted in very elongated, closely spaced or overlapping scrape marks. Imprints were generally rounded with some tapering in the forward direction, though multifid imprints were also observed more frequently than with wet saturated and dry sand. The effect of the water on some trackway features such as internal drag marks and stride length varied based on species and is discussed further below.
Series trends for species overall
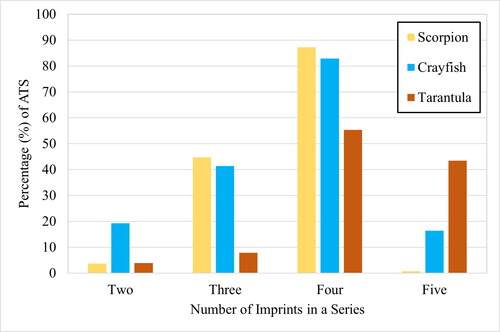
The number of imprints in the major series of each analyzed trackway segment varies depending on species (). Scorpions usually had three, or more often, four imprints per series, yet very rarely impressed their chelae while walking (). Crayfish had a similar pattern except they used their chelipeds occasionally while walking (). Their tail fans often obscured proximal imprints in loose (especially dry) sand (), reducing the number of visible, whole imprints counted in a series (). Tarantulas usually had four to five imprints per series, depending on whether they used their pedipalps (). In dry sand, tarantulas had mostly five-imprint series.
Figure 8. Clustered bar chart showing how often each imprint number category was found in the majority of series in all the analyzed trackway segments (ATS) for each type of invertebrate (species) producer. Percentages do not sum to 100% across number categories because the majority of series within an analyzed trackway segment may include multiple categories (e.g. approximately equal numbers of two- and three-imprint series), in which case each category was counted as present for that analyzed trackway segment. Minor series are excluded here.
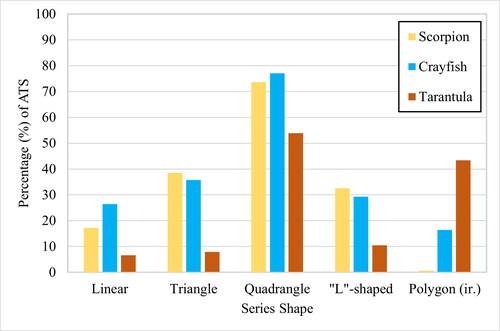
Series shape generally followed the frequency trend for the number of imprints per series ( and ). In some four-imprint series (and rarely five-imprint series), the series were ‘L’-shaped instead of the usual quadrangle or five-sided irregular polygon (). Some linear series had three or four imprints as well; scorpions, for example, had about 14% of their three-imprint series shaped linearly instead of triangular.
Figure 9. Clustered bar chart showing how often each series shape was found in the majority of series in all the analyzed trackway segments (ATS) for each type of invertebrate (species) producer. Percentages do not sum up to 100% across series shapes because the majority of series within an analyzed trackway segment may include multiple series shapes, in which case each category is counted as present for that analyzed trackway segment. Minor series are excluded here.
Individual trackway parameter trends
The external trackway width (ETW) across the five sand water content conditions was not perfectly uniform, but mostly consistent for each type of invertebrate, with the ranges of all conditions overlapping considerably (; Supplementary Material B2–4). For scorpions, the ETW across conditions was significantly different (one-way ANOVA: F = 30.461, p < .001, N = 274), being about 5–10 mm greater in dry and subaqueous conditions, on average (Supplementary Material B2). Tarantulas overall had a significantly different ETW across conditions (one-way ANOVA: F = 2.631, p = .041, N = 76), but the significance was due to a tendency to have a narrower ETW (mean ≈ 60 mm) in damp sand than the other conditions (means ≈ 70–75 mm), with a wider range while wading (Q0) (Supplementary Material B3). Crayfish had the most consistent ETW across conditions, and the means were not significantly different (one-way ANOVA: F = 0.997, p = 0.412, N = 139) (Supplementary Material B4). Although the ETW was not perfectly uniform, it is nevertheless the best proxy for body size in a trackway, as stride is more dependent on the speed (behavior) of the producer; therefore, ETW was used to standardize the other measurements into ratios to enable comparisons with trackways whose producers’ body sizes are different or unknown.
Table 4. External trackway width statistics (in mm ± SD) for each species and the five target conditions.
For each experimental analog below, we examine the internal linear marks (ILMs) first, the overall trackway measurement ratios second, the series trends third, the imprint ratios and presence of imprint anterior extensions (IAEs) fourth, and multifid imprint morphology last (q.v., ; Supplementary Material C).
Figure 10. Binary variable trends for scorpion trackways split by five sand conditions (all slopes included in each of the five conditions, so variability due to slope is accounted for). Shown are the percentages of analyzed trackway segments (ATS) in a condition that are present and absent. Note that for “Symmetric Int. Lin. Marks” (= LM Asym), ATS without internal marks were not included in calculations of percent values. Tapering added to bars near 100% for visual clarity.
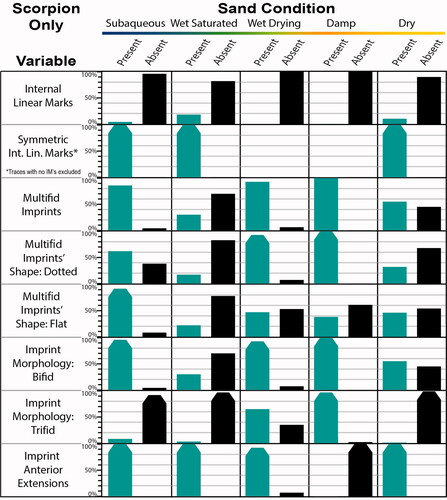
Figure 11. Experimental scorpion trackway trends for series shape and number of imprints per series, split by five sand conditions (all slopes included in each of the five conditions, so variability due to slope is accounted for). Shown are the percentages of analyzed trackway segments (ATS) in a condition that are present and absent. Tapering added to bars near 100% for visual clarity.
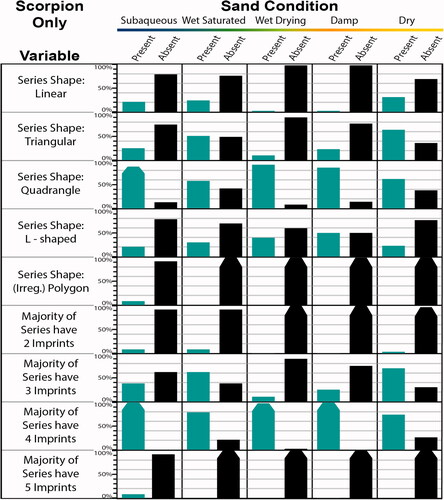
Figure 12. Range area charts showing ratio variable trends for scorpion trackways split by five sand conditions. The five conditions contain both flat and sloped trackways (as applicable), so variability due to slope is included in each condition. Shown, for each ratio in each condition, are the individual ratio values (%) for the analyzed trackway segments (ATS) having the maximum, median, and minimum ratio values in each condition. To better visualize how all the ratios vary together across conditions, the values are expressed as percentages (each value was divided by the maximum value amongst the experimental trackways for each ratio). Note that for OIMW/ETW, ATS without internal marks (i.e. OIMW/ETW = 0) were not included in calculations of percent values.
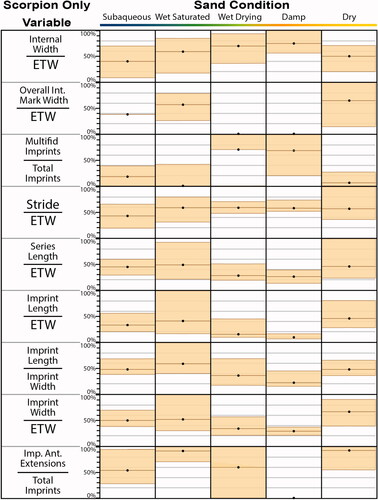
Figure 13. Binary variable trends for tarantula trackways split by five sand conditions (all slopes included in each of the five conditions, so variability due to slope is accounted for). Shown are the percentages of analyzed trackway segments (ATS) in a condition that are present and absent. Note that for “Symmetric Int. Lin. Marks” (= LM Asym), ATS without internal marks were not included in calculations of percent values. Tapering added to bars near 100% for visual clarity.
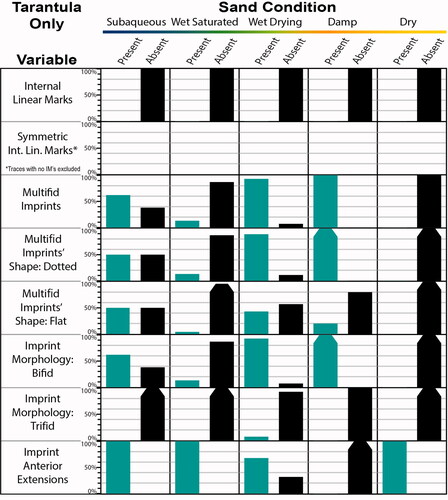
Figure 14. Experimental tarantula trackway trends for series shape and number of imprints per series, split by five sand conditions (all slopes included in each of the five conditions, so variability due to slope is accounted for). Shown are the percentages of analyzed trackway segments (ATS) in a condition that are present and absent. Tapering added to bars near 100% for visual clarity.
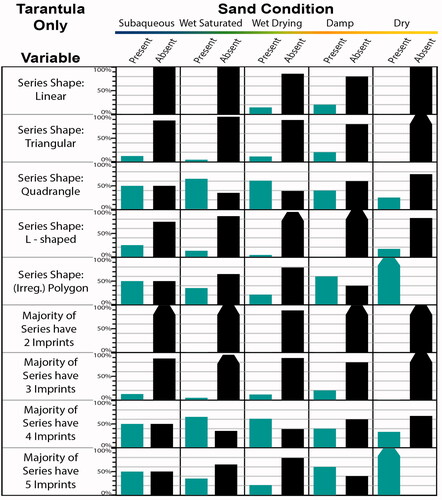
Figure 15. Range area charts showing ratio variable trends for tarantula trackways split by five sand conditions. For additional explanation, see caption.
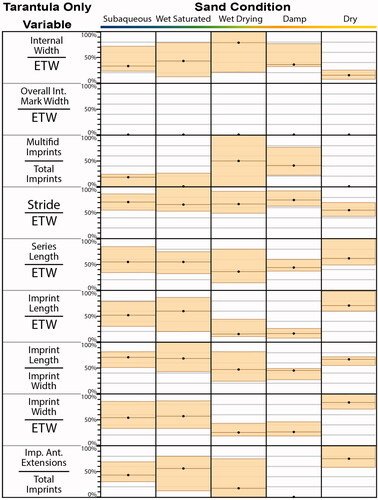
Figure 16. Binary variable trends for crayfish trackways split by five sand conditions (all slopes included in each of the five conditions, so variability due to slope is accounted for). Shown are the percentages of analyzed trackway segments (ATS) in a condition that are present and absent. Note, for “Symmetric Int. Lin. Marks” (= LM Asym), ATS without internal marks were not included in calculations of percent values. Tapering added to bars near 100% for visual clarity.
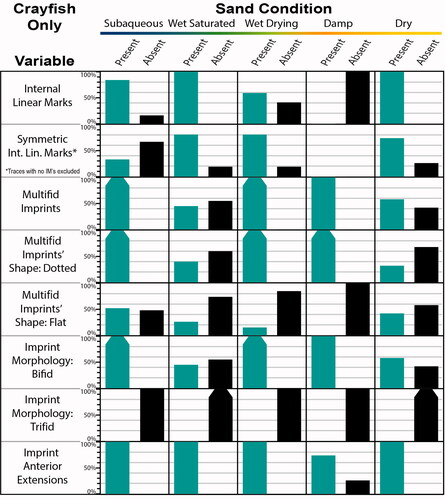
Figure 17. Experimental crayfish trackway trends for series shape and number of imprints per series, split by five sand conditions (all slopes included in each of the five conditions, so variability due to slope is accounted for). Shown are the percentages of analyzed trackway segments (ATS) in a condition that are present and absent. Tapering added to bars near 100% for visual clarity.
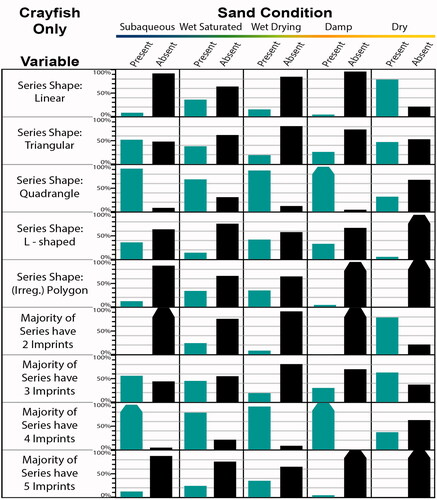
Figure 18. Range area charts showing ratio variable trends for crayfish trackways split by five sand conditions. For additional explanation, see caption.
Scorpions
Only 8% of all scorpion trackways had metasoma drag marks (). They generally occurred experimentally only rarely in dry or wet saturated conditions (present in only one subaqeuous ATS), yet never on stiff sand (). These ILMs were always symmetric (centered on the midline), and never cross-cut imprints, even in turns (). The overall internal mark width (OIMW)/ETW ratio for the metasoma drag marks ranged from 0.055 to 0.214 (mean = 0.124) experimentally, with width varying little across the loose (subaqueous, wet saturated, and dry) sand conditions (). The ratio dips lower in the chart for dry sand due to the unique occurrence of three trackways that recorded narrow (OIMW/ETW = 0.030–0.036) pectine (comb) drag marks that were offset distal to the midline but within the internal trackway width ().
The general trend with internal width (IW)/ETW was that the more traction or support scorpions had, the greater the ratio; the smallest IW/ETW ratios occurred in some subaqueous, floundering trackways with narrow internal trackway widths (). The lack of traction underwater also reduced stride length (Stride/ETW) at times, though for other conditions it remained nearly constant. Series length (Ser Length/ETW) generally increased in loose sand due to longer imprint lengths. Note that one trackway (ID: Sco3-Y25-3) was excluded from this analysis because it was a high outlier (the scorpion sprinted incredibly fast down a steep dry slope), which would have extended the maximum values for series length and imprint measurements significantly above the rest of the scorpion trackways.
Experimental scorpion trackways consist of staggered to alternating series of diverse shapes, yet four-imprint series were most common. The quadrangle shape was most common, followed by ‘L’-shaped and triangular series, with linear, and especially irregular polygon, series shapes less common (). Only rarely in the subaqueous condition did scorpions put down their chelae to make five-imprint series. There were relatively fewer two- and three-imprint series, and thus linear and triangular series, in the wet drying and damp conditions (). Within the analyzed trackway segments for these two conditions, scorpions had 5.7 times as many four-imprint series (n = 536) as three-imprint series (n = 94); whereas in loose (dry, wet saturated, and subaqueous) conditions, scorpions had only about 1.3 times as many four-imprint series (n = 607) as three-imprint series (n = 476). Yet, out of all 274 scorpion analyzed trackway segments (ATS), only nine (3.3% of all scorpion ATS; three dry and six wet saturated ATS) had all of their analyzed trackway segments’ series composed solely of two- or three-imprint series.
Imprint ratios (i.e. Imp Length/ETW, Imp Width/ETW, Imp L/W) generally reveal longer and larger imprints in dry and wet saturated conditions (often longer than the ichnites), shorter and smaller imprints in wet drying and damp conditions, and mid-range imprints subaqueously (). Almost all imprints in dry and wet saturated sand had imprint anterior extensions (IAEs). Stiffer wet drying and damp sand lacked IAEs. Subaqueous and looser (wetter) wet drying conditions ranged from high to low numbers of imprints with IAEs.
Looking more closely at the imprints, we observed that multifid imprints were commonly present in high numbers in stiffer sand, but may not occur in loose sand or have a relatively low multifid imprint (Mfid Imp) Ratio ( and ). For those trackways with multifid imprints, dotted ones were produced the most on stiffer sand, but the looser (especially subaqueous) sand conditions had some too (). The highest percentage of analyzed trackway segments (ATS) having at least one flat multifid imprint occurred subaqueously (more than 90% of subaqueous ATS had at least one flat multifid imprint), while lower to nearly equal ratios were observed in the other experimental conditions. Bifid imprints were the default multifid morphology with condition ratios very similar to overall multifid imprint presence/absence ratios. Scorpions almost always produced small, dotted, trifid imprints in damp and stiffer wet drying sand, but only rarely in subaqueous, dry, and looser wet drying sand.
Tarantulas
Unlike the other species experimentally tested, tarantulas never produced any internal drag marks because their abdomens always stayed elevated ().
The internal trackway width, stride length, and series length varied relatively little across the conditions (). In loose sand, the external trackway width (ETW) was wider, and the internal trackway width (IW) narrower, than in stiff sand. Dry sand especially had small IW/ETW ratios.
Tarantulas generally produced staggered to alternating four- to five-imprint series that were quadrangular or polygonal in shape, yet relatively few three-imprint, triangular and linear series; they also produced trackways with ‘L’-shaped series less than 25% of the time (and almost never in stiff conditions) (). These trends were mostly consistent across the conditions; however, in dry sand, the majority of series always were five-imprint, (irregular) polygonal series, without exception. Wet sand had the highest numbers of four-imprint series (mostly quadrangular not ‘L’-shaped), though five-imprint series were not uncommon either ().
Imp Length/ETW, Imp Width/ETW, and Imp L/W were greatest in loose (especially dry, excluding Imp L/W) sand (). These ratios were smallest in stiffer wet drying and damp sand (). At least small imprint anterior extensions (IAEs) were abundant in loose sand, but IAEs decreased in occurrence as sand stiffened, with no IAEs made in damp sand ( and ).
Tarantulas were unique in that no multifid imprints were ever observed in dry sand; the imprints were always rounded (). The multifid imprint ratio had a significant overlap in the wet drying and damp conditions (). In subaqueous and wet saturated conditions, the ratio was ≤ 20%, while only in wet drying sand the ratio ranged from 0 to 80% (). The relatively small tarsal claws on tarantulas contributed to the lower ratio values and also meant that only tiny, dotted multifid imprints (and few if any flat ones) were observed in stiffer wet drying and damp sand. Small, flat multifid imprints occurred sometimes in subaqueous and moist sand, but not if the sand was too loose. Multifid imprints were almost always bifid in morphology, with only a couple wet drying analyzed trackway segments having apparent trifid imprints.
Crayfish
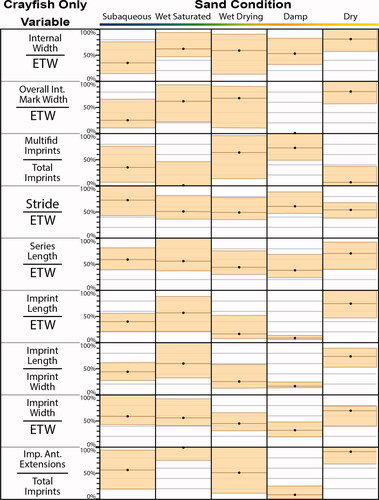
Crayfish are unique among the species tested in that they have a broad tail fan consisting of two pairs of uropods straddling a medial telson. The tail fan was commonly dragged, leaving deep, broad marks in loose sand, with the widest overall internal mark width (OIMW)/ETW ratios seen in dry sand ( and ). On stiffer wet drying and damp sand, the tail fan would often drag across without leaving noticeable marks (). In general, internal linear marks were usually symmetric (centered in the trackway) except when traversing across a slope; however, in subaqueous conditions, due to microcurrents or for stability on a slope, sometimes only one side of the tail fan was dragged, often resulting in a narrow, but asymmetric, linear impression cross-cutting imprints in a row (). Less than 20% of crayfish ATS produced subaqueously lacked internal linear marks (ILMs), while 100% of crayfish ATS on damp sand left no clearly visible ILMs ().
The overall trackway measurement ratios varied little. Stride and series lengths were nearly constant across all experimental conditions (). When the crayfish’s tail fan dragged and covered up proximal imprints, the overall internal mark width (OIMW) replaced the internal width (IW) (). The distribution of ETW remained relatively constant across the conditions (). Thus, an increased IW/ETW ratio is due to increased internal widths (either OIMW or IW). In dry sand, for example, the OIMW was broader than average, resulting in larger IW/ETW ratios (). On the other hand, most subaqueous trackways had narrower than average internal widths due to walking diagonally to some degree or perhaps having a more vertical stance; in either case, the wider track rows (more proximal imprints) resulted in smaller IW/ETW ratios ().
Crayfish trackways had staggered (even almost opposite) to alternate series symmetry. Series trends were predominantly affected by the extent the tail fan dragged through the sand, obscuring proximal imprints, decreasing the number of (visible) imprints per series. The effect was greatest in the subaerial loose sand (wet saturated and especially dry) conditions, which had relatively more two-imprint series and less four-imprint series than all the other conditions (). Crayfish used their chelipeds to make a five-imprint series most often in subaerial loose sand conditions to aid in traction; however, more proximally located chelae imprints were obscured by the tail fan drag marks especially in dry sand. While the experimental series tended to be more quadrangular, the conditions in which crayfish produced the most ‘L’-shaped series (in various orientations) were subaqueous, wet drying, and damp ().
Imprint ratios were smallest in stiffer wet drying and damp sand, and greatest in loose wet saturated or dry sand, in which most imprints had some very long anterior extensions (). The imprint anterior extension (IAE) ratio varied significantly depending upon the condition, being especially variable in subaqueous and wet drying conditions. Owing to their larger claws, crayfish were able to displace even damp sand a bit to make a few imprints that have some small IAEs, though some damp sand trackways still lacked IAEs completely ( and ).
Crayfish trackways on stiffer wet drying and damp sand created dotted multifid imprint morphology. It should be noted that the first two pairs of pereiopods in crayfish are didactyl, and the chelipeds were used occasionally during walking. Dotted bifid imprints were thus always present in damp, wet drying, and even subaqueous conditions, though the number of multifid imprints per analyzed trackway segment was not as high as in the stiffer wet drying and damp conditions (). The looser wet saturated and dry sand resulted in some crayfish trackways having a lower Mfid Imp Ratio and even some without any (). Crayfish never made any trifid imprints (). As for the shape of the bifid imprints, sometimes in loose sand, the claws pressed down flat, leaving ‘V’-shaped imprints. These were actually most common in the subaqueous condition, present in about 50% of analyzed trackway segments, and sometimes present in dry, wet saturated, and even looser wet drying sand (). In these conditions they commonly co-occurred with the dotted multified imprints in the same trackway ().
Slope effects
For all three species, imprint push-back mounds were generally observed in uphill (by definition, see Supplementary Material A) trackways made on looser (dry, wet saturated, and subaqueous) slopes, but few or none on stiffer (wet drying and damp) slopes (Supplementary Material B5). Crayfish, for example, produced push-back mounds on most dry and subaqueous slopes, more of them in steep than shallow wet saturated slopes, and even a few in steep wet drying slopes (owing to their greater weight), but none in shallow wet drying slopes or in damp sand. Scorpions, however, produced relatively few on wet saturated slopes.
The effect of slope on stride length and other trackway parameters was often minor, though we note several significant differences among certain conditions within species. Subaqueous shallow sloped trials with scorpions produced some trackways with significantly shorter average stride lengths compared to subaqueous horizontal trials, or all other conditions for that matter, because the scorpions struggled to gain traction underwater due to the increased buoyancy. These floundering traces also had long (sometimes curved) imprints sweeping in farther proximally, resulting in narrower internal widths (IWs) and significantly smaller IW/ETW ratios. Tarantulas tended to have shorter stride lengths in steep than shallow wet drying slopes, though no significant trends were observed in other conditions. For crayfish, subaqueous slopes often resulted in asymmetric internal linear marks as the result of dragging their uropods on only one side for balance. Crayfish also had a smaller IW/ETW ratio in steep dry slopes than shallow or horizontal dry sand, and smaller Ser L/ETW and Imp Length ratios on 25° slopes due to the significant reduction in length of anterior extensions (tapering) going up a steep slope in wet drying, wet saturated, and dry, but not damp or subaqueous conditions.
Non-metric multidimensional scaling visualizations
Shifting to a multivariate approach, non-metric multidimensional scaling (N-MDS) visualizations revealed several key trends with regards to the trackway morphology within the five moisture level conditions (the differently colored areas in ). As expected, there is a morphological trend from the wet saturated, to the wet drying, to the damp sand conditions. For example, the wet saturated crayfish trackways morphologically transitioned as the condition changed to wet drying then damp (overlapping colors in ), going from loose to stiff sand. The trackway morphology on damp sand was distinct from the loose sand conditions, as expected. That said, there was significant overlap between stiffer wet drying and damp conditions, indicating it may not be possible to morphologically distinguish trackways made on stiffer wet drying or damp sand. Note that where wet saturated overlaps wet drying, only sloped wet saturated trackways are present, not horizontal wet saturated trackways (except in crayfish). Also, the loose sand conditions generally resulted (except with dry sand in tarantulas) in trackways with more variable morphology (larger areas in the N-MDS visualizations).
Figure 19. Non-metric multidimensional scaling (N-MDS) visualization for a random sample of scorpion trackways grouped by condition (N = 134; stress = 0.1604). For the variables used, see .
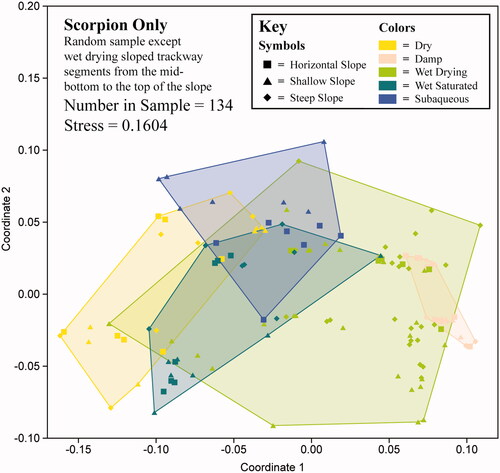
Figure 20. Non-metric multidimensional scaling (N-MDS) visualization for tarantula trackways grouped by condition (Overall N = 76; stress = 0.1199). For the variables used, see .
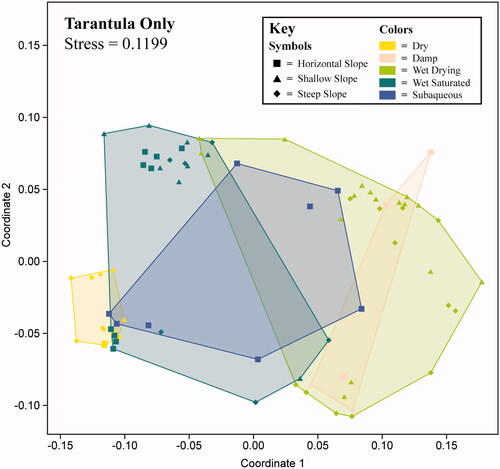
Figure 21. Non-metric multidimensional scaling (N-MDS) visualization for crayfish trackways grouped by five conditions (Overall N = 139; stress = 0.1714). For the variables used, see . Note how wet saturated (dark turquoise color) is in the left and center of the coordinate plane, and then moving to the bottom-right, transitions to wet drying (lighter green color) then damp (light peach color) as the sand conditions go from loose to stiff.
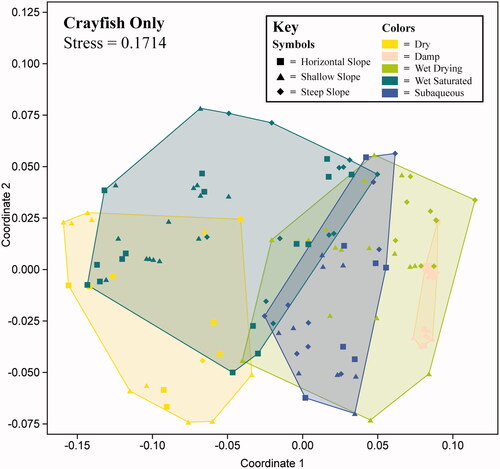
These N-MDS results helped visualize some more surprising similarities and differences among experimental conditions with disparate water content. The morphologies under dry and wet saturated (and to some extent subaqeuous) conditions tended to overlap substantially, with horizontal wet saturated analyzed trackway segments (ATS) clustering close together with dry ATS for scorpions and tarantulas especially (). The morphology displayed in the subaqueous condition generally fell between the morphologies displayed in the wet saturated and wet drying conditions (). However, a few sloped subaqueous ATS were set apart a bit from the rest, representing different, subaqueous-induced (floundering?) trackway-making behavior and morphology ( and ). Overall, it can be difficult to distinguish dry, wet saturated, and even some subaqueous trackways if the latter are produced when the animal has sufficient traction to walk relatively normally.
Discussion
Relevance for paleoichnology
A full ichnological comparison of these experimental trackways with similar fossil trackways is beyond the scope of this article. We here only briefly mention the fossil record of scorpions, tarantula, and crayfish and some ichnotaxa that may have similar trackway morphology. As a disclaimer, comparative ichnology does face a limitation in that fossil trackways have passed through the taphonomic filter, undergone diagenesis, and then been potentially exposed as an underprint, a process that may alter the preserved morphology by skewing traces or (usually) reducing detail from that seen in a modern trace. As ichnologists must work with what is available and practical, it is best then to think in terms of probability rather than absolutes when making comparative judgments. We refer the reader to the primary author’s dissertation, a major part of which quantitatively and probabilistically compares the experimental arthropod trackways in this study with similar ichnotaxa (Clendenon, Citation2023).
Scorpions
The fossil record of scorpions goes back to the early Silurian, though the debate of whether Paleozoic scorpions were aquatic, semi-aquatic, or terrestrial is ongoing (Wendruff et al., Citation2020). Brady (Citation1947) first suggested scorpions as the producers for Paleohelcura Gilmore (Citation1926) and Octopodichnus Gilmore (Citation1927). The only other relevant fossil trackway taxa known to the authors is Stiaria Smith (Citation1909). The type material is interpreted as an eurypterid/scorpionid trackway from the subaqueously-deposited Old Red Sandstone (Devonian) of Scotland (Smith, Citation1909; Walker, Citation1985).
Tarantulas
While the oldest fossils of the order Araneae come from the Late Carboniferous of England, the oldest fossils of the infraorder Mygalomorphae (i.e. tarantulas, trap-door spiders, and their relatives) come from the Triassic (Dunlop, Citation2010). Tarantulas themselves (Theraphosidae) are thought to have originated in the Cretaceous (Foley, Citation2019). Previous workers have proposed tarantulas (or at least spiders) as producers of at least some Octopodichnus and Paleohelcura ichnites (Alf, Citation1968; Azain, Citation2006; Manton, Citation1973; Braddy, Citation1995; Davis et al., Citation2007; Hunt & Lucas, Citation2005; Krapovickas et al., Citation2016; Sadler, Citation1993; Thomson et al., Citation2015). Paleozoic occurrences of Octopodichnus and Paleohelcura present a paleontological problem, though, as trackways assigned to tarantulas predate their body fossils. Aside from Octopodichnus and Paleohelcura, there are no other credible fossil trackway taxa attributed to tarantulas (or similar spiders). Abbassi and Mustoe (Citation2018) assigned to tarantula producers a Jurassic arthropod trackway from Iran, Porpaichnus dansiritensis, having opposite symmetry and six imprints on either side in variable linear subgroupings, but the morphology is inconsistent with tarantula trackways, which have usually alternate symmetry and a maximum of five (usually four) imprints per series.
Crayfish
While burrows (Camborygma isp.) morphologically similar to extant crayfish burrows are known from Permian formations in Texas, Oklahoma, and Ohio, the oldest definitive crayfish body fossils known come from the Triassic Chinle Formation (Miller & Ash, Citation1988; Hasiotis and Mitchell, Citation1993; Hasiotis et al., Citation1993; Hembree & Swaninger, Citation2018). Gilmore (Citation1927) suggested Octopodichnus may have been produced by a crustacean, and Fairchild and Hasiotis (Citation2011) recognized some gross similarity between O. raymondi Sadler (Citation1993) and crayfish trackways. But again, attributing Paleozoic occurrences of Octopodichnus to crayfish is problematic because crayfish body fossils are unknown in the Permian. Similarly, Keircalia multipedia Smith (Citation1909), Danstairia vagusa Smith (Citation1909), and Siskemia latavia Smith (Citation1909) do have some imperfect resemblance to crayfish trackways; however, these ichnites are from Devonian strata and, in the case of the first two ichnotaxa, are only one to two centimeters wide (Smith, Citation1909; Walker, Citation1985). The most promising ichnogenus for comparison so far is Siskemia eurypyge Rose et al., Citation2021 (from the Lower Jurassic), which bears a close similarity to some of our crayfish trackways made in looser (but not dry) sand (Smith, Citation1909; Walker, Citation1985; Rose et al., Citation2021). This indicates that while the full, broad tail fan drag impressions left by extant crayfish have not been discovered in the trace fossil record to date, such impressions are not necessary to identify crayfish ichnites.
Methodological strengths and limitations
The neoichnological portion of this study is strengthened by its comprehensiveness in terms of moisture condition and slope, and by the high number of trackways analyzed relative to former neoichnological studies; however, this study does have its weaknesses. Because natural dunes are much larger, conducting future experiments using a larger experimental setup would provide greater opportunity for the invertebrates to establish both a faster and more consistent gait, which would be more advantageous for comparison with ichnites.
There was also subjectivity in the data collection process. Digitally analyzing photographs does have a greater risk of misinterpreting trackway features due to lighting issues, which is not a factor if one is measuring casts or molds by hand. Because making hundreds of casts or molds is impractical, we opted to offset any potential lighting bias by using consistent lighting as much as possible, performing multiple runs per experimental condition to produce a range of variation greater than any lighting bias, and zooming in to identify the exact imprint edges to the nearest pixel when making digital measurements. Regardless of using a digital or analog measurement method, subjectivity also exists especially in choosing which portions of the trackway to sample for analysis (designating the analyzed trackway segments), as well as in characterizing trackways, where choosing whether a feature is present or not is sometimes difficult. For example, the ‘L’-shape () (useful for describing Octopodichnus-like series shapes) can be considered a junior synonym of the quadrangle shape because in our experimental trackways sometimes series had an intermediate shape between an ‘L’ and a quadrangle. A similar situation existed for three-imprint series as to whether they were linear or triangular shaped if one of the imprints was offset a bit in what would otherwise make a straight line. Such difficulties were at least partially remedied by (1) obtaining multiple trackways from one experimental combination of invertebrate, moisture condition, and slope, thereby increasing the chances any characterization inaccuracies due to borderline features would be overshadowed by the accurate trend of the majority of trackways; (2) the accurate imprint and series determination gained by using accompanying video recordings to mark which leg produced which imprint and exactly where; and (3) making many individual measurements within the entire analyzed trackway segment and averaging them to get a final measurement that was input into the spreadsheet.
Trackways were analyzed as they appeared on the surface after being produced. Thus, given that imprint anterior extensions are often the result of sand being picked up and draped on the surface, the imprint anterior extension ratio especially may be decreased in fossil trackways due to underprinting. It is also important to note that some apparently ‘flat’ bifid and trifid imprints were not made because the producers had multifid feet or claws per se, but were actually behavioral artifacts resulting from the (even monofid) feet pushing back one way then pulling forward through the sand at an oblique angle (e.g. like a ‘V’).
In terms of overall trackway morphology, the results of this study reveal that the five tested moisture conditions can be generally grouped into two categories, loose sand or stiff sand, although a gradient clearly exists between the two. Dry, wet saturated, and subaqueous conditions have either air or water saturating the pore spaces, allowing free movement of grain particles and resulting in loose sand with often broadly similar trackway morphology. On the other hand, damp and wet drying conditions have greater grain particle cohesion, resulting in stiffer sand. However, in some cases, damp sand that was stirred became more porous and less stiff despite having less water content than wet drying sand. Additionally, a potential sixth moisture condition with 12–15% H2O by weight (in between our damp and wet conditions) could be tried in future research, although we doubt this would be particularly useful because damp and wet drying trackways appeared similar, with a general gradation from wet drying to damp morphologically.
This study also had a limited number of trackways in some species and conditions. More tarantula trackways, especially in damp and horizontal wet drying conditions, would have been useful, though it was difficult to get clearly visible trackways in stiffer sand. Making and analyzing additional trackways would also boost sample size, increasing the power of future statistical analyses.
Conclusions
The purpose of this study was to perform a detailed, quantitative analysis of the experimental trackways of six Arizona desert hairy scorpions (H. arizonensis), two Chilean rose tarantulas (G. rosea), and four red swamp crayfish (P. clarkii), produced under a more comprehensive set of experimental conditions than previous studies with these types of arthropods. The tested individuals made trackways on dry, damp, wet drying, wet saturated, and subaqueous sand at flat, shallow, and steep slope angles, as applicable. We qualitatively characterized and quantitatively analyzed these complex experimental trackways, enabling comparison of individual parameter trends as well as multivariate analysis.
The results of our neoichnological analysis provide a basis for future comparative ichnological studies, and the tested species revealed trackway trends relevant to those considering attributing (fossil) trackways to scorpions, tarantulas, or crayfish. Here we briefly summarize the most interesting findings. Our scorpions (H. arizonensis) generally produced staggered to alternating trackways with mostly four-imprint series in a quadrangular shape, and analyzed trackway segments composed of only three-imprint series were rare (3.3%). Scorpion metasoma drag marks occurred in only 8% of their analyzed trackway segments, only in loose sand, and never cross-cut imprints. The tarantulas (G. rosea) usually produced staggered to alternating trackways with four-imprint or five-imprint series (the latter especially so in dry sand), in a quadrangular or irregular polygonal shape. The tarantulas produced relatively the fewest ‘L’-shaped series compared to scorpions and crayfish, but even among them ‘L’-shaped series were present only a minority of the time. Tarantulas also produced relatively small multifid imprints, which were non-existent in dry sand but progressively increased in frequency through the wet saturated, subaqueous, wet drying, and damp conditions. Our crayfish (P. clarkii) trackways had usually staggered (even almost opposite) to alternate series symmetry, generally composed of four-imprint series with occasional five-imprint series when the chelipeds were used while walking. Bifid (no trifid) imprints always occurred in subaqueous, wet drying, and damp trackways, while they were absent about 50% of the time in wet saturated and dry conditions. The tail fan was almost always dragged, leaving wide internal marks that covered more proximal imprints when the sand was loose; however, a minority of underwater slope trackways had asymmetric, narrow internal linear marks.
Using trackway morphology to infer sand conditions at the time a trackway was formed is not necessarily a silver bullet, due to morphological overlap and gradation among some conditions. In general, a trend of progressively smaller, more dotted multifid imprints was observed going from wet saturated to wet drying to damp sand conditions. The non-metric multidimensional scaling (N-MDS) visualizations revealed a clear distinction among loose (e.g. dry, subaqueous, and wet saturated) and stiff (e.g. damp) sand conditions. Yet, the significant morphological overlap between even disparate conditions (e.g. dry and wet saturated, wet drying and subaqueous), or stiffer wet drying and damp conditions, indicates one cannot necessarily easily distinguish whether a trackway was produced in one condition or the other. Trackways made on dry sand can appear similar to those made on wet saturated or even subaqueous sand, though the latter may be easily distinguished if the animal was semi-swimming, or buoyed up and unable to maintain normal traction. When the animal had sufficient traction to walk relatively normally, subaqueous trackways morphologically appeared similar to wet saturated to wet drying trackways. These findings should be considered when workers use trackway morphology for interpreting the sand conditions at the time not just recent trackways, but also fossil trackways formed. Caution is urged when making paleoenvironmental inferences especially if the trackways appear to have formed in loose sand.
gich_a_2322937_sm3172.docx
Download MS Word (10.8 KB)Acknowledgements
The authors would like to thank the anonymous reviewers who helped greatly improve this manuscript, as well as Loma Linda University and the Geoscience Research Institute for supporting this research.
Disclosure statement
No potential conflict of interest was reported by the authors.
Data availability statement
Annotated images of all experimental symmetric analyzed trackway segments, the primary data set with analyzed trackway segment parameters, and all Supplementary Materials are available online (DOI: 10.6084/m9.figshare.c.6778683) through FigShare (Clendenon & Brand, Citation2024).
References
- Abbassi, N., & Mustoe, G. E. (2018). Jurassic arthropod tracks from northern Iran. Palaeogeography, Palaeoclimatology, Palaeoecology, 508, 176–187. https://doi.org/10.1016/j.palaeo.2018.07.034
- Alf, R. M. (1968). A spider trackway from the Coconino Formation, Seligman, Arizona. Bulletin of the Southern California Academy of Sciences, 67(2), 125–128. http://scholar.oxy.edu/scas/vol67/iss2/9/
- Azain, J. S. (2006). The effect of temperature and slope on the morphology of experimental spider and scorpion trackways [PhD dissertation], University of Colorado at Denver. https://digital.auraria.edu/work/ns/4cfeb159-a5a4-46c1-908c-8145e80f0450
- Braddy, S. J. (1995). The ichnotaxonomy of the invertebrate trackways of the Coconino Sandstone (Lower Permian), northern Arizona. New Mexico Museum of Natural History and Science Bulletin, 6, 219–224.
- Brady, L. F. (1939). Tracks in the Coconino Sandstone compared with those of small living arthropods. Plateau, 12(2), 32–34.
- Brady, L. F. (1947). Invertebrate tracks from the Coconino Sandstone of northern Arizona. Journal of Paleontology, 21(5), 466–472. http://www.jstor.org/stable/1299441
- Brady, L. F. (1961). A new species of Palaeohelcura Gilmore from the Permian of northern Arizona. Journal of Paleontology, 35(1), 201–202. http://jpaleontol.geoscienceworld.org/content/35/1/201.abstract
- Clarke, K. R. (1993). Non-parametric multivariate analyses of changes in community structure. Australian Journal of Ecology, 18(1), 117–143. https://doi.org/10.1111/j.1442-9993.1993.tb00438.x
- Clendenon, C. L. (2023). Reanalysis of coconino sandstone invertebrate ichnites based on neoichnology [Doctoral dissertation]. Department of Earth and Biological Sciences, Loma Linda University.
- Clendenon, C. L., & Brand, L. R. (2024). Supplementary material for quantitative analysis of experimental trackways of scorpions, tarantulas, and crayfish, FigShare. https://doi.org/10.6084/m9.figshare.c.6778683
- Coffin, D. (2013). Digital Camera Raw (DCRaw) Reader plugin (1.4.0). https://sourceforge.net/projects/ij-plugins/files/ij-dcraw/
- Davis, R. B., Minter, N. J., & Braddy, S. J. (2007). The neoichnology of terrestrial arthropods. Palaeogeography, Palaeoclimatology, Palaeoecology, 255(3-4), 284–307. https://doi.org/10.1016/j.palaeo.2007.07.013
- Demsar, J., Curk, T., Erjavec, A., Gorup, C., Hocevar, T., Milutinovic, M., Mozina, M., Polajnar, M., Toplak, M., Staric, A., Stajdohar, M., Umek, L., Zagar, L., Zbontar, J., Zitnik, M., & Zupan, B. (2013). Orange: Data mining toolbox in Python. Journal of Machine Learning Research, 14, 2349–2353. https://jmlr.org/papers/v14/demsar13a.html
- Dunlop, J. A. (2010). Geological history and phylogeny of Chelicerata. Arthropod Structure & Development, 39(2-3), 124–142. https://doi.org/10.1016/j.asd.2010.01.003
- Fairchild, J. M., & Hasiotis, S. T. (2011). Terrestrial and aquatic neoichnological laboratory experiments with the freshwater crayfish Orconectes: Trackways on media of varying grain size, moisture, and inclination. PALAIOS, 26(12), 790–804. https://doi.org/10.2110/palo.2011.p11-066r
- Foley, S. (2019). The natural history and evolution of tarantula spiders [Ph.D. Thesis]. National University of Singapore. https://scholarbank.nus.edu.sg/handle/10635/170950
- Gilmore, C. W. (1926). Fossil footprints from the Grand Canyon. Smithsonian Miscellaneous Collection, 77(9), 1–41.
- Gilmore, C. W. (1927). Fossil footprints from the Grand Canyon: Second contribution. Smithsonian Miscellaneous Collection, 80(3), 1–78.
- Gower, J. C. (1971). A general coefficient of similarity and some of its properties. Biometrics, 27(4), 857–871. http://links.jstor.org/sici?sici=0006-341X%28197112%2927%3A4%3C857%3AAGCOSA%3E2.0.CO%3B2-3 https://doi.org/10.2307/2528823
- Hammer, Ø., Harper, D. A. T., & Ryan, P. D. (2001). PAST: Paleontological statistics software package for education and data analysis. Palaeontologia Electronica, 4(1), 9. http://palaeo-electronica.org/2001_1/past/issue1_01.htm
- Hasiotis, S. T., & Mitchell, C. E. (1993). A comparison of crayfish burrow morphologies: Triassic and Holocene fossil, paleo- and neo-ichnological evidence, and the identification of their burrowing signatures. Ichnos, 2(4), 291–314. https://doi.org/10.1080/10420949309380104
- Hasiotis, S. T., Mitchell, C. E., & Dubiel, R. F. (1993). Application of morphologic burrow interpretations to discern continental burrow architects: Lungfish or crayfish? Ichnos, 2(4), 315–333. https://doi.org/10.1080/10420949309380105
- Heinzen, E., Sinnwell, J., Atkinson, E., Gunderson, T., Dougherty, G. (2021). arsenal: An arsenal of “R” functions for large-scale statistical summaries (3.6.3). https://CRAN.R-project.org/package=arsenal
- Hembree, D. I., & Swaninger, E. S. (2018). Large Camborygma isp. in fluvial deposits of the Lower Permian (Asselian) Dunkard Group, southeastern Ohio, U.S.A. Palaeogeography, Palaeoclimatology, Palaeoecology, 491, 137–151. https://doi.org/10.1016/j.palaeo.2017.12.003
- Hunt, A. P., & Lucas, S. G. (2005). Nonmarine Permian track faunas from Arizona, USA: Ichnotaxonomy and ichnofacies. New Mexico Museum of Natural History and Science Bulletin, 30, 128–131.
- Joshi, N., Gutierrez, R. (2015). Image composite editor (2.0.3.0). Microsoft Corporation. https://www.microsoft.com/en-us/research/project/image-composite-editor/
- Krapovickas, V., Mángano, M. G., Buatois, L. A., & Marsicano, C. A. (2016). Integrated ichnofacies models for deserts: Recurrent patterns and megatrends. Earth-Science Reviews, 157, 61–85. https://doi.org/10.1016/j.earscirev.2016.03.006
- Manton, S. M. (1973). Evolution of arthropodan locomotory mechanisms. Part 11. Habits, morphology and evolution of Uniramia (Onychophora, Myriapoda, Hexapoda) and comparisons with Arachnida, together with a functional review of Uniramian musculature. Zoological Journal of the Linnean Society, 53(4), 257.
- Miller, G. L., & Ash, S. R. (1988). The oldest freshwater decapod crustacean, from the Triassic of Arizona. Palaeontology, 31(2), 273–279.
- Minter, N. J., Braddy, S. J., & Davis, R. B. (2007). Between a rock and a hard place: Arthropod trackways and ichnotaxonomy. Lethaia, 40(4), 365–375. https://doi.org/10.1111/j.1502-3931.2007.00035.x
- Peixoto, B., d C. P. e M., Mángano, M. G., Minter, N. J., Fernandes, L. B. d R., & Fernandes, M. A. (2020). A new insect trackway from the upper Jurassic–lower cretaceous Eolian sandstones of São Paulo State, Brazil: Implications for reconstructing desert paleoecology. PeerJ. 8, e8880. https://doi.org/10.7717/peerj.8880
- R Core Team. (2020). R: A language and environment for statistical computing. R Foundation for Statistical Computing. https://www.R-project.org/
- Rose, M., Harris, J. D., & Milner, A. R. C. (2021). A trace fossil made by a walking crayfish or crayfish-like arthropod from the Lower Jurassic Moenave formation of southwestern Utah, USA. PeerJ. 9, e10640. https://doi.org/10.7717/peerj.10640
- Sadler, C. J. (1993). Arthropod trace fossils from the Permian De Chelly Sandstone, northeastern Arizona. Journal of Paleontology, 67(2), 240–249. https://doi.org/10.1017/S0022336000032169
- Schindelin, J., Arganda-Carreras, I., Frise, E., Kaynig, V., Longair, M., Pietzsch, T., Preibisch, S., Rueden, C., Saalfeld, S., Schmid, B., Tinevez, J.-Y., White, D. J., Hartenstein, V., Eliceiri, K., Tomancak, P., & Cardona, A. (2012). Fiji: An open-source platform for biological-image analysis. Nature Methods, 9(7), 676–682. https://doi.org/10.1038/nmeth.2019
- Schmerge, J. D., Riese, D. J., & Hasiotis, S. T. (2013). Vinegaroon (Arachnida: Thelyphonida: Thelyphonidae) trackway production and morphology: Implications for media and moisture control on trackway morphology and a proposal for a novel system of interpreting arthropod trace fossils. PALAIOS, 28(2), 116–128. https://doi.org/10.2110/palo.2012.p12-012r
- Schneider, C. A., Rasband, W. S., & Eliceiri, K. W. (2012). NIH Image to ImageJ: 25 years of image analysis. Nature Methods, 9(7), 671–675. https://doi.org/10.1038/nmeth.2089
- Smith, J. (1909). Upland fauna of the old red sandstone formation of Carrick, Ayrshire. AW Cross.
- Taguchi, Y.-h., & Oono, Y. (2005). Relational patterns of gene expression via non-metric multidimensional scaling analysis. Bioinformatics, 21(6), 730–740. https://doi.org/10.1093/bioinformatics/bti067
- Thomson, T. J., Chure, D. J., Good, T. R., Kirkland, J. I., & Milner, A. R. C. (2015). Large arachnid tracks from the Eolian Triassic/Jurassic Nugget Sandstone, northeastern Utah. Abstracts with Programs - Geological Society of America, 47(7), 567.
- Trewin, N. H. (1994). A draft system for the identification and description of arthropod trackways. Palaeontology, 37, 811–823. http://cdn.palass.org/publications/palaeontology/volume_37/pdf/vol37_part4_pp811-823.pdf
- Walker, E. F. (1985). Arthropod Ichnofauna of the old red sandstone at Dunure and Montrose, Scotland. Earth and Environmental Science Transactions of the Royal Society of Edinburgh, 76(2-3), 287–297. https://doi.org/10.1017/S0263593300010506
- Wendruff, A. J., Babcock, L. E., Wirkner, C. S., Kluessendorf, J., & Mikulic, D. G. (2020). A Silurian ancestral scorpion with fossilised internal anatomy illustrating a pathway to arachnid terrestrialisation. Scientific Reports, 10(1), 14. https://doi.org/10.1038/s41598-019-56010-z