
Abstract
Multiple myeloma (MM) is a blood neoplasia characterized by abnormal proliferation of plasma cells. Various treatments such as stem cell transplant (SCT), proteasome inhibitors, immune-modulating drugs, monoclonal antibodies and selective inhibitors of nuclear export have been routinely used to treat MM. However, relapse and treatment resistance are common problems in MM patients. Treatments are enhanced by Dexamethasone (Dex), a synthetic steroid that activates the glucocorticoid receptor (GR) which leads to apoptosis. To evaluate the potential impact of GR expression on overall survival, MM patient data from the CoMMpass study of 650 patients were analyzed. Multivariate modeling results show that increased GR expression at diagnosis is associated with a decreased risk of dying relative to those with lower levels of expression.
Introduction
Multiple myeloma (MM) is a disease characterized by an abnormal accumulation of plasma cells. The evolution of clones, with a diverse mutational profile, ultimately gives rise to relapse and resistance. Treatment of MM has evolved with effective regimens that include proteasome inhibitors, immune-modulating drugs, monoclonal antibodies targeting cell surface proteins, and selective inhibitors of nuclear export. However, each regimen is enhanced by the addition of apoptosis-inducing dexamethasone (Dex).
Dex, a synthetic analog of cortisol, acts on the glucocorticoid receptor (GR) encoded by the NR3C1 gene. Upon Dex binding, the activated GR enters the nucleus and interacts with the DNA glucocorticoid-responsive-elements or other transcription factors to affect transcription of AP-1 and NF-κB target genes, which regulate immunity and inflammation [Citation1]. In addition, the Dex-GR complex can directly interfere with several kinases such as MAPK, PI3K and AKT that control cell apoptosis, proliferation, differentiation and inflammatory response [Citation1]. In fact, there is a dual direct impact against plasma cells and an indirect effect on immunologic cells [Citation2].
GR expression is critical for the sensitivity of the myeloma cells to Dex. Specifically, Kervoelen et al. showed that reduced GR expression leads to diminished cytotoxic effect of Dex in MM cell lines [Citation3]. We previously demonstrated alternative splicing of GR with loss of the ligand-binding domain as well as independently loss of the overall GR expression in both MM cell lines and patient samples [S. Rosen, pers. comm.].
The objective of this study was to investigate the prognostic significance of GR expression- encoded by the NR3C1 gene as well as the chromosomal aberrations on overall survival in patients newly diagnosed with MM.
Materials and methods
Patient, disease, treatment, RNA- and DNA-seq, and survival data were obtained from the Clinical Outcomes in Multiple Myeloma to Personal Assessment (CoMMpass) study (https://research.themmrf.org/, clinical trial number NCT01454297), version IA13 released in 2018. CoMMpass researchers track patients from initial diagnosis over a minimum of 5 years.
Gene expression values, FPKM, were calculated using Cufflinks [Citation4]. Chromosomal aberrations were determined from DNA-seq processed for copy number variation analysis. Since 2011, the CoMMpassSM study has enrolled over 1000 newly diagnosed multiple myeloma patients who have not yet initiated therapy for their disease. Complete demographics, cytogenetics (chromosomal aberrations), NR3C1 gene expression values, and survival were available on 677 MM patients for analysis. Survival estimates were calculated based on the Kaplan–Meier product-limit method. Patients who were alive at the time of analysis were censored at the last contact date. Overall survival (OS) was measured from the date of diagnosis to death from any cause. The significance of demographic, disease, NR3C1 expression and cytogenetic features were assessed using survival analysis and univariate Cox proportional hazards regression analysis.
Two-step multivariate Cox regression analysis was used to model the time to event endpoint, overall survival, as a function of the prognostic variables of interest recorded at the time of diagnosis: age, gender, albumin level, NR3C1 FPKM, hyperdiploid chromosome count, the following chromosomal aberrations: 1q21, 8q24, 17q23, 5p15, 7q22, 6p22, 5q31, 3p22, 15q15, 13q14, 11p15, 17p13, 6q25, 12q21, 14q23, 4p15, 10q23, 2p23, 21q22, 20q13, 11q23, 1p22, 21q21, 16q22, 7p14, 3q21, Xq22, 4q31, 15q26, Xp11, 20p12, 12p13, 9p13, 8p22, 9q33, 16p12, 19q13, 18p11, 22q13, 13q34, 10p14, 18q21, 2q22, and 19p13 as well as translocations t(4;14), t(6;14), t(8;14), t(8;14), t(11;14), t(12;14), t(14;16) and t(14;20). Note, as expected, the International Staging System (ISS) value was found to be significantly associated with an increased relative risk (RR) of mortality, i.e. RR for stages 2 and 3 were 2.9 and 5.2 respectively, p < 0.05. Because ISS is a composite characteristic, which is not directly indicative of the disease mechanism, it was excluded from modeling. At the first step, the survival data for all patients were modeled to determine statistically significant variables. At the second step, the patients were stratified into two subgroups: (i) those which underwent SCT, n = 338 and (ii) those which did not, n = 312.
A relationship between NR3C1 expression and chromosomal aberrations was assessed in a linear model Expression(NR3C1) ∼ const + Σ(aiVi), where ai are coefficients and Vi are the following variables: hyperdiploid chromosome count, 1q21, 8q24, 17q23, 5p15, 7q22, 6p22, 5q31, 3p22, 15q15, 13q14, 11p15, 17p13, 6q25, 12q21, 14q23, 4p15, 10q23, 2p23, 21q22, 20q13, 11q23, 1p22, 21q21, 16q22, 7p14, 3q21, Xq22, 4q31, 15q26, Xp11, 20p12, 12p13, 9p13, 8p22, 9q33, 16p12, 19q13, 18p11, 22q13, 13q34, 10p14, 18q21, 2q22, 19p13, t(4;14), t(6;14), t(8;14), t(8;14), t(11;14), t(12;14), t(14;16), and t(14;20).
Results and discussion
NR3C1 expression, baseline treatment, demographic characteristics, chromosomal aberrations and other characteristics were available for 650 patients. For the first step of analysis (see Methods), survival data for all patients were modeled and the effects of the following variables were found statistically significant (p < 0.05): NR3C1 FPKM, Albumin, Age, 6q25, 17q23, 1q21, 5p15, 6p22, 8q24, t(14;16), and t(14;20) (). All chromosomal aberrations were copy number gains except for 6q25, which was a deletion. These variables were included in the second step of analysis, whereby the patients were stratified by the stem cell transplant (SCT) treatment. Statistically significant effects are shown in . In particular, the increased expression of the NR3C1 gene is associated with decreased risk of dying in SCT– and SCT + patients. It is important to correctly interpret the meaning of the risk associated with NR3C1 expression estimated by the Cox model, e.g. the coefficient −0.03 in . The coefficient is measured per unit of expression, which is a normalized count of sequencing reads (FPKM or RPKM, 5). For example, let us consider two patients having similar characteristics except for NR3C1 expression. If the difference in expression is, for instance, 30, the relative risk (RR) of dying for the one having higher expression is exp(–0.03 * 30) = 0.41 compared to the one with lower expression.
Table 1. Variables significantly associated with survival for all patients.
Table 2. Variables significantly associated with survival stratified by stem cell transplantation.
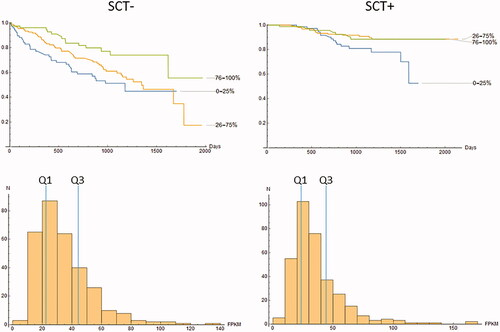
As the significance of the NR3C1 expression to survival has been established (above), for visualization purposes both SCT– and SCT + groups were arbitrary split into quartiles by the NR3C1 FPKM value to further explore and visualize the data. Three subgroups of patients were selected, i.e. the 1st, 2nd + 3rd and 4th quartiles. The distribution of NR3C1 FPKMs is shown in , with marked quartiles Q1 and Q3. Comparison of the Kaplan–Meier curves reveals that patients from the lowest show worse survival than those of the highest quartile.
Figure 1. Survival characteristics of the SCT– (left panel) and SCT+ (right panel) patients. Upper row: K–M curves, bottom row: distribution of NR3C1 expression values. Quartiles Q1 and Q3 are marked as vertical lines.
Decreased expression of NR3C1 as a predictor of poor survival in MM has been reported earlier [Citation5]; however, the CoMMpass study differs in several aspects. First, CoMMpass investigated about twice the number of patients and the gene expression was measured with a new technology (RNA-Seq). Second, our analysis controls for many sequencing-defined chromosomal aberrations from the entire genome versus just two expression profiling-defined TP53 deletion and Chr 5q amplification aberrations [Citation5]. Third, CoMMpass patients were required to receive an immunomodulatory agent or proteasome inhibitor as frontline therapy, while thalidomide was used in as a randomized maintenance arm in Total Therapy 2. Walker et al. [Citation6] conducted a study of a large cohort of MM patients, whereby progression-free and overall survival was modeled with variables such as genetic aberrations and other clinical characteristics, similar to our study. Walker et al., however, did not consider gene expression of NR3C1 or other genes.
We show () that the 1q21 gain is associated with an increased risk of dying contrary to a recent study by Chen et al. [Citation6]. Interestingly, in agreement with our findings, Abramova et al. [Citation7] reports a significant contribution of 1q21 gain to the risk of dying in MM patients (n = 134). The number of patients may be the key feature of ours and Abramova’s study that elucidated the effect, cf. Chen’s study, n = 63 patients. We also found that in the SCT-group, the copy number gain of the locus 8q24 is associated with the increased risk of dying. This is consistent with the notion that this amplification is associated with MYC overexpression [Citation8]. Increased albumin concentration is indicative of better survival, which is consistent with a previous study [Citation9]. Certain translocations were previously shown to be associated with poor prognosis [Citation10]. We confirm the deleterious effects of the translocations t(14;16), t(14;20) . Of note, although Walker et al. [Citation6] used a different methodology in their statistical analysis, they also reported deleterious effects of gains 1q21 (RR 1.8), 8q24 (RR 1.73, borderline significance) as well as t(14;16)/t(14;20) (HR 1.77, borderline significance).
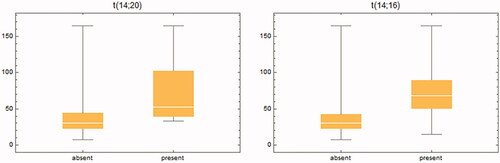
Figure 2. Effect of translocations t(14:20) and t(14:16) on NR3C1 expression for all patients.
In addition, we detected several novel effects of chromosomal aberrations previously not reported in the context of MM patients (). The 17q23 amplification conveys an increased risk of dying. This aberration is known to be associated with poor prognosis in HER2+ breast cancer due to the co-amplification of MIR21 and WIP1, which cooperate with HER2 in the genesis of tumor [Citation11]. We also found that the gain at the locus 5p15 is associated with an increased risk of dying. The locus 5p15 contains the TERT oncogene, therefore the amplification may explain the carcinogenesis of certain tumors [Citation12]. The 6p22 gain in MM patients has been known before [Citation13]; however, we detected its beneficial effect on survival. Finally, we report a deleterious deletion 6q25.
The effect of genomic aberrations including translocations on NR3C1 was explored. The linear regression model reveals several variables significantly associated with the NR3C1 expression (). Of interest, the presence of translocations t(14;20) and t(14;16) is associated with increased NR3C1 expression (), although these translocations have a deleterious effect on survival.
Table 3. Variables significantly associated NR3C1expression (linear model).
Based on previous work, one would expect the model to show significance for previously-established high risk 17p13 deletion [Citation6,Citation14]. Indeed, RR associated with this abnormality was 1.46, however not statistically significant. Merz et al ([Citation15] and references therein) indicate that there is a large heterogeneity of survival associated with the 17p13 deletion and a combination with other abnormalities need to be considered. It is possible that in our multivariate model with many chromosomal abnormalities, the risk of 17p13 deletion is distributed among the other abnormalities.
In conclusion, our findings indicate that the NR3C1 expression measured prior to any treatment is associated with improved survival. Certainly, more work is needed to establish NR3C1 expression on the protein level and to correlate with survival of the patients treated with Dex. However, the gene expression observations revealed in this report highlight the value of NR3C1 expression at baseline on the long-term outcome of patients.
Acknowledgements
We are thankful to Dr. Alessandro Lagana of Genetics and Genomic Sciences at the Icahn School of Medicine at Mount Sinai New York for bioinformatics support and scientific advices.
Disclosure statement
Research reported in this publication included work supported by the National Cancer Institute of the National Institutes of Health under grant number P30CA033572. The content is solely the responsibility of the authors and does not necessarily represent the official views of the National Institutes of Health.
References
- Petta I, Dejager L, Ballegeer M, et al. The Interactome of the Glucocorticoid Receptor and Its Influence on the Actions of Glucocorticoids in Combatting Inflammatory and Infectious Diseases. Microbiol Mol Biol Rev. 2016;80(2):495–522.
- Cruz-Topete D, Cidlowski JA. One hormone, two actions: anti- and pro-inflammatory effects of glucocorticoids. Neuroimmunomodulation. 2015;22(1-2):20–32.
- Kervoëlen C, Ménoret E, Gomez-Bougie P, et al. Dexamethasone-induced cell death is restricted to specific molecular subgroups of multiple myeloma. Oncotarget. 2015;6(29):26922–26934.
- Roberts A, Trapnell C, Donaghey J, et al. Improving RNA-Seq expression estimates by correcting for fragment bias. Genome Biol. 2011;12(3):R22.
- Heuck CJ, Szymonifka J, Hansen E, et al. Thalidomide in total therapy 2 overcomes inferior prognosis of myeloma with low expression of the glucocorticoid receptor gene NR3C1. Clin Cancer Res. 2012;18(19):5499–5506.
- Walker BA, Mavrommatis K, Wardell CP, et al. A high-risk, double-hit, group of newly diagnosed myeloma identified by genomic analysis. Leukemia. 2019;33(1):159–170.
- Chen D, Zhou D, Xu J, et al. Prognostic value of 1q21 gain in multiple myeloma. Clin Lymphoma Myeloma Leuk. 2019;19(3):e159–e164.
- Liu Y, Xu J, Choi HH, et al. Targeting 17q23 amplicon to overcome the resistance to anti-HER2 therapy in HER2+ breast cancer. Nat Commun. 2018;9(1):4718
- Walker BA, Leone PE, Chiecchio L, et al. A compendium of myeloma-associated chromosomal copy number abnormalities and their prognostic value. Blood. 2010;116(15):e56–e65.
- Merz M, Hielscher T, Seckinger A, et al. Baseline characteristics, chromosomal alterations, and treatment affecting prognosis of deletion 17p in newly diagnosed myeloma. Am J Hematol. 2016;91(11):E473–E477.
- Abramova TV, Obukhova TN, Mendeleeva LP, et al. [Prognostic value of 1q21 amplification in multiple myeloma]. Ter Arkh. 2017;89(7):32–38.
- Chiecchio L, Dagrada GP, White HE, et al. Frequent upregulation of MYC in plasma cell leukemia. Genes Chromosomes Cancer. 2009;48(7):624–636.
- Lyu J, Song Z, Chen J, et al. Whole-exome sequencing of oral mucosal melanoma reveals mutational profile and therapeutic targets. J Pathol. 2018;244(3):358–366.
- Borsi E-C, Bucur A, Oncu CP, et al. First line therapy in multiple myeloma: VAD vs bortezomib –dexamethasone. Rev Chim. 2019;70(3):1017–1022.
- Chang H, Qi C, Yi QL, et al. p53 gene deletion detected by fluorescence in situ hybridization is an adverse prognostic factor for patients with multiple myeloma following autologous stem cell transplantation. Blood. 2005;105(1):358–360.