
Abstract
The controlling nutritional status (CONUT) score is a simplified nutritional index calculated from serum albumin, total cholesterol, and total lymphocyte count. This study evaluated the prognostic impact of the CONUT score on overall survival (OS) in patients with peripheral T-cell lymphoma (PTCL). A multicenter, retrospective cohort study including 99 patients with PTCL was conducted. The CONUT score was significantly higher in the non-survivor group (median 5, range 0-12) than in the survivor group (median 3, range 0-11; p = 0.026). The CONUT score was an independent prognostic factor in a multivariable Cox proportional hazards model (hazard ratio 1.119, 95% confidence interval 1.021-1.227, p = 0.017). No significant effect-modification by the International Prognostic Index (IPI) was observed, and the CONUT score affected the prognosis of PTCL regardless of the IPI (P for interaction = 0.208). In conclusion, the CONUT score is an independent prognostic factor for PTCL irrespective of IPI category.
Introduction
Peripheral T cell lymphoma (PTCL) is a heterogeneous group arising from mature T-cells that account for less than 15% of non-Hodgkin’s lymphomas in adults [Citation1]. Many patients with PTCL are treated with CHOP [cyclophosphamide (CPA), doxorubicin, vincristine (VCR), prednisolone (PSL)] or CHOP-like regimens, but the prognosis of patients with PTCL is inferior to that of patients with aggressive B-cell lymphoma [Citation2]. Even though a new treatment strategy using CD30-directed antibody-drug conjugate (brentuximab vedotin) has recently been developed for CD30-positive PTCL [Citation3], the current treatment strategies for PTCL remain unsatisfactory, and there is a need for better therapies based on accurate prediction of patients’ prognosis. Prognostic risk stratification has been developed for PTCL, including the International Prognostic Index (IPI) [Citation4,Citation5] or the Prognostic Index for PTCL-U (PIT) [Citation6], but patients’ comorbidities have not been considered in these indices. Thus, there are modest discriminative abilities that are not sufficient for risk stratification to be clinically useful [Citation7].
Poor nutrition is a frequent comorbidity in cancer patients and correlates with disease progression and survival [Citation8]. The controlling nutritional status (CONUT) score is a simplified nutritional index used to detect malnutrition and is calculated from serum albumin, total cholesterol, and total lymphocyte count [Citation9]. A higher CONUT score indicates poorer nutritional status, which is classified into four categories (normal, mild, moderate, and severe degree of undernutrition) according to the CONUT score (). Several cohort studies have reported that the CONUT score is an independent prognostic factor in solid cancer patients [Citation10]. In several hematological malignancies, including B-cell lymphoma, leukemia, and myeloma [Citation11–16], it was reported that overall survival (OS) was significantly lower in the poor nutrition group with higher CONUT scores. However, whether the nutritional status has a clinical impact in patients with PTCL remains unclear.
Table 1. Assessment of undernutrition degree by the CONUT score.
In this study, the aim was to evaluate the prognostic impact of the CONUT score on OS in patients with PTCL. The differential effects of IPI categories on survival in association with the CONUT score were also explored using restricted cubic spline (RCS) to assess non-linear correlations with OS.
Materials and methods
Patient cohort
A multicenter, retrospective cohort study was conducted by the Gifu Hematology Study Group in Japan. The Gifu Prefecture of Japan has a population of 2.03 million (2015 census). Data on PTCL admissions from June 2004 to December 2019 were retrospectively collected. All histologically proven PTCL cases according to the World Health Organization (WHO) classification [Citation11] with patients aged 18 years and older, were eligible for inclusion. PTCL subtypes included PTCL not otherwise specified (PTCL-NOS), angioimmunoblastic T-cell lymphoma (AITL), anaplastic large cell lymphoma (ALCL) with or without anaplastic large cell lymphoma kinase (ALK), enteropathy-associated T-cell lymphoma (EATL), and hepatosplenic T-cell lymphoma (HSTL). Exclusion criteria were any previous other chemotherapy for lymphoma or diagnosed with adult T-cell leukemia/lymphoma (ATLL) or extranodal NK/T-cell lymphoma, nasal type. Patients with central nervous system involvement or human immunodeficiency virus were also excluded. Variables included age, Eastern Cooperative Oncology Group Performance Status (EGOG PS), number of extranodal sites, Ann Arbor stage, serum lactate dehydrogenase (LDH) levels, soluble interleukin two receptor (sIL-2R), bulky mass (> 7.5 cm), B symptoms, bone marrow (BM) involvement, and all-cause death. The IPI was calculated using these data, and four risk categories were created [Citation12]. The treatment strategy was determined by the attending physician. If the patient received treatment with the intent to maximize the quality of life without a specific antineoplastic regimen, it was classified as best supportive care (BSC). BSC included steroids, antibiotics, analgesics, antiemetics, blood transfusions, or palliative radiation to control pain. This study was conducted in accordance with the principles of the Declaration of Helsinki and was approved by the ethics committee of Gifu University Graduate School of Medicine (number: 2019-255). The Institutional Review Board of each participating center approved the protocol with a waiver of informed consent prior to data collection.
Controlling nutritional status score
As previously reported, the CONUT score was calculated from the serum albumin, total cholesterol, and total lymphocyte count [Citation9]. The data from the blood tests at the time of diagnosis were used. If abnormal lymphocytes were identified visually, they were excluded from the total lymphocyte count. Patients were divided into four categories according to the degree of undernutrition as follows: normal (0-1), mild (2-4), moderate (5-8), and severe (9-1 2) ().
Statistical analysis
The primary endpoint was OS, calculated from diagnosis to the last follow-up or death from any cause. Patients who became untraceable were censored at the last observation. Median follow-up was calculated based on the reverse Kaplan-Meier method. Continuous variables are expressed as median values and range, and the groups were compared using the Mann-Whitney U test. Categorical variables are expressed as numbers and percentages, and the groups were compared using the chi-squared test or Fisher’s exact test, as appropriate. A multivariable Cox proportional hazards model was fit to assess associations between prior specified traditional predictors of PTCL and OS. Sex, ALK-positive ALCL, BM involvement, IPI, CONUT score, and BSC were selected as predictors and used as covariates in a multivariable analysis. Non-linear regression with an RCS with 4 knots was used to examine the presence of a non-linear relationship between the CONUT score and mortality risk. The number of knots was determined using Akaike’s information criterion. The optimal cutoff value of the CONUT score was determined by receiver operating characteristic (ROC) curve analysis using Youden’s index. Survival curves for each group were estimated using Kaplan-Meier’s method and compared using the log-rank test. Examination of the effect modification on the association between the CONUT score and IPI categories was planned a priori. A two-sided p < 0.05 and P for interaction < 0.15 were considered significant. Statistical analyses were performed with R (version 3.6.2), with the package rms for non-linear regression modeling, or EZR (version 1.37), which is a graphical user interface for R [Citation13].
Results
Patients’ characteristics
A total of 132 patients newly diagnosed with PTCL at seven institutions of the Gifu Hematology Study Group were enrolled. Thirty patients with insufficient data and 3 patients with a treatment history of diffuse large B-cell lymphoma (DLBCL) were excluded, and the remaining 99 patients were included in this analysis (Supplemental Figure S1). Patient characteristics at diagnosis and comparing survivor (n = 44) and non-survivor groups (n = 55) are summarized in . The median age at diagnosis was 67 (range 16–87) years, and the most common pathological diagnosis was PTCL-NOS (n = 65), followed by AITL (n = 13) and ALK-positive ALCL (n = 10). There were no patients with abnormal lymphocytes. The median CONUT score was 3 (0-12), and nutritional status was normal (0-1), mild (2-4), moderate (5-18), and severe (9-12) in 16 (16.2%), 45 (45.5%), 23 (23.3%), and 15 (15.2%) patients, respectively. Forty-four patients (44.4%) received CHOP, 43 patients (43.4%) received THP-COP (CPA, tetrahydropyranyl adriamycin, VCR, OSL), and 10 patients (10.1%) received BSC. None of the patients received brentuximab vedotin as first-line therapy, and 11 patients (11.1%) received upfront autologous stem cell transplantation. There were more patients with high-intermediate or high IPI risk in the non-survivor group (72.2%) compared to the survivor group (38.7%) (p < 0.001). The CONUT score was significantly higher in the non-survivor group (median 5, range 0-12) than in the survivor group (median 3, range 0-11) (p = 0.026). The results of nutritional status according to the CONUT score and patient characteristics are shown in . The prevalence of patients with ECOG PS ≥ 2, sIL-2R ≥ 2000 U/ml, BMI < 22 kg/m2, B symptoms, or BM involvement was significantly higher in patients with moderate or severe undernutrition (CONUT score ≥ 5) than normal or mild undernutrition (CONUT score < 5). Patients with ECOG PS ≥ 2 had a significantly higher mean CONUT score than those with ECOG PS < 2 (6.8 ± 3.4 vs. 3.3 ± 2.5, p < 0.001).
Table 2. Patients' characteristics at diagnosis.
Table 3. Nutritional status according to the CONUT score and patients' characteristics.
Predictors of overall survival
The median follow-up was 6.82 (interquartile range: 3.05-9.85) years, 55 patients (55.6%) died, and 37 of 55 (67.3%) patients died from lymphoma. The median OS was 3.72 years [95% confidence interval (CI) 1.60-6.79 years)], and 5-year estimated OS was 47.5% (95% CI 36.7-57.5%) (Supplemental Figure S2). The result of the univariate OS analysis is shown in Supplemental Table S1. Patients with poor nutritional status with higher CONUT scores showed significantly worse OS (p < 0.001). In particular, the lower the albumin (p = 0.002) and total cholesterol (p = 0.015), the poorer the OS, but the total lymphocyte count was not associated with OS (p = 0.450). A multivariable Cox proportional hazards model for OS was evaluated (). The IPI high-risk group [hazard ratio (HR) 3.895, 95% CI 1.250-12.140, p = 0.019], the CONUT score (HR 1.119, 95% CI 1.021-1.227, p = 0.017), and BSC (HR 6.261, 95% CI 2.325-16.860, p < 0.001) were the independent prognostic factors for OS. The correlation between the CONUT score and OS was also examined in the covariate-adjusted Cox proportional hazards model with RCS. The Cox proportional hazards model with RCS showed the significant effect of the CONUT score on mortality risk, as did the Cox proportional hazards model (, P for effect of CONUT = 0.019). The relationship between the CONUT score and OS did not appear to be linear, but it was almost S-shaped. In those with CONUT score < 5, the log hazard ratio of the mortality risk was lower than 0 but plateaued. With CONUT scores 5–8, the log hazard ratio of the mortality risk was over 0 and rose steadily as the CONUT score increased. For CONUT scores > 8, the curve of mortality risk was continually higher than 0 but approached a plateau.
Figure 1. Association between the CONUT score and overall survival using the Cox proportional hazards model with restricted cubic spline with 4 knots. The solid line represents the log hazard ratio, and the shaded area is the 95% confidence interval. CONUT: controlling nutritional status.
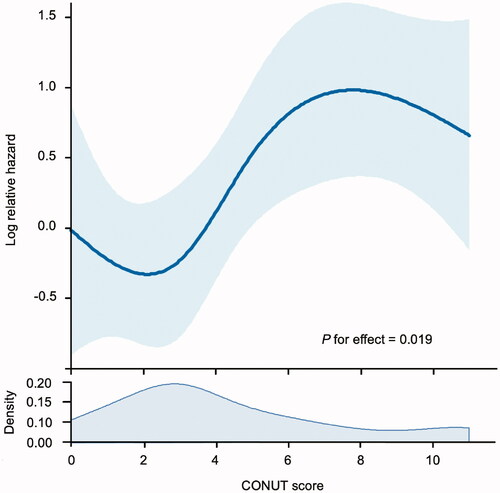
Table 4. Univariate and multivariate COX proportional hazards analysis of clinical factors significantly associated with overall survival.
Prognostic impact of the CONUT score on overall survival
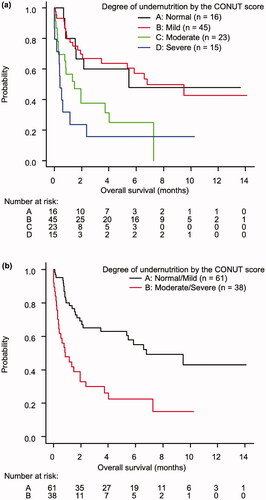
According to the ROC curves using Youden’s index, the optimal cutoff value for the CONUT score was 5 (sensitivity 50.9%, specificity 77.3%), and the area under the curve (AUC) was 0.629 (95% CI 0.519-0.740) (Supplemental Figure S3). The Kaplan-Meier curves for the four groups of CONUT scores showed a worse prognosis for moderate (5-8) and severe (9-12) patients compared to normal (0-1) and mild (2-4) patients (). When analyzed in two groups according to the CONUT score, the moderate and severe group with CONUT scores ≥ 5 had a worse prognosis compared to the normal and mild group with CONUT scores < 5 [median OS: 0.85 years (95% CI 0.35 − 1.97 years) vs. 6.79 years (95% CI 3.46 years- not available), p < 0.001] ().
Figure 2. Kaplan-Meier curves of overall survival among 4 groups (A) and 2 groups (B) of the CONUT score. CONUT: controlling nutritional status.
Analysis of effect modification by IPI
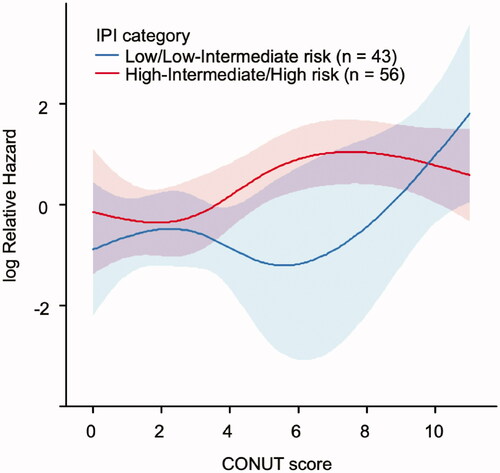
To assess whether IPI had an interaction effect with the impact of the CONUT score on OS, a multivariable Cox proportional hazards model was created with RCS in the binary group according to the IPI (low/low-intermediate risk: < 3 vs. high-intermediate/high risk: ≥ 3) (). No significant effect-modification by the IPI was observed, and the CONUT score affected the prognosis of PTCL regardless of the IPI (P for interaction = 0.208). How the two classifications of the CONUT score affect the prognosis was examined in the groups with lower and higher IPI. In the lower IPI group, there was no significant difference in OS by the CONUT score (p = 0.396) (Supplemental Figure S4A), but in the higher IPI group, there was a significant difference in OS by CONUT score (p = 0.008) (Supplemental Figure S4B).
Figure 3. Association between the CONUT score and overall survival of four groups divided by the International Prognostic Index using a covariate-adjusted restricted cubic spline hazard model. The solid line represents the log hazard ratio, and the shaded area is the 95% confidence interval. IPI: International Prognostic Index; CONUT: controlling nutritional status.
Discussion
This retrospective cohort study showed the prognostic utility of the CONUT score in patients with PTCL. The main findings of the study were as follows: first, the CONUT score was an independent prognostic factor for OS in PTCL; second, the Cox proportional hazards model with RCS showed an S-shaped relationship between the CONUT score and OS; and third, no significant interaction was found between the IPI and the CONUT score.
First, the present data showed that the CONUT score was associated with predicting OS across the entire spectrum of PTCL. The CONUT score is an efficient nutritional screening tool for assessing the nutritional status of patients and is useful for early detection of undernutrition [Citation9]. Malnutrition is prevalent in cancer patients, and nutritional status has a prognostic impact on disease progression and survival outcome [Citation8]. The frequent malnutrition in cancer patients may be due to decreased activity, inadequate intake of food, and abnormal catabolic metabolism. Poor nutritional status is correlated with the toxicity of chemotherapy, resulting in treatment reduction or interruption [Citation14]. The present findings were consistent with previous reports in other hematological malignancies, which showed the significant prognostic utility of the CONUT score in ATLL [Citation15], DLBCL [Citation16,Citation17], multiple myeloma [Citation18,Citation19], myelodysplastic syndrome (MDS), and acute myeloid leukemia (AML) [Citation20]. This study is the first to confirm the prognostic impact of the CONUT score in patients with PTCL.
Second, the Cox proportional hazards model with RCS showed an S-shaped relationship between the CONUT score and OS. This relationship indicated that patients with a CONUT score ≥ 5 had a log hazard ratio of mortality risk over 0. Similarly, the optimal cutoff value of the CONUT score using the ROC curve for predicting the OS of PTCL was 5, the AUC was 0.629 (95% CI 0.519-0.740), sensitivity was 50.9%, and specificity was 77.3%. Nagata et al. reported the usefulness of the CONUT score in DLBCL; using an ROC curve with a cutoff value of 4, the AUC was 0.71 (95% CI 0.59-0.78), sensitivity was 59.3%, and specificity was 77.8% [Citation16]. Sakurai et al. also reported the utility of the CONUT score in MDS and AML; using an ROC curve with a cutoff value of 5, the AUC was 0.71 (95% CI 0.59-0.83), sensitivity was 84.4%, and specificity was 60.9%. The present finding was also supported by previous studies and involved only PTCL patients.
Third, no significant effect modification was found between the IPI and the CONUT score. The IPI was developed to predict outcomes in patients with aggressive non-Hodgkin lymphoma [Citation12], and the usefulness of the IPI for PTCL was assessed in several studies [Citation4,Citation5]. PTCL is not a homogeneous disease [Citation11]; thus, the modification by the IPI of the impact of the CONUT score on OS was evaluated. Although various prognostic factors for PTCL have been proposed, none has been reported to be superior to the IPI [Citation7]. Even patients with low risk of the IPI have a poor prognosis. Recently, the prognostic importance of malnutrition assessment tools that directly reflect patient frailty independent of the IPI has been recognized [Citation16]. The CONUT score was an IPI-independent predictor for PTCL in the present study. Thus, the combination of the IPI with the CONUT score can serve to refine risk stratification further to determine treatment strategy. Unfortunately, the present results could not provide the optimal treatment, and future study is required to improve the prognosis of patients with PTCL.
PTCL is heterogeneous, and the prediction of chemosensitivity is important to select the optimal treatment. Various prognostic factors, such as the IPI and PIT, have been developed and validated for PTCL, but they have not led to stratified treatment [Citation7]. Since patients with a high CONUT score may not be able to achieve long-term survival with conventional treatment, it is necessary to establish new treatment methods or consider individualized treatment options in the future. The results of a systematic review of nutritional status and nutritional interventions in cancer patients showed that nutritional interventions may improve quality of life and decrease postoperative complications, although it is not clear that they prolong survival [Citation21]. Nutritional interventions such as tube feeding or total parenteral nutrition may be useful to improve the prognosis of PTCL patients with high CONUT scores, and prospective studies are needed.
The present study was a multicenter, cohort study that was able to collect a relatively large number of patients with PTCL and to follow their long-term course. However, there were several limitations to this study. First, the current study was retrospective and could have had selection bias. Second, the study did not provide detailed information on treatment dose intensity or treatment toxicity. Third, the present study could not validate comparisons or combinations with other nutritional indicators or frailty scales. Finally, there was no validation for the cutoff of the CONUT score, and these data warrant external validation in a future study.
In conclusion, the nutritional status evaluated by the CONUT score appears to be a prognostic factor in patients with PTCL, irrespective of IPI category.
Acknowledgments
The authors are grateful to the members of the Gifu Hematology Study Group for their support of this study.
Disclosure statement
The authors report no conflict of interest.
References
- Chihara D, Ito H, Matsuda T, et al. Differences in incidence and trends of haematological malignancies in Japan and the United States. Br J Haematol. 2014;164(4):536–545.
- Allen PB, Pro B. Therapy of peripheral T cell lymphoma: Focus on nodal subtypes. Curr Oncol Rep. 2020;22(5):44.
- Horwitz S, O'Connor OA, Pro B, ECHELON-2 Study Group, et al. Brentuximab vedotin with chemotherapy for CD30-positive peripheral T-cell lymphoma (ECHELON-2): a global, double-blind, randomised, phase 3 trial. Lancet. 2019;393(10168):229–240.
- Gisselbrecht C, Gaulard P, Lepage E, et al. Prognostic significance of T-cell phenotype in aggressive non-Hodgkin’s lymphomas. Groupe d’Etudes des lymphomes de l’Adulte (GELA). Blood [Internet]. 1998;92:76–82.
- Weisenburger DD, Savage KJ, Harris NL, for the International Peripheral T-cell Lymphoma Project, et al. Peripheral T-cell lymphoma, not otherwise specified: a report of 340 cases from the international peripheral T-cell lymphoma project. Blood [Internet]. 2011;117(12):3402–3408.
- Gallamini A, Stelitano C, Calvi R, et al. Peripheral T-cell lymphoma unspecified (PTCL-U): a new prognostic model from a retrospective multicentric clinical study. Blood [Internet]. 2004;103(7):2474–2479.
- Marchi E, O'Connor OA. The rapidly changing landscape in mature T-cell lymphoma (MTCL) biology and management . CA Cancer J Clin. 2020;70(1):47–70.
- Mantzorou M, Koutelidakis A, Theocharis S, et al. Clinical value of nutritional status in cancer: What is its impact and how it affects disease progression and prognosis? Nutr Cancer. 2017;69(8):1151–1176.
- Ignacio de Ulíbarri J, González-Madroño A, de Villar NGP, et al. CONUT: a tool for controlling nutritional status. First validation in a hospital population. Nutr Hosp [Internet]. 2005;20:38–45.
- Kheirouri S, Alizadeh M. Prognostic potential of the preoperative controlling nutritional status (CONUT) score in predicting survival of patients with cancer: a systematic review. Adv Nutr [Internet]. 2020;12(1):234–250.
- Swerdlow SH, Campo E, Pileri SA, et al. The 2016 revision of the world health organization classification of lymphoid neoplasms. Blood [Internet]. 2016;127(20):2375–2390.
- International Non-Hodgkin’s Lymphoma Prognostic Factors Project. A predictive model for aggressive Non-Hodgkin’s lymphoma. N Engl J Med [Internet]. 1993;329:987–994.
- Kanda Y. Investigation of the freely available easy-to-use software “ 'EZR' for medical statistics” . Bone Marrow Transplant. 2013;48(3):452–458.
- Arends J, Bachmann P, Baracos V, et al. ESPEN guidelines on nutrition in cancer patients. Clin Nutr. 2017;36(1):11–48.
- Ureshino H, Kusaba K, Kidoguchi K, et al. Clinical impact of the CONUT score and mogamulizumab in adult T cell leukemia/lymphoma. Ann Hematol. 2019;98(2):465–471.
- Nagata A, Kanemasa Y, Sasaki Y, et al. Clinical impact of controlling nutritional status score on the prognosis of patients with diffuse large B‐cell lymphoma. Hematol Oncol [Internet]. 2020;38(3):309–317.
- Matsukawa T, Suto K, Kanaya M, et al.; North Japan Hematology Study Group (NJHSG). Validation and comparison of prognostic values of GNRI, PNI, and CONUT in newly diagnosed diffuse large B cell lymphoma. Ann Hematol. 2020;99(12):2859–2868.
- Okamoto S, Ureshino H, Kidoguchi K, et al. Clinical impact of the CONUT score in patients with multiple myeloma. Ann Hematol. 2020;99(1):113–119.
- Kamiya T, Ito C, Fujita Y, et al. The prognostic value of the controlling nutritional status score in patients with multiple myeloma. Leuk Lymphoma. 2020;61(8):1894–1900.
- Sakurai A, Nakazato T. The prognostic value of the controlling nutritional status score in patients with myelodysplastic syndrome and acute myeloid leukemia with myelodysplasia related changes treated with azacitidine. Leuk Lymphoma. 2020;61(12):2995–2997.
- Hamaker ME, Oosterlaan F, van Huis LH, et al. Nutritional status and interventions for patients with cancer - A systematic review. J Geriatr Oncol. 2021;12(1):6–21.