
 ?Mathematical formulae have been encoded as MathML and are displayed in this HTML version using MathJax in order to improve their display. Uncheck the box to turn MathJax off. This feature requires Javascript. Click on a formula to zoom.
Abstract
Chromosomal translocations and gene mutations are characteristics of the genomic profile of acute myeloid leukemia (AML). We aim to identify a gene signature associated with poor prognosis in AML patients with FLT3-ITD compared to AML patients with NPM1/CEBPA mutations. RNA-sequencing (RNA-Seq) count data were downloaded from the UCSC Xena browser. Samples were grouped by their mutation status into high and low-risk groups. Differential gene expression (DGE), machine learning (ML) and survival analyses were performed. A total of 471 differentially expressed genes (DEGs) were identified, of which 16 DEGs were used as features for the prediction of mutation status. An accuracy of 92% was obtained from the ML model. FHL1, SPNS3, and MPZL2 were found to be associated with overall survival in FLT3-ITD samples. FLT3-ITD mutation confers an indicative gene expression profile different from NPM1/CEBPA mutation, and the expression of FHL1, SPSN3, and MPZL2 can serve as prognostic indicators of unfavorable disease.
Introduction
Acute myeloid leukemia (AML) makes up about 20% of acute leukemia in pediatric patients [Citation1]. Common clinical symptoms of AML include leukocytosis, anemia, and thrombocytopenia. It is a very heterogeneous disease accounting for more than half of the deaths from leukemia [Citation2,Citation3]. Deciphering disease heterogeneity at the molecular level is crucial for accurate diagnosis, treatment and prognosis, and identifying possible gene therapeutic targets requires deciphering the genetic patterns underlying the etiology of the disease. AML clonal expansion results from abnormal genetic and epigenetic changes in hematopoietic stem and progenitor cells that cause changes or impairment of important physiological processes, such as self-renewal, proliferation, and differentiation [Citation4,Citation5]. Consequently, AML results in the insufficient generation of normal mature blood cells. In addition, AML is associated with multiple chromosomal translocations and mutations that are responsible for the disease pathology and influence disease prognosis. Three gene mutations are proven to be prognostically significant in AML namely, NPM1, CEBPA, and FLT3-ITD [Citation6]. Mutations in FLT3 are associated with a higher rate of relapse and unfavorability [Citation7], while mutations in NPM1 and CEBPA are associated with favorable survival prognoses [Citation8,Citation9].
Of great interest to many research studies are the genome-wide detection of differentially expressed genes (DEGs) from two or more conditions of interest [Citation10]. Currently, one of the main techniques of choice used for gene expression profiling (GEP) is RNA-sequencing (RNA-Seq). GEP can be used to find many systematic differences between cancer and normal conditions thereby defining new clinically relevant disease subtypes [Citation11]. The European LeukemiaNet (ELN-2017) provides guidelines to stratify AML patients into good, intermediate, and adverse risk groups based on cytogenetics and mutation status of some genes, including ASXL1, CEBPA, FLT3, NPM1, RUNX1, and TP53 [Citation12].
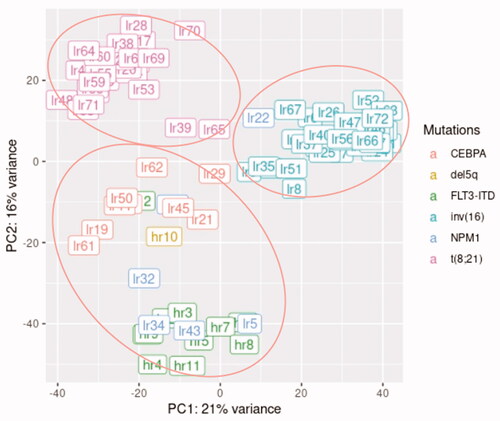
Based on results of a preliminary data analysis of high- and low-risk AML samples from the GDC TARGET AML dataset, the PCA analysis showed that samples with NPM1, CEBPA, and FLT3-ITD mutations were clustered together (), although they have different survival rates. In addition, samples with t(8;21) and inv(16) variations were well separated into two other independent clusters (). In line with these results, a 36-gene expression signature enabled the accurate classification of AML samples with t(8;21) and inv(16) mutations [Citation13]. However, segregation between AML samples with NPM1 and CEBPA using GEP is less accurate, revealing that the expression pattern between the two types of samples is likely similar [Citation14]. Therefore, the fact that FLT3-ITD samples are grouped with NPM1 and CEBPA samples of favorable prognosis raises the question of why the survival of AML patients with FLT3-ITD is low? Thus, it is crucial to look for DEGs between AML FLT3-ITD on the one hand and AML NPM1/CEBPA on the other hand, which are potentially the cause of poor survival in FLT3-ITD samples.
Figure 1. Clustering of the high- and low-risk AML samples based on their cytogenetics and genetic aberrations using principal component analysis (PCA).
This study aims to identify a gene expression signature that can differentiate AML FLT3-ITD mutation from the AML NPM1 and AML CEBPA mutations, which are implicated in poor survival. In addition, we examined the predictive value of this signature in risk classification. These novel gene expression signatures may assist clinicians and pathologists in patient diagnosis and assessment, thereby ensuring more accurate and individualized treatment options.
Materials and methods
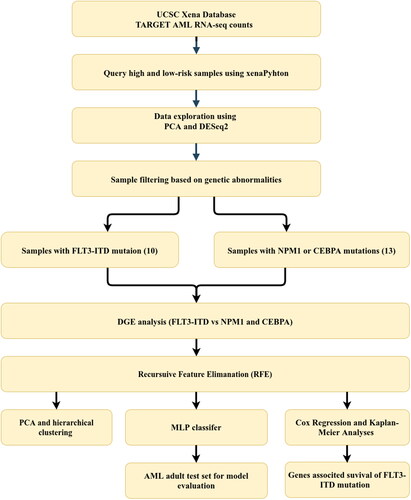
The workflow describing the steps and methods undertaken in this study is illustrated in . It includes six essential steps: dataset retrieval, differential gene expression (DGE), PCA and clustering, machine learning (ML), Cox regression, and Kaplan–Meier’s (K–M) analyses.
Figure 2. Workflow depicting the steps and methods used for the identification of genetic signature associated with poor prognosis in AML samples with FLT3-ITD mutation. AML: acute myeloid leukemia; CEBPA: CCAAT enhancer binding protein alpha; DGE: differential gene expression; FLT3-ITD: FMS-like tyrosine kinase 3-internal tandem duplications; MLP: multi-layer perceptron; NPM1: nucleophosmin-1; PCA: principal component analysis; TARGET: therapeutically applicable research to generate effective treatment.
Datasets
The therapeutically applicable research to generate effective treatment (TARGET) project employed a multi-omic strategy to molecularly characterize hard-to-treat pediatric cancers, including AML. TARGET data are accessible through the TARGET data matrix and the UCSC Xena Browser, a web-based visual integration and exploration tool for multi-omic data. The UCSC Xena Browser is a high-performance visualization, exploration, and analysis tool for multi-omic data of large public repositories and private datasets [Citation15].
The TARGET AML dataset in Xena consists of a total of 187 samples with their accompanying clinical data. XenaPython, a Python package implementing APIs to query and download data from Xena, was used to obtain gene expression in log2 transformed RNA-Seq counts format of the TARGET AML dataset (dataset ID: TARGET-AML.htseq_counts.tsv) from the GDC hub. The criteria used to query the dataset were the risk group (low and high) into which the samples were classified. The data samples were then filtered based on their cytogenetic abnormalities and genetic mutations. AML data samples with FLT3-ITD, NPM1, and CEBPA mutations were used for downstream analysis. Samples with multiple gene mutations were not considered, as multiple mutations may impact AML prognosis [Citation16]. There is no precise risk classification of patients with FLT3-ITD and NPM1 double mutation. The National Comprehensive Cancer Network considers them to have a favorable or intermediate risk, however, an unfavorable prognosis was manifested by this category of patients in recent studies [Citation17]. Similarly, CEBPA-mutated patients with WT1 mutations were reported to have an unfavorable risk [Citation18]. Due to these uncertainties and changes in the risk classification of AML patients with multiple mutations, two samples, one with FLT3-ITD and NPM1 double mutation and the other with both CEBPA and WT1 mutations, were not considered.
Differential gene expression analysis
The gene expression values from the AML samples with FLT3-ITD, NPM1, and CEBPA were converted to raw counts using the mathematical expression R= – 1, where R is the raw count and L is the log2 normalized value. Filtering to remove low expressed genes was done using edgeR’s filterByExpr function [Citation19]. Statistically, eliminating low expressed genes enables the mean–variance association in the data to be measured more accurately and reduces the number of computational checks conducted in downstream differentially expressed tests [Citation10]. The DGE analysis between FLT3-ITD and NPM1/CEBPA samples was performed using the DESeq2 package in R [Citation20]. DESeq2 uses shrinkage estimators for dispersion and fold change for comparative DGE estimation [Citation20]. Genes that met the criteria of an adjusted p value <.01 were considered significant and therefore differentially expressed.
Machine learning
To determine if the DEGs identified could serve as risk classification biomarkers in AML, a multi-layer perceptron (MLP) classifier was constructed using the pediatric DEGs and tested on adult AML samples, as explained below. MLP is a feed-forward artificial neural network (ANN) algorithm. It is implemented in Python under the Scikit-learn library [Citation21] and imported using the MLPClassifer class. Prior to the classification task, a linear support vector machine and repeated stratified 10-fold cross-validation were used for recursive feature elimination (RFE). The RFE was applied to the DEGs to obtain the essential features for optimum model performance. The selected genes were then used as features for classification. Also, principal component analysis (PCA) and clustering analysis were applied to the expression values of these selected genes to assess their ability to discriminate the samples of the two AML groups. The PCA plot and clustering heatmap were generated using the ggplot2 and pheatmap R packages, respectively.
The features of the training set were extracted from the log2-transformed normalized counts of the pediatric AML samples. The test set was constructed from the adult AML dataset (dataset ID: TCGA-LAML.htseq_counts.tsv) obtained from the GDC hub in the UCSC Xena Browser. Construction of the test set followed the same process used to construct the training set, i.e. consider AML samples with FLT3-ITD mutation and AML samples with NPM1/CEBPA mutation. The features (genes) not present in the test dataset were removed from the training set and were not used in the ML classification. In addition, the gene expression values of the training and test sets were scaled using Scikit-learn’s StandardScaler function. The MLP model was then applied to predict the classification of the samples in the test set. The evaluation metric for the model performance was the accuracy of classification.
Cox’s regression analysis and Kaplan–Meier’s estimates
To determine among the genes from ML those that best correlated with patient's survival, we used a Cox regression model based on the Lasso algorithm of the glmnet R package [Citation22–24]. The model assigns each gene a regression coefficient value. Genes with a zero coefficient were eliminated, having no effect on survival. Prognostic genes with positive coefficients suggest that their upregulation signifies low survival in FLT3-ITD patients. For each gene with positive coefficient, a score value is calculated for each patient as a product of the expression value of the gene and its corresponding coefficient obtained from the Cox regression model. A median value was inferred from the patient scores. Each score was then compared to the median, and patients were assigned a status value of 1 or 0 depending on whether the score was above or below the median. According to patient status information, K–M estimates were then calculated for overall survival (OS). K–M curves were generated using the ggsurvplot function from the survminer R package.
Results
Differential gene expression analysis
Querying UCSC Xena Browser for TARGET AML samples using risk group as search criteria returned 12 high-risk samples and 72 low-risk samples. The distribution and clustering of samples by cytogenetic and mutational aberrations are shown in and , respectively. Samples with FLT3-ITD, NPM1, and CEBPA mutations were selected for downstream analysis, comprising of 10 samples of FLT3-ITD mutation and 13 NPM1/CEBPA samples. All were clustered together in the exploratory analysis (). Filtering of the gene expression data eliminated 38,980 low expressed genes and retained 21,503 genes for downstream analysis. The DGE analysis using DESeq2 identified 471 DEGs between the AML FLT3-ITD and AML NPM1/CEBPA groups. Of these, 208 genes were upregulated, while 263 genes were downregulated.
Table 1. Type of mutation, number of samples and risk category of TARGET high- and low-risk samples.
Machine learning
The RFE selected 22 genes out of 471 DEGs as the most critical features for classifying samples according to their mutational status (). These 22 DEGs accurately discriminated and clustered the TARGET samples into their respective mutation groups (). However, some of these selected genes were not found in the adult test dataset and were not included in the pediatric training set used to create the MLP model. Sixteen DEGs (features) were thus used for the ML classification, including FHL1, VWF, MPZL2, SPNS3, LINC00515, TCEA3, DCN, MACC1, ADD2, CCDC152, KCNA6, ADAMTS3, KCTD15, KCNMB4, HESX1, and IL3RA. The training set was constructed based on the gene expression values of the TARGET samples from the FLT3-ITD group with 10 samples and the NPM1/CEBPA group with 13 samples. The test set was 25 samples, including five FLT3-ITD samples and 20 NPM1/CEBPA samples. Evaluation of the MLP classifier on the test set yielded 92% accuracy of samples correctly assigned to their corresponding mutational status. All FLT3-ITD samples were correctly predicted, while 18 of the 20 NPM1 and CEBPA samples were correctly predicted.
Figure 3. Clustering of the AML samples with FLT3-ITD and NPM1/CEBPA mutations using the 22 DEGs selected by RFE using (A) principal component analysis (PCA) and (B) hierarchical clustering using pheatmap R package.
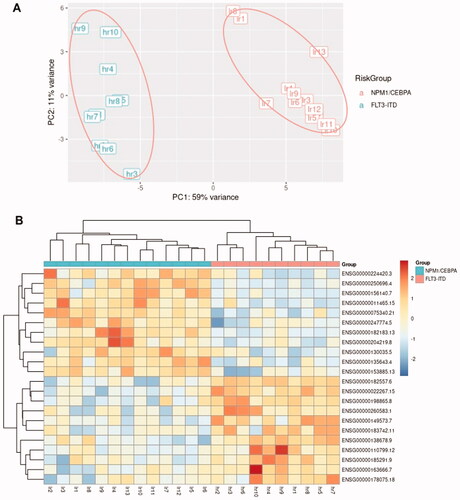
Table 2. List of the 22 DEGs selected by RFE genes with * was used in the ML model.
Cox’s regression analysis and Kaplan–Meier’s estimates
The Cox regression model associated five of the 22 DEGs obtained from RFE with patient survival in the two AML groups. The model created using the LASSO algorithm assigned non-zero, positive or negative, coefficients to the five genes (). The genes with a positive coefficient (FHL1, SPNS3, and MPZL2) had high expression in the FLT3-ITD group with over fivefold increase, while those with a negative coefficient (KCNMB4 and ADD2) had high expression in the NPM1/CEBPA group with over sevenfold increase. Kaplan–Meier’s estimates for OS based on patient statuses of each gene with a positive coefficient were derived and presented in . Expression of the three genes in the FLT3-ITD group correlated with low survival (p<.0001). Patients with a score above the median were predominantly FLT3-ITD, and those below mainly were NPM1/CEBPA.
Figure 4. Kaplan–Meier’s plots of overall survival of patients with FLT3-ITD and NPM1/CEBPA mutations for survival scores above the median (continuous line), corresponding to high expression, and below the median (dotted line), corresponding to low expression, for the genes with positive Cox coefficients (A) FHL1, (B) SPNS3, and (C) MPZL2.
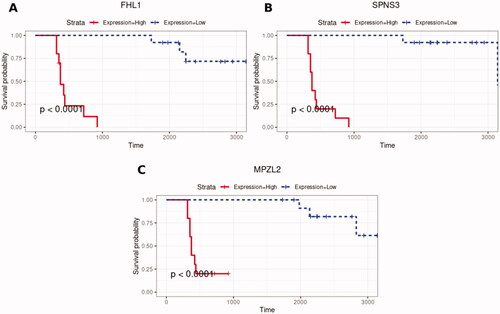
Table 3. The list of the DEGs related to overall survival and their corresponding coefficient values from the Cox regression model.
Discussion
Proper risk stratification of AML patients at diagnosis is essential for making optimal therapeutic decisions. The results of the DGE analysis demonstrated that the gene expression profile of FLT3-ITD AML is different from that of the other mutation groups mentioned above. FLT3-ITD mutation is associated with unfavorable AML disease outcome [Citation7]. Similar prognostic driver genes have been cataloged in several cancers. For example, in neuroblastoma, another pediatric cancer, MYCN amplification is a predictor of poor prognosis [Citation25]. Some of the DEGs identified here have been associated with AML and several other cancers [Citation26–28]. The downstream analysis identified DEGs associated with survival () and possible responsibility for the poor survival in AML FLT3-ITD as opposed to AML NPM1/CEBPA, which clustered together in the exploratory analysis ().
DEGs in the expression signature
Some of the genes in the identified signature have been reported to have tumor-suppressive roles and downregulated in several cancers. TCEA3, a gene with apoptosis-promoting functions [Citation29], was downregulated in the FLT3-ITD group in our study. It has been reported downregulated as well in rhabdomyosarcoma [Citation30], gastric cancer [Citation31], and ovarian cancer [Citation32]. DCN, another downregulated gene in the FLT3-ITD group, is well known for its oncosuppressive function [Citation33]. DCN expression is decreased in different cancer types [Citation34–36]. In contrast, some upregulated genes have tumor-promoting roles. VWF, upregulated in the FLT3-ITD group, is a glycoprotein involved in hemostasis whose expression has been associated with lymph node metastasis in prostate cancer patients [Citation37]. It was also demonstrated to be related to metastatic activities in glioma and osteosarcoma cells [Citation38].
MACC1 regulates the HGF-MET pathway, which is involved in cellular activities like growth, motility, angiogenesis, invasiveness, epithelial–mesenchymal transition, and metastasis [Citation39,Citation40]. As expected, its high expression has therefore been reported in some cancers such as retinoblastoma [Citation41], gastric cancer [Citation42], and colon cancer [Citation28]. MACC1 is an independent prognostic indicator for metastasis in colon cancer [Citation28]. LINC00515 has also been reported upregulated in glioma [Citation43] and multiple myeloma [Citation44]. IL3RA expression was also correlated with FLT3-ITD-mutated AML, although it is also expressed in some NPM1-mutated AML cases [Citation45]. High expression of IL3RA also seemed to be associated with worse clinical outcomes in AML [Citation46]. Arai et al. [Citation47] reported IL3RA expression associated with chemotherapy response failure and poor survival in de novo AML patients. It, therefore, suggests that FLT3-ITD mutation causes the downregulation of protective tumor-suppressing genes while upregulating genes with oncogenic function.
Machine learning
The high classification accuracy of 92% obtained indicates that the 16-gene expression signature can be used as prognostic markers of FLT3-ITD mutation and unfavorable disease outcome in AML and could be potential therapeutic targets. This high accuracy was achieved despite using an adult AML dataset as the testing set. Differences in molecular mechanisms between pediatric and adult AML have been reported [Citation3,Citation48,Citation49]. Our classification results suggest that pediatric and adult AML have likely similar disease mechanisms for the mutations investigated in our study. Different gene expression signatures for prognosis in AML have been proposed before. Using expression microarray, Bullinger et al. [Citation50] found a 20-gene expression signature predictive of FLT3-ITD mutation status using prediction analysis of microarray method [Citation51] and Kaplan–Meier’s analysis. They obtained a prediction accuracy of 81% for identifying cases with FLT3-ITD mutation. Our study used an RNA-Seq dataset for analysis, performed DGE analysis, and applied machine-learning methods to find and validate a 16-gene expression signature predictive of FLT3-ITD mutation with 92% higher accuracy achieved. RNA-Seq has become the primary technology used for GEP [Citation10]. Our expression signature of a lesser number of genes should be implementable and potentially cost-effective.
Similarly, Zhu et al. [Citation52] found a six immune-related gene signature to predict prognosis in AML using Cox and LASSO regression analysis. However, their classifier is based on immune-related genes, and the genes identified may not provide a larger picture of the mechanisms at play in the disease pathogenesis. As a limitation, the sample size of our test dataset was small. Therefore, validation in much larger sample cohorts may still be essential. However, we expect that further studies of the genes identified in our study will shed light on the underlying pathogenesis of AML with FLT3-ITD mutation.
Cox’s regression analysis and Kaplan–Meier’s estimates
By reducing the list of genes obtained from the ML analysis, the Cox regression model selected five genes related to patient OS including three genes with positive Cox coefficients. The K–M curves () show the ability of these three genes to distinguish between shorter and longer OS, i.e. FLT3-ITD and NPM1/CEBPA groups, respectively (p<.0001). The results of the survival analysis () validated the poor prognosis in the FLT3-ITD group. Since a patient score above the median is associated with low OS, higher expression of FHL1, SPNS3, and MPZL2 with positive Cox coefficients is a prognostic indicator of poor outcome in AML with FLT3-ITD mutation. The roles of the genes with negative Cox coefficients, ADD2 and KCNMB4, in the survival of AML patients with NPM1/CEBPA require further investigation.
FHL1 belongs to a family of genes that play a role in focal adhesion and differentiation. High expression of FHL1 has been described as a powerful prognostic indicator of worse survival and poor outcome, independent of existing genetic factors for the prognosis of AML. Its overexpression was further found to be related to chemotherapy-resistance and relapse in AML, and FHL1 knockdown enhanced the sensitivity of AML cells response to treatment [Citation53]. SPNS3 is a transmembrane transporter whose overexpression has been associated with poor prognosis in AML patients receiving chemotherapy or allogeneic hematopoietic stem cell transplantation [Citation54]. Huang et al. [Citation54] suggested that over-expression of SPNS3 may regulate and control proliferation and differentiation of AML by autophagy. MPZL2 expressed in the lymphoid organ, thymus, and other epithelial structures maintains stemness in glioblastoma [Citation55]. Its increased expression has been reported in AML and hepatocellular carcinoma, which is associated with poor prognosis and recurrence [Citation56,Citation57].
Notably, the high expression of these genes in FLT3-ITD patients promotes poor outcomes, and the implication of FHL1 and SPNS3 in chemotherapy resistance could be the reason for treatment failure, which may therefore explain the low survival in this category of patients. Functional studies such as knockdown experiments to decipher the precise roles of these genes in FLT3-ITD AML would be illuminative.
Conclusions
In this study, we differentiated AML FLT3-ITD and AML NPM1/CEBPA using GEP. We also identified and validated a 16-gene expression signature for risk classification in AML, which has diagnostic and prognostic value. The upregulation of FHL1, SPNS3, and MPZL2 was found to be associated with poor survival in AML FLT3-ITD. These genes could therefore be potential therapeutic targets in pediatric and adult AML.
Disclosure statement
Authors have no conflict of interest to declare.
Additional information
Funding
References
- de Rooij JD, Michel Zwaan C, van den Heuvel-Eibrink M, et al. Pediatric AML: from biology to clinical management. J Clin Med. 2015;4:127–149.
- Szalontay L, Shad AT. Pediatric acute myeloid leukemia: how to improve outcome? Curr Pediatr Rep. 2014;2(1):26–37.
- Chaudhury S, O’Connor C, Cañete A, et al. Age-specific biological and molecular profiling distinguishes paediatric from adult acute myeloid leukaemias. Nat Commun. 2018;9(1):14.
- Saultz J, Garzon R. Acute myeloid leukemia: a concise review. J Clin Med. 2016;5(3):33.
- Siveen KS, Uddin S, Mohammad RM. Targeting acute myeloid leukemia stem cell signaling by natural products. Mol Cancer. 2017;16(1):12.
- Torrebadell M, Díaz-Beyá M, Kalko SG, et al. A 4-gene expression prognostic signature might guide post-remission therapy in patients with intermediate-risk cytogenetic acute myeloid leukemia. Leuk Lymphoma. 2018;59(10):2394–2404.
- Meshinchi S, Alonzo TA, Stirewalt DL, et al. Clinical implications of FLT3 mutations in pediatric AML. Blood. 2006;108(12):3654–3661.
- Fröhling S, Schlenk RF, Stolze I, et al. CEBPA mutations in younger adults with acute myeloid leukemia and normal cytogenetics: prognostic relevance and analysis of cooperating mutations. J Clin Oncol. 2004;22(4):624–633.
- Hollink I, Zwaan CM, Zimmermann M, et al. Favorable prognostic impact of NPM1 gene mutations in childhood acute myeloid leukemia, with emphasis on cytogenetically normal AML. Leukemia. 2009;23(2):262–270.
- Law CW, Alhamdoosh M, Su S, et al. RNA-seq analysis is easy as 1-2-3 with limma, glimma and edgeR. F1000Res. 2016;5:1408.
- Gerstung M, Pellagatti A, Malcovati L, et al. Combining gene mutation with gene expression data improves outcome prediction in myelodysplastic syndromes. Nat Commun. 2015;6(1):11.
- Döhner H, Estey E, Grimwade D, et al. Diagnosis and management of AML in adults: 2017 ELN recommendations from an international expert panel. Blood. 2017;129(4):424–447.
- Handschuh L, Lonetti A. Not only mutations matter: molecular picture of acute myeloid leukemia emerging from transcriptome studies. J Oncol. 2019;2019:1–36.
- Verhaak RGW, Wouters BJ, Erpelinck CAJ, et al. Prediction of molecular subtypes in acute myeloid leukemia based on gene expression profiling. Haematologica. 2009;94(1):131–134.
- Goldman M, Craft B, Hastie M, et al. The UCSC Xena platform for public and private cancer genomics data visualization and interpretation. bioRxiv. 2018;326470.
- Stölzel F, Mohr B, Kramer M, et al. Karyotype complexity and prognosis in acute myeloid leukemia. Blood Cancer J. 2016;6:386.
- Huang Y, Hu J, Lu T, et al. Acute myeloid leukemia patient with FLT3-ITD and NPM1 double mutation should undergo allogeneic hematopoietic stem cell transplantation in CR1 for better prognosis. Cancer Manag Res. 2019;11:4129–4142.
- Wang T, Wang Z, Wang B. Frequency and clinical impact of WT1 mutations in the context of CEBPA-mutated acute myeloid leukemia; 2021.
- Robinson MD, McCarthy DJ, Smyth GK. edgeR: a bioconductor package for differential expression analysis of digital gene expression data. Bioinformatics. 2010;26(1):139–140.
- Love MI, Huber W, Anders S. Moderated estimation of fold change and dispersion for RNA-seq data with DESeq2. Genome Biol. 2014;15(12):550.
- Pedregosa F, Michel V, Grisel O, et al. Scikit-learn: machine learning in python. J Mach Learn Res. 2011;12:2825–2830.
- Friedman J, Hastie T, Tibshirani R. Regularization paths for generalized linear models via coordinate descent. J Stat Softw. 2010;33(1):1–22.
- Simon N, Friedman J, Hastie T, et al. Regularization paths for Cox’s proportional hazards model via coordinate descent. J Stat Softw. 2011;39(5):1–13.
- Tibshirani R, Bien J, Friedman J, et al. Strong rules for discarding predictors in lasso-type problems. J R Stat Soc Series B Stat Methodol. 2012;74(2):245–266.
- Seeger RC, Brodeur GM, Sather H, et al. Association of multiple copies of the N-myc oncogene with rapid progression of neuroblastomas. N Engl J Med. 1985;313(18):1111–1116.
- Lee KY, Shueng PW, Chou CM, et al. Elevation of CD109 promotes metastasis and drug resistance in lung cancer via activation of EGFR-AKT-mTOR signaling. Cancer Sci. 2020;111(5):1652–1662.
- Zhou J, Bi C, Chng W-J, et al. PRL-3, a metastasis associated tyrosine phosphatase, is involved in FLT3-ITD signaling and implicated in anti-AML therapy. PLOS One. 2011;6(5):e19798.
- Stein U, Walther W, Arlt F, et al. MACC1, a newly identified key regulator of HGF-MET signaling, predicts colon cancer metastasis. Nat Med. 2009;15(1):59–67.
- Liao JM, Cao B, Deng J, et al. TFIIS.h, a new target of p53, regulates transcription efficiency of pro-apoptotic bax gene. Sci Rep. 2016;6:23542.
- Kazim N, Adhikari A, Oh TJ, et al. The transcription elongation factor TCEA3 induces apoptosis in rhabdomyosarcoma. Cell Death Dis. 2020;11(1):11.
- Li J, Jin Y, Pan S, et al. TCEA3 attenuates gastric cancer growth by apoptosis induction. Med Sci Monit. 2015;21:3241–3246.
- Cha Y, Kim DK, Hyun J, et al. TCEA3 binds to TGF-beta receptor I and induces smad-independent, JNK-dependent apoptosis in ovarian cancer cells. Cell Signal. 2013;25(5):1245–1251.
- Baghy K, Reszegi A, Tátrai P, et al. Decorin in the tumor microenvironment. Adv Exp Med Biol. 2020;1272:17–38.
- Bozoky B, Savchenko A, Guven H, et al. Decreased decorin expression in the tumor microenvironment. Cancer Med. 2014;3(3):485–491.
- Shi X, Liang W, Yang W, et al. Decorin is responsible for progression of non-small-cell lung cancer by promoting cell proliferation and metastasis. Tumour Biol. 2015;36(5):3345–3354.
- Neill T, Schaefer L, Iozzo RV. Decorin as a multivalent therapeutic agent against cancer. Adv Drug Deliv Rev. 2016;97:174–185.
- Kong QF, Lv B, Wang B, et al. Association of von Willebrand factor (vWF) expression with lymph node metastasis and hemodynamics in papillary thyroid carcinoma. Eur Rev Med Pharmacol Sci. 2020;24(5):2564–2571.
- Mojiri A, Stoletov K, Carrillo MAL, et al. Functional assessment of von Willebrand factor expression by cancer cells of non-endothelial origin. Oncotarget. 2017;8(8):13015–13029.
- Birchmeier C, Birchmeier W, Gherardi E, et al. Met, metastasis, motility and more. Nat Rev Mol Cell Biol. 2003;4(12):915–925.
- Mazzone M, Comoglio PM. The met pathway: master switch and drug target in cancer progression. FASEB J. 2006;20(10):1611–1621.
- Nair RM, Prabhu V, Manukonda R, et al. Overexpression of metastasis-associated in colon cancer 1 in retinoblastoma. Tumor Biol. 2020;42.
- Tong G, Cheng B, Li J, et al. MACC1 regulates PDL1 expression and tumor immunity through the c-Met/AKT/mTOR pathway in gastric cancer cells. Cancer Med. 2019;8(16):7044–7054.
- Wu Z, Lin Y. Long noncoding RNA LINC00515 promotes cell proliferation and inhibits apoptosis by sponging miR-16 and activating PRMT5 expression in human glioma. Onco Targets Ther. 2019;12:2595–2604.
- Lu D, Yang C, Zhang Z, et al. Knockdown of Linc00515 inhibits multiple myeloma autophagy and chemoresistance by upregulating miR-140-5p and downregulating ATG14. Cell Physiol Biochem. 2018;48(6):2517–2527.
- Rollins-Raval M, Pillai R, Warita K, et al. CD123 immunohistochemical expression in acute myeloid leukemia is associated with underlying FLT3-ITD and NPM1 mutations. Appl Immunohistochem Mol Morphol. 2013;21(3):212–217.
- Jiang G, Atenafu EG, Capo-Chichi JM, et al. Prognostic relevance of CD123 expression in adult AML with normal karyotype. Br J Haematol. 2020;188(1):181–184.
- Arai N, Homma M, Abe M, et al. Impact of CD123 expression, analyzed by immunohistochemistry, on clinical outcomes in patients with acute myeloid leukemia. Int J Hematol. 2019;109(5):539–544.
- Jeha S, Smith FO, Estey E, et al. Comparison between pediatric acute myeloid leukemia (AML) and adult AML in VEGF and KDR (VEGF-R2) protein levels. Leuk Res. 2002;26(4):399–402.
- Bolouri H, Farrar JE, Triche T, et al. The molecular landscape of pediatric acute myeloid leukemia reveals recurrent structural alterations and age-specific mutational interactions. Nat Med. 2018;24(1):103–112.
- Bullinger L, Döhner K, Kranz R, et al. An FLT3 gene-expression signature predicts clinical outcome in normal karyotype AML. Blood. 2008;111(9):4490–4495.
- Tibshirani R, Hastie T, Narasimhan B, et al. Diagnosis of multiple cancer types by shrunken centroids of gene expression. Proc Natl Acad Sci U S A. 2002;99(10):6567–6572.
- Zhu R, Tao H, Lin W, et al. Identification of an immune-related gene signature based on immunogenomic landscape analysis to predict the prognosis of adult acute myeloid leukemia patients. Front Oncol. 2020;10:1.
- Fu Y, Xu M, Cui Z, et al. Genome-wide identification of FHL1 as a powerful prognostic candidate and potential therapeutic target in acute myeloid leukaemia. EBioMedicine. 2020;52:102664.
- Huang W, Qian T, Cheng Z, et al. Prognostic significance of spinster homolog gene family in acute myeloid leukemia. J Cancer. 2020;11(15):4581–4588.
- Ohtsu N, Nakatani Y, Yamashita D, et al. Eva1 maintains the stem-like character of glioblastoma-initiating cells by activating the noncanonical NF-κB signaling pathway. Cancer Res. 2016;76(1):171–181.
- Yu P, Lan H, Song X, et al. High expression of the SH3TC2-DT/SH3TC2 gene pair associated with FLT3 mutation and poor survival in acute myeloid leukemia: an integrated TCGA analysis. Front Oncol. 2020;10:1–15.
- Ni QZ, Chen Z, Zheng Q, et al. Epithelial V-like antigen 1 promotes hepatocellular carcinoma growth and metastasis via the ERBB-PI3K-AKT pathway. Cancer Sci. 2020;111(5):1500–1513.