
Abstract
The 3' regulatory region (3'RR) located downstream from the Cα gene is the conductor of transcription, accessibility, and remodeling of the IgH locus at mature B-cell stages. Convincing demonstrations of the essential contributions of the 3'RR in B-cell lymphomagenesis have been provided by mouse models which bring the oncogene c-Myc under the 3'RR transcriptional control. In this study, we developed a mouse model of CD138+ plasma B-cell lymphomas. If the KI of c-myc directly into Cα just 5' to the 3'RR in iMycCα mice produced B-cell lymphomas with low kinetics, we enforced c-myc production in iMycCα mice by the generation of homozygous c-myc transgenic mice. Our results show that homozygous iMycCα mice lead to a mouse model of plasma CD138+ B-cell lymphomas with interesting and wide transcriptomic similarities to human multiple myeloma and appropriated emergence kinetics that can be used to test new experimental therapeutic approaches.
Introduction
AID-induced DNA breaks and mutations throughout B-cell development make the IgH locus a hotspot for translocations [Citation1]. Several translocations (such as Myc and cyclin D1/D3) found in myelomas are related to AID-induced class-switch recombination (CSR). During CSR, AID-induced DNA double-strand breaks (DSBs) appear in the IgH switch (S) donor region (usually 5′ Sµ close to the constant Cµ gene) and in the S acceptor region (for example 5′ Sα close to Cα for CSR toward IgA). Translocation of the DNA fragment encompassing the oncogene (such as c-myc) is due to an off target AID effect on the chromosome bearing c-myc. After translocating into the IgH locus, the oncogene falls under the transcriptional control of the cis-acting regulatory element acting at the mature B-cell stage, the 3′ regulatory region (3′RR) located downstream from Cα. The 3′RR controls µ transcription in mature B-cells [Citation2], and is the master control element of conventional CSR [Citation3], locus suicide recombination [Citation4], and somatic hypermutation (SHM) [Citation5] but with no evident role on VDJ recombination [Citation6].
Various transgenic mouse models with IgH-c-myc translocations at various places throughout the IgH locus were of interest for the better understanding of the role of IgH cis-transcriptional enhancers (and their cooperation) during B-cell lymphomagenesis [Citation7–11]. The vast majority of generated B-cell lymphomas were IgM+IgD+ confirming their mature B-cell status with a few of them being CD138+, thereby highlighting their plasma-like B-cell status. Plasma cell neoplasms in human are composed of several mature B-cell subset diseases including multiple myeloma often with c-myc translocation and deregulation [Citation12]. Several mouse models have been developed as experimental approaches to human B-cell neoplasms. One of them used transgenic mice with the c-myc gene inserted into the IgH Cα locus (iMycCα mice) in association with a Bcl-XL transgene [Citation9]. The knock-in (KI) of c-myc directly into Cα just 5′ to the 3′RR in iMycCα mice produced B-cell lymphomas with low kinetics which were increased after overexpression of the anti-apoptotic Bcl-XL gene. Interestingly iMycCα mice exhibited elevated levels of bone marrow B220+CD138+ plasmablasts compared with wt counterparts. In this study, in an effort to develop a c-myc-induced plasma cell B-cell lymphoma model (without affecting as a primum movens apoptotic B-cell pathways) we forced c-myc production in iMycCα mice by the generation of homozygous c-myc transgenic mice. Our results show that homozygous iMycCα mice lead to a mouse model of plasma B-cell lymphomas with interesting transcriptomic similarities with human myeloma and appropriated emergence kinetics that can be used to test new experimental therapeutic approaches.
Materials and methods
Transgenic mice
Mice housing and procedures were conducted in agreement with European Directive 2010/63/EU on animals used for scientific purposes applied in France as the ‘Décret n°2012-118 du 1er février 2013 relatif à la protection des animaux utilisés à des fins scientifiques.’ Accordingly, the present project (APAFiS ≠ 13855) was authorized by the ‘Ministère de l'Education Nationale, de l'Enseignement Supérieur et de la Recherche’ and reviewed by ethics committee of the University of Limoges (France). Thus, all methods in this study were carried out in accordance with relevant guidelines and regulations and all experimental protocols were approved by French institutions. iMycCα mice (in a C57BL6 background) have a c-myc KI within a Cα intron [Citation9]. Heterozygous c-myc transgenic mice were crossed to generate homozygous iMycCα. Homozygous iMycCα mice were detected with the following forward (P1: 5′TGCGAGAAATCCCACCATCT3′) and reverse (P2: 5′GATGCCATCTCCCTCTGACA3′) primers. The inserted c-myc was amplified with the following forward (P3: 5′TTGGAAACCCCGCAGACA3′) and reverse (P4: 5′CTTCTTGCTCTTCTTCAGAGTCGC3′) primers. Wt C57BL6 mice were used as controls.
B-cell purification
For studies evaluating proliferation and Myc protein, spleen B-cells were recovered with the EasySep™ mouse B-cell Isolation Kit (STEMCELL Technologies, France) designed to isolate B-cells from single-cell suspensions by negative selection. For transcriptomic studies of B-cell lymphomas, cells were purified using B220-coupled beads from Miltenyi Biotec (Bergisch Gladbach, Germany) according to the manufacturer’s recommendations.
Proliferation analysis
Splenic B-cells (1 × 10⁵ cells/well) were cultured (in sixplicates) in 96-well plates using RPMI 1640 supplemented with 10% fetal calf serum (FCS), glutamine, non-essential amino acids, and antibiotics either alone or in the presence of various concentrations of LPS and/or anti-CD40 for 72 h. The number of viable cells was assessed using the CellTiter 96® One Solution Cell Proliferation assay (Promega Corporation, Madison, WI) according to the manufacturer’s recommendations.
CSR and Ig secretion experiments
Single-cell suspensions of spleen B-cells (8–12-week old mice, males, and females) were cultured 4 d at 1 × 10⁶ cells/ml in RPMI 1640 with 10% FCS, 5 µg/ml LPS with or without 20 ng/ml IL4 (PeproTech, Rocky Hill, NJ) and with or without 5 ng/ml TGFβ. CSR was evaluated by incubating cultured spleen B-cells with anti-B220-BV510-, anti-IgG1-PE-, anti-IgG3-PE-, anti-IgA-PE-, and anti-CD138-APC-labeled antibodies and analyzed on a Fortessa LSR2 (Beckton–Dickinson, Franklin Lakes, NJ). At day 3, 1 × 10⁶ cells were cultured for 24 h in growth medium without LPS + cytokine. Supernatants were recovered and stored at −20 °C until used for Ig quantification (ELISA assays specific for IgG1, IgG3, and IgA) [Citation3,Citation13].
Flow cytometry analysis
Single cell suspensions of B-cell lymphomas were labeled with various antibodies to ensure their B-cell status (B220-BV510/CD4-PE/CD8-PC5/CD11b-FITC or B220-BV510/CD5-FITC) and degree of maturity (B220-BV510/CD19-PE/IgM-FITC/IgD-PE, B220-BV510/CD43-PE/CD138-APC/CD117-BV421, or B220-BV510/CD5-FITC). Single cell suspensions of bone marrow cells were labeled with antibodies to ensure their pre-pro B-cell status (B220+CD43+CD117+CD19+CD24-CD25-), their large pre B-cell status (B220+CD43 ± CD117-CD19+CD24highCD25±) or immature B-cell status (B220+CD43+CD117-CD19+CD24highCD25-IgM+). Single cell suspensions of spleen B-cells were labeled with antibodies to ensure their mature B-cell status (B220+CD19+IgM+IgD+), B1 B-cell status (B220+CD19+IgMhighIgDlowCD21-CD23-), plasma B-cell status (B220+IgM+IgD+CD138+), follicular (FO) B-cell status (B220+IgM+IgDhighCD21highCD23high), or marginal zone (MZ) B-cell status (B220+IgMhighIgDlowCD21highCD23low).
RNAseq experiments
B220+IgM+IgD+CD138+ and B220+IgM+IgD+CD138− B-cell lymphomas were investigated. Total RNA from lymphoma cells (purified with B220-coupled beads from Miltenyi Biotech, Bergisch Gladbach, Germany) was extracted and analyzed by microarray (Génome et Transcriptome, GenoToul, Toulouse, France; get.genotoul.fr). RNA-seq paired-end libraries were prepared according to the Illumina protocol with some adjustments, using the TruSeq Stranded Total RNA Gold library prep Kit (Illumina, San Diego, CA). Libraries were quantified by qPCR using the KAPA Library Quantification Kit (Roche, Basel, Switzerland). Libraries’ quality was assessed by the HS NGS kit on the Fragment Analyzer (Agilent Technologies, Santa Clara, CA). Libraries were equimolarly pooled and RNA sequencing was then performed on one S4 lane of the Illumina NovaSeq 6000 instrument (Illumina, San Diego, CA), using the NovaSeq 6000 S4 version 1.5 Reagent Kit (300 cycles), and a paired-end 2 × 150 pb strategy. Quality controls were done on raw FastQ files with FastQC (version: 0.11.9, default parameters) and fastq-screen (version: 0.14.0, default parameters) [Citation14,Citation15]. Trimming was done with fastp (version: 0.20.1) [Citation16]. Quality reports were gathered with MultiQC (version: 1.9, default parameters) [Citation17]. Abundance estimation was performed with Salmon (version: 1.5.2, parameters: –numBootstraps 100 –threads 8 –gcBias –validateMappings –seqBias –posBias –libType A)on the mouse genome (mm10) [Citation18]. The differential gene expression analysis was done with DESeq2 for the three comparisons [Citation2]. The gene expression heatmap was created from the differentially expressed gene list with pandas and bioinfokit in python. For all R calculations (R version 3.6.1), the packages clusterProfiler (version: 3.14.0), enrichplot (version: 1.6.0), org.Mm.eg.db (version: 3.10.0), org.Hs.eg.db (version: 3.10.0), and DOSE (version: 3.12.0) were used. RNAseq data were deposited with the accession number GSE190347. An enriched Gene Ontology (GO) term plot was constructed for the differentially expressed mouse genes. Gene set analysis was produced after a conversion of mouse gene IDs to human gene IDs.
Western blot experiments
Cells were lysed in RIPA buffer (Santa Cruz Biotechnology, Dallas, TX) according to manufacturer’s instructions. Lysates were assayed with the bicinchoninic acid kit (Pierce) and 30 μg total proteins were loaded on a 12% polyacrylamide gel (Bio-Rad, Hercules, CA) under reducing conditions. Proteins were transferred onto polyvinylidene difluoride (PVDF) membranes (Bio-rad). After blocking, membranes were incubated with rabbit anti-Myc (Cell Signalingog technology) and rabbit anti-actin antibodies (Sigma-Aldrich, St. Louis, MO), and revealed with horseradish peroxidase (HRP) labeled goat anti-rabbit IgG (Southern-Biotech, Birmingham, AL) by chemiluminescence (Immobilon® Forte Western HRP substrate, Millipore, Billerica, MA) on the ChemiDoc™ Touch imaging system (Bio-Rad). Results were analyzed with Image Lab™ software (Bio-Rad). Data were analyzed using Prism software (GraphPad Software, La Jolla, CA).
Results and discussion
Analysis of young homozygous iMycCα mice
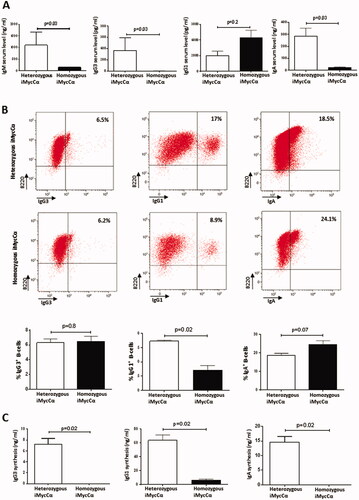
The location of c-myc in Cα (thus in the C region of the IgH locus, ) did not preclude the generation of functional B-cells in iMycCα mice. Specific PCR screened heterozygous/homozygous iMycCα mice (). We first analyzed Myc protein expression in 6-8 weeks-old heterozygous and homozygous iMycCα mice. Myc protein was elevated in homozygous iMycCα mice (). This elevation was due to the fact that 100% of B-cells in homozygous iMycCα mice used an IgH allele bearing a targeted IgH locus when statistically only 50% used it in heterozygous iMycCα mice. As consequence, in vitro proliferation of B-cell splenocytes in response to various concentrations of LPS + anti-CD40 was higher in homozygous compared to heterozygous iMycCα mice (). B-cell development was not affected at immature B-cell stages (pre-pro-B-cells, large pre-B-cells, and immature B-cells) in homozygous iMycCα mice. In contrast, they exhibited reduced levels of mature B220+ B-cells affecting both FO and MZ B-cell subsets (). This effect was obviously related to the 3′RR kinetics of action/activation. Insertion of c-myc in Cα 5′ to the 3′RR affects its function and mimics, in homozygous iMycCα mice, the observed effect of 3′RR deletion (no effect at immature B-cell stages and an effect on mature B-cell development with reduced production of the µ chain and thus B-cell receptor signaling) [Citation2]. As expected the percentage of B220+CD138+ B-cells was significantly elevated in bone marrows and spleens from homozygous iMycCα compared to heterozygous mice (). To explain this observation, we investigated Ig production in homozygous iMycCα mice. Despite elevated CD138+ B-cells, circulating IgM, IgG3, and IgA (but not IgG1) levels were lower in homozygous iMycCα mice compared to heterozygous mice (). If B-cells from homozygous iMycCα mice efficiently underwent CSR toward γ3 (LPS stimulation), γ1 (LPS + IL4 stimulation) (although slightly reduced), and α (LPS + TGFβ stimulation) (), they failed to produce significant levels of IgG3, IgG1, and IgA in vitro (). A functional 3′RR is required for both CSR and Ig synthesis. The insulator effect of the inserted c-myc (previously observed for mature B-cell development) explains the low Ig production of switched isotypes observed both in vitro and in vivo in homozygous iMycCα mice. In contrast, inserted c-myc did not affect involvement of the 3′RR in the CSR mechanism (known to act via long range loop interactions and AID targeting on S regions). This divergent effect for CSR and Ig synthesis was previously reported for B1 B-cell IgA CSR of 3′RR-deficient mice [Citation19]. Similarly to that observed in 3′RR-deficient mice [Citation13], the γ1 isotype was less affected than γ3 and α isotypes in homozygous iMycCα mice () reinforcing the hypothesis of the c-myc-induced insulator effect on 3′RR activity.
Figure 1. B-cell proliferation in iMycCα mice. (A) IgH locus (not to scale) with the location of the inserted Myc. Locations of PCR primers for mice screening are indicated. (B) Screening of heterozygous and homozygous iMycCα mice. One representative experiment with two wt mice, two heterozygous, and two homozygous iMycCα mice. Left panel: detection of the inserted Myc (the forward P3 and reverse P4 primers hybridize to the KI Myc cDNA; PCR band of ≃1500 bp). Right panel: detection of heterozygous and homozygous iMycCα mice (the forward P1 and reverse P2 primers are in Cα). PCR bands of ≃2000 bp and ≃5000 bp for wt and KI alleles, respectively. (C) Western blot analysis of c-myc in B-cell splenocytes from four heterozygous and five homozygous iMycCα mice. β-actin was used as a control gene. Data, expressed as means ± SEM, were analyzed using Prism software (GraphPad Software). Significance was determined with the Mann–Whitney U-test. (D) Proliferation of spleen B-cells from heterozygous and homozygous iMycCα mice in response to various concentrations of LPS + anti-CD40. Results are reported as mean ± SEM of 5 mice per genotype. Significance determined with the Mann–Whitney U-test.
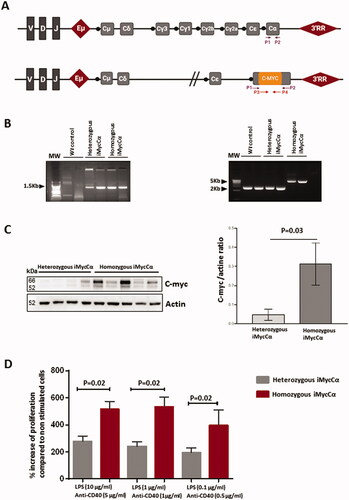
Figure 2. B-cell development in iMycCα mice. (A) Percentage of immature and mature B-cell subtypes (flow cytometry analysis) in heterozygous and homozygous iMycCα mice. Pre-pro-B-cells (B220+CD19+CD43+CD117+ CD24-CD25−), large pre-B-cells (B220+CD19+ CD43 +−CD117-CD24+CD25+−), and immature B-cells (B220+CD19+CD117-CD24+CD25-IgM+IgD−) were investigated in femoral bone marrow. B220+ B-cells, FO B-cells (B220+IgM+IgDhighCD21highCD23high) and MZ B-cells (B220+IgMhighIgDlowCD21highCD23low) were studied in the spleen. Results are reported as mean ± SEM of 3–6 mice. Significance determined with the Mann–Whitney U-test. (B) Percentage of CD138+ B-cells in spleen and bone marrow from heterozygous and homozygous iMycCα mice. Right panel: One representative experiment is shown (B220 and CD138 labeling). Left panel: Results are reported as mean ± SEM of 5 mice. Significance determined with the Mann–Whitney U-test.
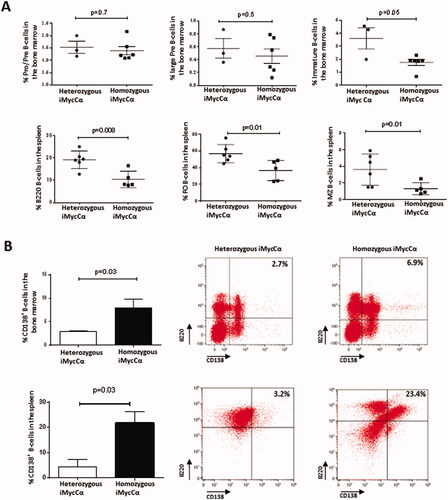
Figure 3. CSR and Ig synthesis in homozygous iMycCα mice. (A) Serum IgM, IgG1, IgG3, and IgA in heterozygous and homozygous iMycCα mice. Ig levels were assessed by specific ELISA. Results are reported as mean ± SEM of 5 mice. Significance was determined with the Mann–Whitney U-test. (B) CSR in B-cells from heterozygous and homozygous iMycCα mice. On representative flow cytometry analysis for IgG1, IgG3, and IgA CSR. Results are reported as mean ± SEM of 5 mice. Significance was determined with the Mann–Whitney U-test. C: In vitro Ig secretion by spleen B-cells from heterozygous and homozygous iMycCα mice. Results are reported as mean ± SEM of 5 mice. Significance was determined with the Mann–Whitney U-test. Same cells as in B.
B-cell lymphomas in homozygous iMycCα mice
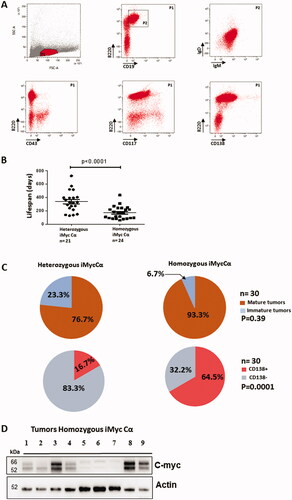
Mice exhibiting obvious tumors or presenting signs of illness were sacrificed. reports typical flow cytometry analysis (B220, CD19, CD43, CD117, CD138, IgM, and IgD) for lymphoma phenotyping. All lymphomas obviously have a B-cell phenotype assessed by the presence of either B220 or CD19 B-cell surface antigens and the absence of CD4/CD8 T-cell antigens and CD11b monocyte antigen (data not shown). As previously reported [Citation9,Citation10], heterozygous transgenic mice infrequently developed lymphomas and those that did develop arose late in life. In contrast, homozygous iMycCα mice quickly developed B-cell lymphomas (). The mean age of tumor development for homozygous mice was approximately 5 months compared with 12 months in heterozygous mice (p < 0.0001, Mann–Whitney U test). The locations (spleen, mesenteric lymph nodes, inguinal/brachial lymph nodes, and mediastinal lymph nodes) of these B-cell lymphomas were similar in homozygous and heterozygous mice (data not shown). The maturity status (mature IgM+IgD+ vs. immature IgM+IgD-) of B-cell lymphomas was not significantly different between heterozygous and homozygous mice (p = 0.39, Mann–Whitney U test) (). In contrast, the percentage of plasmablastic CD138+ B-cell lymphomas was markedly elevated (p <0.0001, Mann–Whitney U test) in homozygous iMycCα mice (64.5%) compared to heterozygous mice (16.7%) (). Myc is recurrently expressed during B-cell maturation but switches off before plasmatic B-cell stages [Citation20]. Western blot analysis of CD138+ B-cell lymphomas showed two entities with respect to Myc expression (low and high expression) () revealing a heterogeneity between the apparent homogeneity among CD138+ B-cell lymphomas. In conclusion, forcing c-myc expression in homozygous iMycCα mice accelerated B-cell lymphomagenesis. The vast majority (>90%) of lymphomas had a mature B-cell phenotype. Comforting our hypothesis to develop a model of plasma B-cell lymphomas, the majority of them exhibited a CD138+ phenotype, a markedly innovative characteristic compared to the various transgenic and KI c-myc mouse models so far [Citation11].
Figure 4. B-cell lymphomas in homozygous iMycCα mice. (A) Typical flow cytometry analysis of B-cell lymphomas. Cells previously gated on SSC/FSC parameters were labeled with anti-B220/anti-CD43, anti B220/anti-CD117, anti-B220/anti-CD138, anti-B220/antiCD19 antibodies. Cells labeled with anti-IgM/anti-IgD antibodies were previously gated on B220+CD19+ cells. B: Time course generation of B-cell lymphomas in heterozygous and homozygous iMycCα mice. Significance was determined with the Mann–Whitney U-test. (C) B-cell lymphoma maturity from homozygous iMycCα mice. Upper panel: Percentages of mature (IgM+IgD+) and immature (IgM +−IgD-) B-cell lymphomas (30 B-cell lymphomas per group). Lower panel: Percentages of CD138+ B-cell lymphomas among mature B-cell lymphomas (30 mature B-cell lymphomas per group). Significance was determined with the Mann–Whitney U-test. D: Western blot analysis of c-myc in CD138+ B-cell lymphomas from homozygous iMycCα mice. β-actin was used as control gene. We studied c-myc in nine different freshly isolated CD138+ B-cell lymphomas. Each line corresponds to a B-cell lymphoma obtained from one mouse. Two types of different CD138+ B-cell lymphoma were documented: one expressing low levels of c-myc (lines 5, 6, and 7) and one expressing high levels of c-myc (lines 1, 2, 3, 4, 7, and 8).
Transcriptome analysis of B-cell lymphomas from homozygous iMycCα mice
In order to document molecular signatures of homozygous iMycCα B-cell lymphomas, RNA sequencing of CD138+ and CD138− B-cell lymphomas was performed and normalized expression data was obtained for all protein-coding genes. In ), bioinformatic analysis (principal component analysis (PCA), volcano plot, and heat map) defined CD138+ and CD138− B-cell lymphomas as two groups with a different transcriptome signature driving various arrays of the immune responses and expressing different signaling/metabolic pathways (), thus confirming their phenotypic difference previously observed by flow cytometry labeling. In contrast, transcriptome analysis () revealed only 27 differently expressed genes () in Myc+ vs. Myc − CD138+ B-cell lymphomas (see Western blot in ). Seventeen were up regulated. Ten were down regulated. CD138+ B-cell lymphomas with high Myc expression had elevated expression of Fos, FosB, and Jun. Fos/Fosb are leucine zipper proteins known to dimerize with the transcription factor c-jun. In association with Myc they are implicated in lymphoproliferation and tumor progression. Other up-regulated genes were factors implicated in transcription (Sp2, Atf3, and Klf2), cell metabolism (Per1, Kcnq5, and Gpr137c) and signalization (Prrc2b, Dusp18, Gm20388, and Gm26532) probably in relation to high proliferation rate of Myc+ CD138+ B-cell lymphomas. Ten genes were down regulated in CD138+ B-cell lymphomas with high Myc expression including genes implicated in cell adhesion (Sell and Itga2) and cell signaling/metabolism (CD52, IL4i1, Lfng, and Zfyve21) but without evident links to Myc pathways and proliferation. Thus, CD138+ B-cell lymphomas in our animal model showed a homogenous transcriptome signature, of major interest compared to data obtained with other c-myc-induced B-cell lymphoma models (such as Eµ-Myc and 3′RR-Myc mice) where arising lymphomas are heterogeneous with wide genomic differences [Citation11,Citation21]. Enrichment of previously established human Burkitt lymphoma (BL) and multiple myeloma signatures were tested in our CD138+ B-cell lymphomas. In contrast to BL (also with c-myc in the IgH locus), myeloma up and down signatures were significantly enriched, emphasizing the molecular similarity of mouse CD138+ B-cell lymphomas to human multiple myeloma cells () and the relevance of our mice as pertinent model of plasma B-cell lymphomas.
Figure 5. Transcriptome analysis of CD138+ and CD138- B-cell lymphomas. (A) Principal component analysis (PCA) of RNA-Seq gene expression data from 9 CD138+ (in red and green) and 3 CD138− (in blue) B-cell lymphomas. The location of 5 c-myc- CD138+ B-cell lymphomas is indicated in red. The location of 4 c-myc+ CD138+ B-cell lymphomas is indicated in green. (B) Volcano plot of differential gene expression in CD138+ and CD138− B-cell lymphoma samples. Up-regulated (in red) and down-regulated (in green) genes are shown. (C) Heat map of 100 most variable gene expressions across B-cell lymphoma samples (9 CD138+ and 3 CD138−); hierarchical clustering of genes/samples according to Pearson’s correlation metric and Ward’s method.
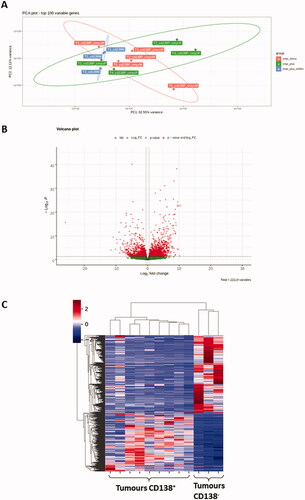
Figure 6. Transcriptome analysis of CD138 B-cell lymphomas. (A) Differentially expressed genes implicated in several metabolic/signaling pathways in CD138+ and CD138- B-cell lymphomas. The node circle size represents the number of genes in the pathway and the node circle colors (red and blue) correspond to the adjusted p values. (B) Detailed GSEA analysis of differentially expressed genes against human BL (http://www.informatics.jax.org/disease/DOID:8584) and multiple myeloma (C0026764: https://www.ncbi.nlm.nih.gov/medgen/10122) signatures.
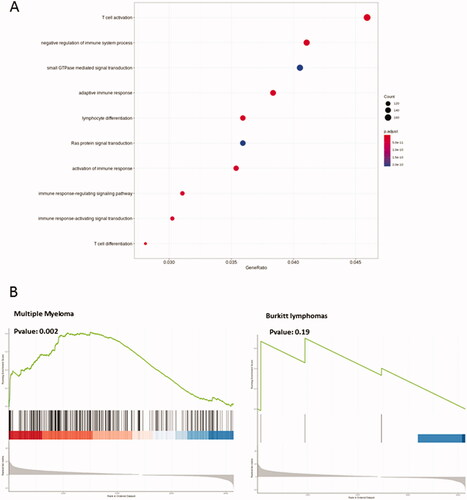
Table 1. Up and down-regulated genes in Myc+ vs. Myc − CD138+ B-cell lymphomas. Log2 fold change (FC) threshold >1 and adjusted p value <0.05.
Concluding remarks
C-myc translocation in the IgH locus followed by its deregulation, with the predominant contribution of the IgH transcriptional elements, is a key step in B-cell lymphoma development [Citation11]. If c-myc translocation into the IgH locus is the primum movens of several mature B-cell lymphomagenesis, it is the progressive accumulation of mutations (affecting cell proliferation, apoptosis, differentiation, and metabolism) generated by the c-myc-induced genomic instability that plays the critical role in B-cell lymphoma emergence. Consistent with this critical role of c-myc, a mouse model carrying a homozygous insertion of c-myc into the IgH locus develops B-cell lymphoma with a large part of CD138+ plasma cell neoplasms. The relatively rapid occurrence of plasma cell lymphomas in homozygous iMycCα mice and its interesting and large transcriptome similarities with human myelomas make this mouse model an accurate, reliable, easy, and fast experimental model, not only to test new therapeutic approaches, but also combinations to monitor new NK therapeutic vaccination strategies, to stimulate immune defenses for tumor rejection and to test protocols for monoclonal antibody therapies. As previously reported by us and others [Citation11,Citation22,Citation23], 3′RR targeting would in theory provide a potential strategy for the treatment of mature B-cell lymphomas. Until now only few compounds have been reported to down regulate IgH 3′RR activation such as histone deacetylase inhibitors (HDACi) [Citation22], aryl hydrocarbon receptor ligands [Citation24,Citation25], and chemical compounds [Citation26]. Recently the use of the HDACi SAHA (suberanilohydroxamic acid also known as vorinostat) was reported to be ineffective to target the 3′RR in B-cell lymphomas from mouse models bearing an IgH inserted c-myc [Citation27], highlighting the fact that 3′RR appears to be regulated differently in normal mature B-cells and mature B-cell lymphomas. Despite these first negative results, targeting IgH 3′RR enhancers would represent a promising therapeutic approach for the treatment of plasma cell malignancies and homozygous iMycCα mice would provide valuable insights into the identification of new IgH 3′RR-deregulated pathways for questioned/tested signaling pathways implicated not only on plasma cell malignancies but also in immune mature B-cell related disorders.
Author contributions
N.G., M.F., H.I., and E.D. contributed equally. Y.D and J.C-M designed research. N.G., H.I., M.F. and Y.D. performed research. E.D., M.F., and Y.D. analyzed mRNAseq data. C.O. performed western blot experiments. M.F., J.C-M, C.O., E.D., and Y.D. wrote the paper. Y.D. obtained grant supports.
Acknowledgments
Authors are ‘Equipe Labellisée LIGUE 2018.’ N.G. was supported by a grant from ‘Société Française d’Hématologie.’ H.I. and M.F. are supported by University of Limoges and ‘Région Nouvelle Aquitaine.’ We thank the GenoToul (Toulouse, France, get.genotoul.fr) for RNA seq experiments. We thank the animal facility of Limoges University (BISCEm US 42 INSERM/UMS 2015 CNRS) for mouse housing.
Disclosure statement
The authors declare no competing interest.
Additional information
Funding
References
- Blum KA, Lozanski G, Byrd JC. Adult Burkitt leukemia and lymphoma. Blood. 2004;104(10):3009–3020.
- Saintamand A, Rouaud P, Garot A, et al. The IgH 3' regulatory region governs μ chain transcription in mature B lymphocytes and the B cell fate. Oncotarget. 2015;6(7):4845–4852.
- Saintamand A, Rouaud P, Saad F, et al. Elucidation of IgH 3' region regulatory role during class switch recombination via germline deletion. Nat Commun. 2015;6:7084.
- Péron S, Laffleur B, Denis-Lagache N, et al. AID-driven deletion causes immunoglobulin heavy chain “locus suicide recombination” in B cells. Science. 2012;336(6083):931–934.
- Rouaud P, Vincent-Fabert C, Saintamand A, et al. The IgH 3' regulatory region controls somatic hypermutation in germinal center B cells. J Exp Med. 2013;210(8):1501–1507.
- Rouaud P, Vincent-Fabert C, Fiancette R, et al. Enhancers located in heavy chain regulatory region (hs3a, hs1,2, hs3b, and hs4) are dispensable for diversity of VDJ recombination. J Biol Chem. 2012;287(11):8356–8360.
- Rosean TR, Holman CJ, Tompkins VS, et al. KSHV-encoded vIL-6 collaborates with deregulated c-Myc to drive plasmablastic neoplasms in mice. Blood Cancer J. 2016;6:e398.
- Park SS, Kim JS, Tessarollo L, et al. Insertion of c-Myc into igh induces B-cell and plasma-cell neoplasms in mice. Cancer Res. 2005;65(4):1306–1315.
- Cheung WC, Kim JS, Linden M, et al. Novel targeted deregulation of c-myc cooperates with Bcl-XL to cause plasma cell neoplasms in mice. J Clin Invest. 2004;113(12):1763–1773.
- Ghazzaui N, Issaoui H, Ferrad M, et al. Eμ and 3'RR transcriptional enhancers of the IgH locus cooperate to promote c-myc-induced mature B-cell lymphomas. Blood Adv. 2020;4(1):28–39.
- Ferrad M, Ghazzaui N, Issaoui H, et al. Mouse models of c-myc deregulation driven by IgH locus enhancers as models of B-cell lymphomagenesis. Frontiers Immunol. 2020;11:1564.
- Jovanović KK, Roche-Lestienne C, Ghobrial IM, et al. Targeting MYC in multiple myeloma. Leukemia. 2018;32(6):1295–1306.
- Vincent-Fabert C, Fiancette R, Pinaud E, et al. Genomic deletion of the whole IgH 3' regulatory region (hs3a, hs1,2, hs3b, and hs4) dramatically affects class switch recombination and Ig secretion to all isotypes. Blood. 2010;116(11):1895–1898.
- Wingett SW, Andrews S. FastQ screen: a tool for multi-genome mapping and quality control. F1000Res. 2018;7:1338.
- Chen S, Zhou Y, Chen Y, et al. Fastp: an ultra-fast all-in-one FASTQ preprocessor. Bioinformatics. 2018;34(17):i884–i890.
- Ewels P, Magnusson M, Lundin S, et al. MultiQC: summarize analysis results for multiple tools and samples in a single report. Bioinformatics. 2016;32(19):3047–3048.
- Patro R, Duggal G, Love MI, et al. Salmon provides fast and bias-aware quantification of transcript expression. Nat Methods. 2017;14(4):417–419.
- Love MI, Huber W, Anders S. Moderated estimation of fold change and dispersion for RNA-seq data with DESeq2. Genome Biol. 2014;15(12):550.
- Issaoui H, Ghazzaui N, Saintamand A, et al. The IgH 3' regulatory region super-enhancer does not control IgA class switch recombination in the B1 lineage. Cell Mol Immunol. 2018;15(3):289–291.
- De Barrios O, Meler A, Parra M. MYC's fine line between B cell development and malignancy. Cells. 2020;9(2):523.
- Rempel RE, Jiang X, Fullerton P, et al. Utilization of the Eμ-Myc mouse to model heterogeneity of therapeutic response. Mol Cancer Ther. 2014;13(12):3219–3229.
- Lu ZP, Ju ZL, Shi GY, et al. Histone deacetylase inhibitor trichostatin a reduces anti-DNA autoantibody production and represses IgH gene transcription. Biochem Biophys Res Commun. 2005;330(1):204–209.
- Saintamand A, Saad F, Denizot Y. 3'RR targeting in lymphomagenesis: a promising strategy? Cell Cycle. 2015;14(6):789–790.
- Wourms MJ, Sulentic CEW. The aryl hydrocarbon receptor regulates an essential transcriptional element in the immunoglobulin heavy chain gene. Cell Immunol. 2015;295(1):60–66.
- Snyder AD, Ochs SD, Johnson BE, et al. Aryl hydrocarbon receptor-induced activation of the human IGH hs1.2 enhancer: mutational analysis of putative regulatory binding motifs. Mol Immunol. 2020;120:164–178.
- Dolloff NG. Discovery platform for inhibitors of IgH gene enhancer activity. Cancer Biol Ther. 2019;20(4):571–581.
- Ghazzaui N, Ferrad M, Issaoui H, et al. HDAC recruitment in the IgH locus 3' regulatory region is different between mature B-cells and mature B-cell lymphomas. Leuk Lymphoma. 2021;62:3511–3515.