
Abstract
Chronic lymphocytic leukemia (CLL) is a neoplasm of B-cells in the blood and monoclonal B-cell lymphocytosis (MBL) is a precursor state to CLL. This narrative review provides an overview of the genetic studies that identified 43 common variants associated with risk of CLL among individuals of European ancestry. Emerging studies found that ∼50% of these variants are associated with MBL risk. Moreover, the polygenic risk score (PRS) calculated from these CLL variants has been shown to be a robust predictor for both CLL and MBL risk among European ancestry individuals but a weak predictor among African ancestry individuals. By summarizing these genetic studies, we conclude that additional studies are needed in other race/ethnic populations to identify race-specific susceptibility variants, that functional studies are needed to validate the biological mechanisms of the variants, and that the clinical utility of the PRS is limited until preventive strategies for CLL are developed.
Introduction
Chronic lymphocytic leukemia (CLL) is a neoplasm of mature B-cells, with >5 × 10⁹ B-cells/L in the peripheral blood [Citation1]. These CLL cells typically co-express CD5, CD19, CD20dim, and CD23. Monoclonal B-cell lymphocytosis (MBL) is a precursor state to CLL [Citation2–4], with a clonal absolute B-cell count of <5 × 10⁹/L in the peripheral blood and notable absence of lymphadenopathy, cytopenias, or organomegaly [Citation1]. MBL can be classified by the size of the clone: low-count MBL (LC-MBL; clonal B-cell count <0.5 × 10⁹/L) or high-count MBL (HC-MBL; clonal B-cell count between 0.5 and 5 × 10⁹/L) [Citation1,Citation5–7] and by the immunophenotype, with the most common being CLL-like MBL (i.e. co-expression of CD5 and CD20dim) [Citation3,Citation8–10].
In this narrative review, we provide an overview of the familial risk and the inherited genetic contribution to the risk of CLL and MBL as evident in the literature. We then summarize the genetic studies that have been done to identify common inherited variants for risk of CLL and MBL and briefly discuss the emerging functional aspects of the CLL loci. We describe the polygenic risk score (PRS) and its association with risk of CLL and MBL, and we discuss the clinical utility of the PRS for risk prediction. Finally, we conclude with future directions.
Familial risk and heritability of CLL and MBL
CLL has a strong familial risk of disease [Citation11–13]. The largest study to date demonstrating this was in the Swedish Family Cancer Study in which the authors identified 18,521 primary CLL patients and their first-degree relatives (N = 43,075) [Citation13]. Using the standardized incidence ratio, the authors compared the rate of CLL in first-degree relatives to that of the expected rate from the general population. The authors reported an estimated 5.64-fold familial risk of CLL (95% confidence interval [CI]: 5.04–6.03). This familial risk increased to 6.99 for relatives of CLL cases who were diagnosed <65 years of age and increased to 27.13 for relatives of CLL cases with two or more first-degree relatives with CLL.
There is some evidence of a familial component to the risk of MBL [Citation3,Citation14–16]. In a study of 72 MBL cases and 380 controls, the authors found a 2.1-fold increased risk of MBL among those with any family history of hematological cancer (CI: 0.87–4.93) [Citation14]. A larger study of 365 individuals with MBL and 2512 controls known not to have MBL reported an association of 1.44 (CI: 0.99–2.09) for those with any first-degree relative with leukemia or lymphoma [Citation15]. There is also evidence of a familial component observed by a higher prevalence of MBL (15–22%) in families with two or more relatives with CLL [Citation3,Citation16,Citation17] compared to the 5–12% prevalence in the general population [Citation18,Citation19].
The genetic heritability of CLL is notably high, even when compared to other cancers [Citation20]. Heritability is a measure of how genetics influences the variability of a trait such as CLL. A large study of 203,000 monozygotic and dizygotic twin pairs from the Norwegian Twin Cancer Study reported that up to 57% of leukemias may be attributed to genetic factors [Citation20]. Another approach of estimating heritability is through using genotyping data from large genotyping arrays, e.g. genome wide association studies (GWAS). Using this alternative approach, the estimated heritability of CLL was reported to be 34% (±5%), with the potential to explain 57% of the overall familial risk, suggesting that more variants are yet to be identified [Citation21]. Collectively, these findings support a strong inherited genetic contribution to the risk of CLL and MBL.
GWAS of CLL
GWASs are study designs used to identify common inherited variants associated with risk of disease. Over the past 15 years, GWASs have identified and validated 43 single nucleotide polymorphisms (SNPs) associated with CLL risk among individuals of European ancestry [Citation21–29]. These susceptibility SNPs are common with minor allele frequencies >1%, have modest effect sizes ranging between 1.13 and 1.65 ( and ), and are near or in genes plausibly linked to CLL, including genes involved in apoptosis (including FAS, PMAIP1, BAK1, BCL2, BCL2L11, BMF, and CASP8/CASP10), telomere function (POT1, TERT, and TERC), transcription factors important in B-cell differentiation (IRF8, LEF1, PRKD3, and SP140), and B-cell receptor activation (IRF3 and HLA-DQA1). The putative biological mechanism of many of these established CLL SNPs is through epigenomic regulation [Citation30–32]. Specifically, using bioinformatic in silico approaches, strong evidence suggests that these susceptibility SNPs regulate genes encoding lineage transcription factors, BCL-2 family proteins, or cyclin-dependent kinase inhibitors that play important roles in oncogenesis or apoptiosis [Citation30–32]; however, no functional studies have been done to validate these findings. Moreover, there has been little evidence of interaction among these SNPs, compatible with them being independent effects, and none of the SNPs have individually shown a strong relationship with age at diagnosis of CLL or sex [Citation21–29].
Figure 1. List of the first 10 SNPs found to be associated with CLL risk and the association with CLL and MBL risk across five studies. InterLymph CLL study by Berndt et al. including 4486 CLL and 13,183 controls (Black); AA CLL study by Kleinstern et al. including 173 AA CLL cases from the AA CLL cohort and 235 AA controls from the Mayo Clinic Biobank (red); MBL meta-analysis study by Crowther-Swanepoel et al. including 419 individuals with MBL and 1753 controls obtained from three sites (blue); GEC MBL study by Kleinstern et al. including 95 familial MBL individuals and 1,267 Mayo controls (blue); Mayo Clinic MBL study by Kleinstern et al. including 560 individuals with MBL from the Mayo Clinic and 2631 controls from the Mayo Clinic Biobank (blue); SNPs: single nucleotide polymorphisms; CLL: chronic lymphocytic leukemia; MBL: monoclonal B-cell lymphocytosis; InterLymph: International Lymphoma of Epidemiology Consortium; AA: African ancestry; GEC: genetic epidemiology of CLL Consortium; OR: odds ratio; CI: confidence interval.
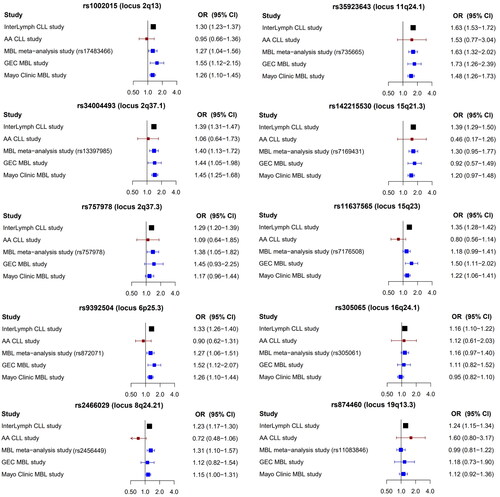
Figure 2. List of additional 31 SNPs found to be associated with CLL risk and the association with CLL and MBL risk across four studies. InterLymph CLL study by Berndt et al. including 4,486 CLL and 13,183 controls (Black); AA CLL study by Kleinstern et al. including 173 AA CLL cases from the AA CLL cohort and 235 AA controls from the Mayo Clinic Biobank (red); GEC MBL study by Kleinstern et al. including 95 familial MBL individuals and 1267 Mayo controls (blue); Mayo Clinic MBL study by Kleinstern et al. including 560 individuals with MBL from the Mayo Clinic and 2631 controls from the Mayo Clinic Biobank (blue); SNPs: single nucleotide polymorphisms; CLL: chronic lymphocytic leukemia; MBL: monoclonal B-cell lymphocytosis; InterLymph: International Lymphoma of Epidemiology Consortium; AA: African ancestry; GEC: genetic epidemiology of CLL Consortium; OR: odds ratio; CI: confidence interval.
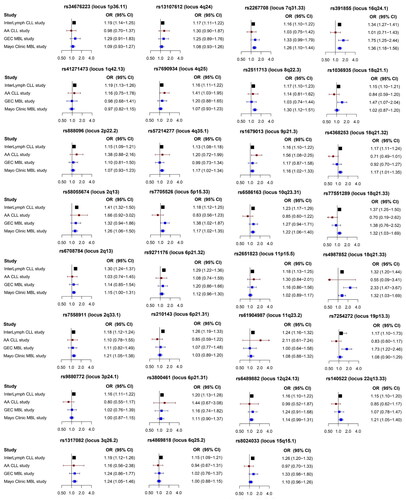
There does appear to be heterogeneity of the SNP associations by race. In an East Asian population of 71 CLL patients and 1273 controls, authors evaluated 6 CLL susceptibility SNPs; the SNPs near the IRF4 (rs872071), SP140 (rs13397985), and ACOXL (rs17483466) genes were associated with CLL risk (nominal p < 0.05), with a suggestive association with GRAMD1B (rs735665) [Citation33]. Several studies have evaluated CLL susceptibility SNPs among individuals of African ancestry [Citation15,Citation34]. In the largest study to date, the authors evaluated 41 CLL susceptibility SNPs in 173 CLL cases and 235 controls ( and ) [15]. Of the 41 SNPs, only two were nominally significant: near LEF1 (rs7690934, odds ratio [OR] = 1.41, CI: 1.03–1.95, p = 0.03) and CDKN2B genes (rs1679013, OR = 1.56, CI: 1.08–2.25, p = 0.02). In general, the minor allele frequencies of these SNPs in the Asian and African ancestry populations were much lower than that in populations of European ancestry, supporting the hypothesis that the lower prevalence of CLL genetic risk factors might explain part of the lower incidence of CLL in East Asian and African ancestry populations.
Genetic risk of MBL
Because MBL is a precursor condition to CLL, evaluating the genetic factors associated with MBL risk may provide insight into the pathogenesis of CLL. It is important to note that the prevalence of MBL is significantly higher than that of CLL, yet not everyone who has MBL progresses to CLL. Individuals with HC-MBL progress to CLL requiring therapy about 1–2% per year [Citation35,Citation36]. Individuals with LC-MBL who have two or more family members with CLL progress to CLL at about 1.1% per year, supporting the role inherited genetics plays on risk of CLL [Citation3]. The progression rate of LC-MBL to CLL among individuals in the general population is unknown but estimated to be <0.5% per year.
To date, no GWAS of MBL has been done. However, a number of studies have evaluated the known CLL susceptibility SNPs with risk of MBL () [Citation15,Citation24,Citation37,Citation38]. One of the more robust studies (totaling 419 individuals with MBL and 1,753 controls ascertained from three case-control series) evaluated SNPs from ten CLL susceptibility loci [Citation37]. Of note, the majority of the individuals with MBL in this study were HC-MBL. The authors found that six of the ten SNPs (2q37.1, 2q13, 2q37.3, 6p25.3, 8q24.21, 11q24.1) were statistically significant (p < 0.05) (). Another large study of genetic risk of MBL was from the Mayo Clinic that examined 41 CLL susceptibility SNPs in 560 individuals with MBL and 2,631 controls [Citation15]. Unique to this Mayo Clinic study is that the controls were known not to have MBL through screening. The authors found that 21 (51%) of the 41 SNPs were nominally statistically significant (, and ). The Mayo Clinic study was the first to stratify the MBLs by size of the B-cell clone with 396 individuals with LC-MBL and 164 individuals with HC-MBL. Although the authors found that the majority of the observed effect sizes of the SNPs were directionally consistent with those reported in CLL, only 12 SNPs were nominally associated with risk of LC-MBL and 10 SNPs were nominally associated with risk of HC-MBL. The lack of significance for risk of MBL overall or by subtype of MBL may be due to lack of statistical power. However, it is interesting to note that 13 SNPs from the Mayo Clinic study showed little evidence of an association with risk of MBL with OR < 1.1 (p > 0.05, , and ) yet these SNPs are established SNPs for risk of CLL. Collectively these studies suggest that some of the CLL susceptibility SNPs may be associated with developing the B-clone at the MBL stage and other SNPs may be associated with progression of the B-cell clone reaching the HC-MBL or CLL stage. More work is needed to tease out this hypothesis.
Table 1. List of 41 SNPs associated with CLL risk and their association with MBL risk across three studies.
Polygenic risk score (PRS) and risk of CLL among individuals of European ancestry
Since the effect sizes of the individual CLL susceptibility SNPs are small, <1.7 per variant allele, each SNP is a weak predictor of CLL risk. Studies have shown that when combining representative SNPs into a single summary measure, such as the PRS, one can show varying levels of risk stratification for CLL and observe a better risk prediction [Citation39]. There are several approaches to computing the PRS [Citation40]. One approach is to compute the sum of the number of risk alleles across the known susceptibility SNPs for each person. This approach assumes each SNP has equal weight on the PRS. The more common approach is to take a weighted average of the number of risk alleles across the susceptibility SNPs, where the weights are the corresponding effect sizes estimated from GWAS; these weights account for the impact of each SNP on the disease risk. In CLL, the weights were obtained from the largest GWAS of CLL to date [Citation21].
In , we show the previously published distributions of the weighted PRS across controls, individuals with MBL, and CLL [Citation15,Citation38]. There are several key points that one can observe from . First, the distributions of the PRS among three large control series are consistent, with median values ranging between 7.46 and 7.59. In contrast, the PRS distribution among controls from the Genetic Epidemiology of CLL (GEC) Consortium is significantly higher than the three control series, with a median PRS = 8.09 (p < 0.0001, ), due to the fact that these GEC controls come from families with two or more members with CLL that have an enrichment of inherited CLL variants. Second, the PRS distribution among two of the three CLL cases series of European ancestry have also consistent distributions (median PRS of 8.24–8.26); yet the PRS distribution from the familial GEC CLL case series is significantly elevated (median PRS = 8.51, p < 0.001, ). Third, the PRS distribution from cases and controls of African ancestry is lower than that of the respective cases and controls of European ancestry. Finally, the PRS distribution from MBL is in between those of controls and CLL cases. It has been previously shown that there is a significant trend of the median PRS as one goes from controls to LC-MBL, HC-MBL, and CLL (p = 4.3 × 10−85) [Citation15].
Figure 3. (A) Distribution of the CLL-PRS by controls and CLL/MBL cohorts from different studies. Boxplots representing the CLL-PRS distribution based on 41 CLL susceptibility SNPs, across controls (light grey), AA controls (dark grey), individuals with MBL (blue), CLL cases (red), and AA CLL cases (dark red). The horizontal line and score in each box represent the median CLL-PRS for each cohort. (B) Forest plot of the association between the CLL-PRS and risk of CLL and MBL across different studies. *InterLymph study by Kleinstern et al. including 8 studies from InterLymph with a CLL-PRS based on 41 CLL-susceptibility SNPs; **InterLymph study by Berndt et al. (in Press, Leukemia) including 24 studies from InterLymph with a CLL-PRS based on 43 CLL-susceptibility SNPs; PRS: polygenic risk score; SNPs, single nucleotide polymorphisms; CLL: chronic lymphocytic leukemia; MBL: monoclonal B-cell lymphocytosis; LC: low-count; HC: high-count; AA: African ancestry; InterLymph: International Lymphoma of Epidemiology Consortium; GEC: genetic epidemiology of CLL Consortium; FH: family history; OR: odds ratio; CI: confidence interval.
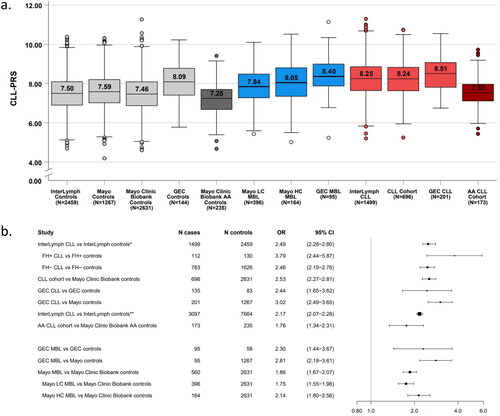
The association between the risk of CLL and the PRS, regardless of the approach used to compute the PRS, has been found to be consistently associated [Citation15,Citation28,Citation38,Citation41]. One of the first studies computed an unweighted PRS of 30 CLL risk variants that were genome-wide significant at <5 × 10⁻⁸ and reported an association with risk of CLL ()[Citation28]. Another study from the International Lymphoma Epidemiology (InterLymph) Consortium comprised of 8 individual studies reported that the weighted PRS of 41 SNPs that were genome-wide significant at <5 × 10⁻⁸ was associated with a 2.49-fold increased risk for CLL (, ) [Citation38]. The association of the PRS with CLL increased to 3.79 when stratifying the cases and controls by any family history of hematological malignancy (). The InterLymph study was recently updated to include 24 studies and found that the weighted PRS of 43 genome-wide significant SNPs was associated with a 2.17-fold increased risk for CLL (, ) [Citation42]. Finally, another study compared two methods to compute the PRS with risk of CLL using data from InterLymph [Citation41]. The first method included 2025 susceptibility SNPs at an optimized p-value threshold and the other method included 20 CLL susceptibility SNPs that were genome-wide significant at <5 × 10⁻⁸; both approaches weighted the SNPs by the corresponding effect size. The two approaches did not reveal significant differences in terms of relative risk or predictive performance according to the c-statistic [Citation38] given the current sample size of cases and controls found in GWASs. However, as the sample sizes increases in GWAS of CLL, the optimized p value threshold approach may provide increased predictability over a PRS that uses just the CLL susceptibility SNPs that are genome-wide significant [Citation41]. Because the CLL cases and controls from these PRS studies were used to identify the CLL susceptibility SNPs through GWAS, the PRS association may be inflated. Independent sample of cases and controls are needed.
Table 2. Cohort and model description of the polygenic risk score studies.
The first study to evaluate the weighted PRS of 41 SNPs in an independent sample of CLL cases and controls who were not used in any GWAS was from the GEC Consortium of families with more than two members with CLL [Citation38]. The authors reported that the PRS was associated with 2.44-fold increased risk for CLL (). The risk of CLL increased to 3.51 among those who were in the top 20% of the PRS distribution and decreased to 0.2 among those who were in the bottom 20% of the PRS distribution relative to the middle quintile. The association of the weighted PRS of 41 SNPs was replicated in another independent cohort of 696 CLLs and 2,631 controls known not to have MBL from the Mayo Clinic with a 2.53-fold increased risk for CLL () [Citation29]. The risk of CLL increased to 3.49 among those who were in the top 20% of the PRS distribution and decreased to 0.31 among those who were in the bottom 20% of the PRS distribution relative to the middle quintile. Together, these studies demonstrate that the PRS is consistently significantly associated with risk of CLL, independent of age and sex (two other important risk factors for CLL), among individuals of European ancestry. Of note, those in the lower 20% of the PRS distribution have a protective effect against risk of CLL but that is only 5% of the CLL cases compared to 20% of the controls [Citation15].
Polygenic risk score and risk of CLL among individuals of African ancestry
Because the SNPs used to comprise the CLL-PRS were identified from GWASs of European ancestry, it is important to evaluate the generalizability of the PRS across other racial and ethnic populations. Only one study to date has evaluated the PRS in another racial or ethnic cohort; this study evaluated the weighted PRS of 41 susceptibility SNPs in a cohort of 173 CLL cases and 235 controls of African ancestry () [Citation15]. The authors found that the PRS had a 1.76-fold risk for CLL (), significantly lower effect size than that among individuals of European ancestry. This study also used an unweighted PRS to evaluate the risk of CLL in African ancestry, and still observed an attenuated effect size of 1.07 (CI: 1.01–1.13, p = 0.03). Clearly, a PRS comprised of SNPs identified among European ancestry has reduced generalizability among individuals of African ancestry. This is not surprising per se given the allele frequencies and effect sizes of the CLL susceptibility SNPs among individuals of African ancestry were in generally lower than that of Europeans ( and ). Future GWAS are needed in other racial and ethnic populations to identify novel SNPs unique to the population and improve the risk prediction of the PRS.
Polygenic risk score and risk of MBL among individuals of European ancestry
Two studies evaluated the association of the PRS with risk of MBL [Citation15,Citation38]. The first is in the GEC consortium consisting of a small cohort of 95 GEC MBLs (of whom 93% were LC-MBL) and 58 GEC controls [Citation38]. The authors reported a 2.3-fold increased risk for MBL (95% CI: 1.44–3.67) for the weighted PRS of 41 SNPs (). Another study evaluated 560 MBLs and 2631 controls known not to have MBL from the Mayo Clinic Biobank and found that the weighted PRS using 41 SNPs was associated with a 1.86-fold increased risk for MBL () [Citation15]. In subtype analyses by the size of the MBL clone, the association of the PRS with risk of LC-MBL and HC-MBL was 1.75- and 2.14-fold increased risk, respectively, with a significant positive trend (p < 0.0001) between the PRS effect sizes and risk of LC-MBL, HC-MBL, and CLL, meaning that the association increased as the clonal size increased [Citation15]. No studies to date have evaluated the PRS by the subtypes of MBL based on immunophenotype. Although the genetic studies of risk of MBL listed in did not explicitly state the MBL immunophenotype, presumably most were CLL-like MBL since that immunophenotype is the most common among individuals of European ancestry [Citation3,Citation8–10].
Clinical utility of PRS for risk prediction of CLL and MBL
Given that the PRS has been shown to be statistically significant with both risk of CLL and MBL, and given that the PRS has been validated in two independent studies of CLL and MBL, a question is whether the PRS may be utilized clinically for risk prediction. The studies of the PRS based on 41 SNPs reported good discriminative power for risk of CLL, with the c-statistic ranging between 0.77 and 0.8 among individuals of European ancestry (). Similarly, a good discriminative power was observed for risk of MBL (c-statistic ranged between 0.72 and 0.77, ). Further validation of the PRS would be ideal using a cohort study design. Thus, there is evidence that PRS is a strong predictor for both risk of MBL and CLL. This finding, however, did not generalize to individuals of African ancestry, in which the PRS of 41 SNPs had poor discrimination (c-statistic = 0.62, ). Although PRS is a strong biomarker among individuals of European ancestry, the clinical utility is limited at this time since there are no currently existing preventive strategies of risk of CLL and MBL, and no evidence of an improved overall survival among CLL patients treated at an early stage of CLL [Citation43]. Furthermore, a prior study reported that indolent CLL patients in a watch-and-wait strategy for treatment-experienced distress and worse quality-of-life compared to lymphoma patients who received treatment at time of diagnosis [Citation44]. Thus the clinical utility of the PRS is on hold until further preventive and therapeutic strategies are developed.
Conclusions
CLL has a strong genetic component with a high heritability. Numerous studies have identified and robustly validated 43 common variants associated with risk of CLL among individuals of European ancestry, and emerging studies are finding that ∼50% of these CLL susceptibility are SNPs associated with risk of MBL. The PRS calculated from these known CLL-susceptibility SNPs has been shown to be a robust predictor for both risk of CLL and MBL among individuals of European ancestry but a weak predictor of risk among African ancestry individuals. Clinical utility of the PRS is limited at this time until preventive strategies for CLL are developed.
Future studies are needed in four key areas. First, there is a clear need for GWAS of CLL in other race and ethnicities to identify SNPs which may be unique to each population. This will allow further understanding of the heterogeneity of risk across populations, gain more insight to the pathogenesis of CLL, and improve the development of PRS that are more tailored to each population. The current PRS are disproportionately applicable to cases of European ancestry. Second, there is evidence that genetic studies of MBL may help provide more insight into the biological mechanisms of the SNPs in that some SNPs may be important for developing the B-cell clone while others may be important for clonal expansion. Third, functional studies are needed to validate the in silico putative reported biological mechanisms of the established CLL SNPs. Finally, the clinical utility of the PRS may be limited at this time until future studies develop preventive strategies for CLL.
Disclosure statement
No potential conflict of interest was reported by the author(s).
Additional information
Funding
References
- Hallek M, Cheson BD, Catovsky D, et al. iwCLL guidelines for diagnosis, indications for treatment, response assessment, and supportive management of CLL. Blood. 2018;131(25):2745–2760.
- Landgren O, Albitar M, Ma W, et al. B-cell clones as early markers for chronic lymphocytic leukemia. N Engl J Med. 2009;360(7):659–667.
- Slager SL, Lanasa MC, Marti GE, et al. Natural history of monoclonal B-cell lymphocytosis among relatives in CLL families. Blood. 2021;137(15):2046–2056.
- Kolijn PM, Hosnijeh FS, Spath F, et al. High-risk subtypes of chronic lymphocytic leukemia are detectable as early as 16 years prior to diagnosis. Blood. 2022;139(10):1557–1563.
- Marti GE, Rawstron AC, Ghia P, et al. Diagnostic criteria for monoclonal B-cell lymphocytosis. Br J Haematol. 2005;130(3):325–332.
- Shanafelt TD, Ghia P, Lanasa MC, et al. Monoclonal B-cell lymphocytosis (MBL): biology, natural history and clinical management. Leukemia. 2010;24(3):512–520.
- Rawstron AC, Shanafelt T, Lanasa MC, et al. Different biology and clinical outcome according to the absolute numbers of clonal B-cells in monoclonal B-cell lymphocytosis (MBL). Cytometry B Clin Cytom. 2010;78(1):S19–S23.
- Dagklis A, Fazi C, Sala C, et al. The immunoglobulin gene repertoire of low-count chronic lymphocytic leukemia (CLL)-like monoclonal B lymphocytosis is different from CLL: diagnostic implications for clinical monitoring. Blood. 2009;114(1):26–32.
- Slager SL, Parikh SA, Achenbach SJ, et al. Prevalence and overall survival of low count monoclonal B-Cell lymphocytosis (LC-MBL): a screening study of 8,297 individuals from the Mayo clinic biobank. Blood. 2021;138(1):2632–2632.
- Fazi C, Scarfo L, Pecciarini L, et al. General population low-count CLL-like MBL persists over time without clinical progression, although carrying the same cytogenetic abnormalities of CLL. Blood. 2011;118(25):6618–6625.
- Goldin LR, Bjorkholm M, Kristinsson SY, et al. Elevated risk of chronic lymphocytic leukemia and other indolent non-Hodgkin’s lymphomas among relatives of patients with chronic lymphocytic leukemia. Haematologica. 2009;94(5):647–653.
- Slager SL, Benavente Y, Blair A, et al. Medical history, lifestyle, family history, and occupational risk factors for chronic lymphocytic leukemia/small lymphocytic lymphoma: the interlymph non-Hodgkin lymphoma subtypes project. J Natl Cancer Inst Monogr. 2014;2014(48):41–51.
- Sud A, Chattopadhyay S, Thomsen H, et al. Analysis of 153 115 patients with hematological malignancies refines the spectrum of familial risk. Blood. 2019;134(12):960–969.
- Casabonne D, Almeida J, Nieto WG, et al. Common infectious agents and monoclonal B-cell lymphocytosis: a cross-sectional epidemiological study among healthy adults. PLOS One. 2012;7(12):e52808.
- Kleinstern G, Weinberg JB, Parikh SA, et al. Polygenic risk score and risk of monoclonal B-cell lymphocytosis in Caucasians and risk of chronic lymphocytic leukemia (CLL) in African Americans. Leukemia. 2022;36(1):119–125.
- Marti GE, Carter P, Abbasi F, et al. B-cell monoclonal lymphocytosis and B-cell abnormalities in the setting of familial B-cell chronic lymphocytic leukemia. Cytometry B Clin Cytom. 2003;52(1):1–12.
- Rawstron AC, Yuille MR, Fuller J, et al. Inherited predisposition to CLL is detectable as subclinical monoclonal B-lymphocyte expansion. Blood. 2002;100(7):2289–2290.
- Rawstron AC, Green MJ, Kuzmicki A, et al. Monoclonal B lymphocytes with the characteristics of "indolent" chronic lymphocytic leukemia are present in 3.5% of adults with normal blood counts. Blood. 2002;100(2):635–639.
- Ghia P, Prato G, Scielzo C, et al. Monoclonal CD5+ and CD5- B-lymphocyte expansions are frequent in the peripheral blood of the elderly. Blood. 2004;103(6):2337–2342.
- Mucci LA, Hjelmborg JB, Harris JR, et al. Familial risk and heritability of cancer among twins in nordic countries. JAMA. 2016;315(1):68–76.
- Law PJ, Berndt SI, Speedy HE, et al. Genome-wide association analysis implicates dysregulation of immunity genes in chronic lymphocytic leukaemia. Nat Commun. 2017;8:14175.
- Di Bernardo MC, Crowther-Swanepoel D, Broderick P, et al. A genome-wide association study identifies six susceptibility loci for chronic lymphocytic leukemia. Nat Genet. 2008;40(10):1204–1210.
- Crowther-Swanepoel D, Broderick P, Di Bernardo MC, et al. Common variants at 2q37.3, 8q24.21, 15q21.3 and 16q24.1 influence chronic lymphocytic leukemia risk. Nat Genet. 2010;42(2):132–136.
- Slager SL, Rabe KG, Achenbach SJ, et al. Genome-wide association study identifies a novel susceptibility locus at 6p21.3 among familial CLL. Blood. 2011;117(6):1911–1916.
- Slager SL, Skibola CF, Di Bernardo MC, et al. Common variation at 6p21.31 (BAK1) influences the risk of chronic lymphocytic leukemia. Blood. 2012;120(4):843–846.
- Crowther-Swanepoel D, Di Bernardo MC, Jamroziak K, et al. Common genetic variation at 15q25.2 impacts on chronic lymphocytic leukaemia risk. Br J Haematol. 2011;154(2):229–233.
- Berndt SI, Skibola CF, Joseph V, et al. Genome-wide association study identifies multiple risk loci for chronic lymphocytic leukemia. Nat Genet. 2013;45(8):868–876.
- Speedy HE, Di Bernardo MC, Sava GP, et al. A genome-wide association study identifies multiple susceptibility loci for chronic lymphocytic leukemia. Nat Genet. 2014;46(1):56–60.
- Berndt SI, Camp NJ, Skibola CF, et al. Meta-analysis of genome-wide association studies discovers multiple loci for chronic lymphocytic leukemia. Nat Commun. 2016;7:10933.
- Kandaswamy R, Sava GP, Speedy HE, et al. Genetic predisposition to chronic lymphocytic leukemia is mediated by a BMF super-enhancer polymorphism. Cell Rep. 2016;16(8):2061–2067.
- Speedy HE, Beekman R, Chapaprieta V, et al. Insight into genetic predisposition to chronic lymphocytic leukemia from integrative epigenomics. Nat Commun. 2019;10(1):3615.
- Yan H, Tian S, Kleinstern G, et al. Chronic lymphocytic leukemia (CLL) risk is mediated by multiple enhancer variants within CLL risk loci. Hum Mol Genet. 2020;29(16):2761–2774.
- Lan Q, Au WY, Chanock S, et al. Genetic susceptibility for chronic lymphocytic leukemia among Chinese in Hong Kong. Eur J Haematol. 2010;85(6):492–495.
- Coombs CC, Rassenti LZ, Falchi L, et al. Single nucleotide polymorphisms and inherited risk of chronic lymphocytic leukemia among African Americans. Blood. 2012;120(8):1687–1690.
- Rawstron AC, Bennett FL, O’Connor SJ, et al. Monoclonal B-cell lymphocytosis and chronic lymphocytic leukemia. N Engl J Med. 2008;359(6):575–583.
- Parikh SA, Chaffee KG, Larson MC, et al. Outcomes of a large cohort of individuals with clinically ascertained high-count monoclonal B-cell lymphocytosis. Haematologica. 2018;103(6):e237–e240.
- Crowther-Swanepoel D, Corre T, Lloyd A, et al. Inherited genetic susceptibility to monoclonal B-cell lymphocytosis. Blood. 2010;116(26):5957–5960.
- Kleinstern G, Camp NJ, Goldin LR, et al. Association of polygenic risk score with the risk of chronic lymphocytic leukemia and monoclonal B-cell lymphocytosis. Blood. 2018;131(23):2541–2551.
- Torkamani A, Wineinger NE, Topol EJ. The personal and clinical utility of polygenic risk scores. Nat Rev Genet. 2018;19(9):581–590.
- Chatterjee N, Shi J, García-Closas M. Developing and evaluating polygenic risk prediction models for stratified disease prevention. Nat Rev Genet. 2016;17(7):392–406.
- Zhang YD, Hurson AN, Zhang H, et al. Assessment of polygenic architecture and risk prediction based on common variants across fourteen cancers. Nat Commun. 2020;11(1):3353.
- Berndt SI, Vijai J, Benavente Y, et al. Distinct germline genetic susceptibility profiles identified for common non-Hodgkin lymphoma subtypes. Leukemia. 2022;36(12):2835–2844.
- Muchtar E, Kay NE, Parikh SA. Early intervention in asymptomatic chronic lymphocytic leukemia. Clin Adv Hematol Oncol. 2021;19(2):92–103.
- Trevino KM, Martin P, Chen Z, et al. Worsening quality of life in indolent non-Hodgkin lymphoma and chronic lymphocytic leukemia patients in active surveillance: a 12-month longitudinal study. Clin Lymphoma Myeloma Leuk. 2022;22(2):82–88.