ABSTRACT
In order to better understand the characteristics of atmospheric carbonaceous aerosol at a background site in Northeast Asia, semicontinuous organic carbon (OC) and elemental carbon (EC), and time-resolved water-soluble organic carbon (WSOC) were measured by a Sunset OC/EC and a PILS-TOC (particle-into-liquid sampler coupled with an online total organic carbon) analyzer, respectively, at the Gosan supersite on Jeju Island, Korea, in the summer (May 28–June 17) and fall (August 24–September 30) of 2009. Hourly average OC concentration varied in the range of approximately 0.87–28.38 μgC m−3, with a mean of 4.07 ± 2.60 μgC m−3, while the hourly average EC concentration ranged approximately from 0.04 to 8.19 μgC m−3, with a mean of 1.35 ± 0.71 μgC m−3, from May 28 to June 17, 2009. During the fall season, OC varied in the approximate range 0.9–9.6 μgC m−3, with a mean of 2.30 ± 0.80 μgC m−3, whereas EC ranged approximately from 0.01 to 5.40 μgC m−3, with a mean of 0.66 ± 0.38 μgC m−3. Average contributions of EC to TC and WSOC to OC were 26.0% ± 9.7% and 20.6% ± 7.4%, and 37.6% ± 23.5% and 57.2% ± 22.2% during summer and fall seasons, respectively. As expected, clear diurnal variation of WSOC/OC was found in summer, varying from 0.22 during the nighttime up to 0.72 during the daytime, mainly due to the photo-oxidation process. In order to investigate the effect of air mass pathway on the characteristics of carbonaceous aerosol, 5-day back-trajectory analysis was conducted using the HYSPLIT model. The air mass pathways were classified into four types: Continental (CC), Marine (M), East Sea (ES) and Korean Peninsula (KP). The highest OC/EC ratio of 3.63 was observed when air mass originated from the Continental area (CC). The lowest OC/EC ratio of 0.79 was measured when air mass originated from the Marine area (M). A high OC concentration was occasionally observed at Gosan due to local biomass burning activities. The contribution of secondary OC to total OC varied approximately between 8.4% and 32.2% and depended on air mass type.
Organic material contributes approximately 20–90% of the total fine particulate mass concentration at different sites over the world depending on location and season. Organic carbon consists of hundreds of compounds with a wide range of chemical and optical properties. A better understanding of the chemical characteristics of carbonaceous aerosol influenced by increasing anthropogenic pollution in the downwind regions of the East Asian continent is needed in order to determine their impacts on regional air quality and climate change.
INTRODUCTION
Carbonaceous aerosol is a significant component of atmospheric fine particulate matter (PM).Citation1–2 However, it is one of the least understood chemical fractions of ambient particles. Previous studies have shown that carbonaceous aerosol has a large effect on visibility impairment,Citation3 earth radiative forcing,Citation4 as well as adverse effects on health.Citation5 Carbonaceous aerosol is usually classified as elemental carbon (EC) and organic carbon (OC). EC is produced only by a combustion process as primary material. OC can be directly emitted from a wide range of sources, including combustion of fossil fuels, direct injection of unburnt fuel and lubricants, industrial emissions, plant matter, biomass burning, and biogenic emissions. It can also be formed by gas-to-particle conversion in the atmosphere.Citation6 Organic aerosol is chemically highly complex, and includes compounds that range from the relatively water-soluble to -insoluble. Water-soluble organic carbon (WSOC), which can significantly alter the hygroscopicity of aerosols, is important in determining the ability of particles to act as cloud condensation nuclei (CNN). A significant part, typically 10–70%, of organic matter in atmospheric aerosols is water-soluble.Citation7–10 A major source of WSOC is thought to be secondary organic aerosols (SOAs), which are formed by oxidation of volatile organic compounds (VOCs) followed by condensation on existing particles and/or nucleation. Despite the evident significance of OC and EC in atmospheric and environmental processes, our knowledge of their concentrations, sources, and formation mechanisms is quite poor, especially in Asia. The atmospheric aerosol distributions off the east cost of Asia are particularly complex due to the strong influences of anthropogenic emissions and dust storms. To date, a number of aerosol measurements have been made to investigate the transport and transformation processes of aerosols over downwind regions of the East Asian continent. Aerosol Characterization Experiments Asia (ACE-Asia) focused on aerosol outflow from the Asian Continent to the Pacific Ocean because both anthropogenic aerosols and Asian dust particles affect the atmospheric environment and radiation balance in downwind regions.Citation11,Citation12 The chemical, physical, and optical properties of atmospheric aerosols originating from the Asian continent were investigated during East Asian Regional Experiments 2005 (EAREX 2005).Citation13 There have been a number of studies conducted on carbonaceous aerosol at the Gosan background site since the ACE-Asia campaign.Citation11,Citation14–16 However, there have been few time-resolved measurements of carbonaceous aerosol. The objectives of this study are to better understand the characteristics of atmospheric carbonaceous aerosol at a background site in Northeast Asia, and to estimate the contribution of secondary OC to total OC for different air mass types.
EXPERIMENTAL
Sampling Site
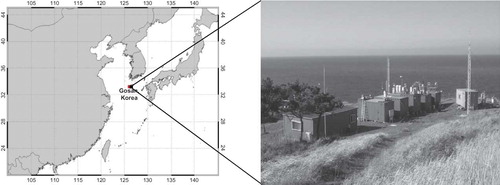
Hourly EC, OC, and WSOC concentrations were measured in the summer (May 28–June 17) and fall (August 24–September 30) of 2009 at the Gosan ground measurement supersite (33.17°N, 126.10°E, 60 m above sea level [ASL]) on Jeju Island, located approximately 100 km south of the Korean peninsula (). Gosan is regarded as one of the representative background monitoring sites in Northeast Asia since its establishment in 2001, during the ACE-Asia campaign.Citation11
Figure 1. Location of the sampling site.
Instrumentation
Particulate carbonaceous aerosol was measured using a Sunset Laboratory semicontinuous OC/EC analyzer (model RT3015, Tigard, OR, USA) with a thermal-optical transmittance (TOT) protocol for pyrolysis correction.Citation3,Citation17,Citation18 For the analysis of OC and EC, ambient air was drawn at a flow rate of 8 liters per minute (LPM) through a PM2.5 sharp-cup cyclone. The sampled aerosol was passed through a multichannel parallel-plate denuder with a carbon-impregnated filter (CIF) before it was collected on a quartz-fiber filter in order to remove semivolatile organic vapors that could be potentially absorbed onto the quartz-filter media.Citation19 OC and EC were analyzed based on the NIOSH (National Institute for Occupational Safety and Health) Method 5040 temperature profile.Citation20,Citation21 The analyzer was automatically calibrated at the end of every analysis cycle by injecting an internal standard CH4 mixture (5% CH4 in He), via a fixed-injection-volume loop, to compensate for the variability in the instrument's nondispersive infrared (NDIR) sensor responses. For temporal resolution of a 1 hr (44 min of sample collection) measurement, the detection limit of EC was 0.01 μgC m–3, calculated as 3 times the standard deviation (3σ) of a filtered air measurement (dynamic blank). The uncertainty of this system is reported to be 5%.Citation22 The WSOC concentration was determined by a particle-into-liquid sampler (PILS) coupled with an online total organic carbon (TOC) analyzer (Sievers, model 900). Details of the PILS-TOC analyzer have been described elsewhere.Citation8 Briefly, ambient aerosol passes through a PM2.5-size-cut impactor, maintained at 16.7 L min−1 by a critical orifice and denuded (annular and carbon denuder, respectively) for removal of gaseous components. The remaining particles are mixed with high-purity steam, injected coaxially, and maintained at a flow rate of 1.5 mL min-1 with a steam temperature of 98 ± 5 °C. The grown particles, now droplets, are collected on an impactor. The carbonaceous compounds in the liquid sample are then measured online using a TOC analyzer at a flow rate of 0.3 mL min−1. In the TOC analyzer, organic compounds dissolved in deionized water are oxidized to form carbon dioxide (CO2) using an ultraviolet (UV) lamp and ammonium persulfate as a chemical oxidizing agent. The CO2 formed is then determined using a membrane-based conductivity detection technique.
Quality Control
Quality control measurements carried out during the intensive measurement period are summarized in .
Table 1. Schedule of quality control (QC) activities performed during the intensive measurement period
For the semicontinuous OC/EC analyzer, an instrument blank was run every 3–4 days to check for system contamination and any dependence of the laser signal on oven temperature. The analytical settings of the instrument blank were identical to those used for normal sample analyses, except the instrument was operated with a “zero-second” sampling time.Citation22 The average instrument blank was 0.36 ± 0.22 μgC m−3 and 0.002 ± 0.002 μgC m−3 for OC and EC, respectively. A dynamic blank was run every other day to quantify adsorption of any remaining organic vapors (i.e., not retained by the denuder) on the sampling filter (positive artifacts19). To collect a dynamic blank, a HEPA (high-efficiency particulate air) filter was placed upstream of the denuder so that particle-free ambient air was sampled and analyzed on a 1-hr collection/analysis cycle. The average dynamic blank was 0.88 ± 0.41 μgC m−3, which corresponds to 21.6% of the measured OC. Correction was made for the dynamic blank in subsequent OC analysis. The denuder material was replaced before each intensive measurement to remove or reduce adsorbed vapors.
To determine the background organic carbon in the PILS-TOC measurement system, sampling was done every 5 hr for half an hour after placing a HEPA filter upstream of the PM2.5-size-cut impactor. The standard deviation of the background WSOC concentration was ∼0.14 μgC m−3. This background WSOC was subtracted from the measured WSOC to obtain the ambient WSOC concentration.Citation7 After the annular denuder was coated with citric acid in methanol and sodium carbonate in distilled water, the carbon denuder material was replaced before each intensive measurement to remove adsorbed vapors. The 0.5-μm PEEK (polyetheretherketone) filter was changed daily to limit pressure drops across the filter.7
RESULTS AND DISCUSSIONS
Temporal and Diurnal Variation of Carbonaceous Aerosol Concentration
Hourly average OC concentration varied in the range of 0.87∼28.38 μgC m−3, with a mean of 4.07 ± 2.60 μgC m−3, whereas the hourly average EC concentration ranged from 0.04 to 8.19 μgC m−3, with a mean of 1.35 ± 0.71 μgC m−3, from May 28 to June 17, 2009 (). During the fall season, OC varied in the range of 0.9∼9.6 μgC m−3, with a mean of 2.4 ± 0.9 μgC m−3, whereas EC ranged about from 0.01 to 5.4 μgC m−3, with a mean of 0.7 ± 0.4 μgC m−3 (). Average contributions of EC to total carbon (TC) and WSOC to OC were 26.0% ± 9.7% and 20.6% ± 7.4%, and 37.6% ± 23.5% and 57.2% ± 22.2% during the summer and fall seasons, respectively. High organic carbon concentrations were measured occasionally at the sampling site due to the impacts of local biomass burning and long-range transported pollution particles (, ). As expected, clear diurnal variation of WSOC/OC was found in the summer season, varying from 0.22 at nighttime up to 0.72 during the daytime, mainly due to the photo-oxidation process ().
Figure 2. Temporal variations of carbonaceous aerosol components, wind speed, and wind direction at the Gosan supersite during the summer intensive measurement period of 2009.
Figure 3. Temporal variations of carbonaceous aerosol components, wind speed, and wind direction at the Gosan supersite during the fall intensive measurement period of 2009.
Figure 4. Diurnal variation of the WSOC/OC ratio at Gosan from May 28 to June 17, 2009.
Air Mass Classification and Characterizing Sources
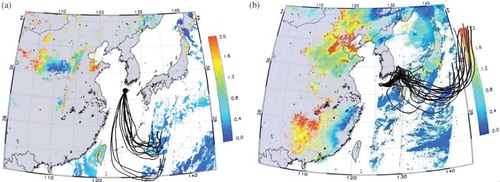
In order to investigate the effect of air mass pathway on the characteristics of carbonaceous aerosol, 5-day back-trajectory analysis was conducted using the HYSPLIT (HYbrid Single-Particle Lagrangian Integrated Trajectory) model.Citation23 The air mass pathways were classified into four types: Continental (CC), Marine (M), East Sea (ES), and Korean Peninsula (KP) (). To confirm local biomass burning and long-range transported pollution events, aerosol optical thickness (AOT) was retrieved from MODerate resolution Imaging Spectroradimeter (MODIS) data using the Modified Bremen AErosol Retrieval (MBAER) algorithm.Citation24 Local biomass burning was observed occasionally near the sampling site; however, its intensity was not so high as to be detected by a satellite. Our time-resolved EC/OC in situ measurements captured those events. For instance, the hourly OC concentration spiked near 20 μgC m−3 at around 3:00 p.m. on June 9, yet the WSOC concentration did not increase significantly (). Thus, the WSOC/OC ratio was as low as 0.09, suggesting that most of the carbonaceous aerosol was fresh primary OC. Additionally, the near-surface wind speed was as high as 8∼10 m sec−1 from the southeast on that day. During the fall intensive measurement period, the peak carbonaceous aerosol concentration occurred at around 9:00 a.m. on September 25. OC and EC concentrations had increased rapidly from 2.1 to 5.1 μgC m−3 and from 0.5 to 1.0 μgC m−3 in an hour, respectively (). A low WSOC/OC ratio of approximately 0.21 was recorded at that time. The combined figures of the MODIS AOT and 5-day air mass back trajectories indicated that clean air mass was transported to the sampling site from the Marine area on June 9 () and September 25 (), implying that the measured OC spikes were due to local biomass burning.
Figure 5. Air mass classification based on the cluster of HYSPLIT back trajectories at the Gosan supersite for the sampling periods of 2009.
Figure 6. The combined MODIS AOD image and 5-day backward trajectories on June 9 (a) and September 25 (b), 2009.
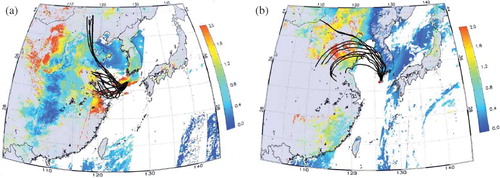
Several cases of the Continental (CC) air mass type were detected during the intensive measurement period, which caused high concentrations of carbonaceous aerosol at the Gosan supersite. The highest OC and EC concentrations of 28.38 and 8.19 μgC m−3, respectively, were observed at around 7:00 a.m. on June 13, 2009. The 5-day air mass back trajectories indicated that air mass was transported from the Continental area on that day, as shown in . It can be concluded that the observed peaks of OC and EC were caused by long-range transported pollution particles. The hourly OC and WSOC concentrations had increased gradually from 3.49 to 5.85 μgC m−3 and from to 4.57 μgC m−3, respectively, on September 18, 2009. The WSOC/OC ratio was as high as 0.68 ± 0.19, suggesting that most of the carbonaceous aerosol was “aged” OC when there was no local biomass burning. Similarly, a WSOC/OC ratio of 0.66 was found for aged air mass at a rural site in the Pearl River Delta region of China.Citation10 Air mass on that day originated from the Continental area according to the 5-day air mass back trajectories (). The combined figures of the MODIS AOT and 5-day backward trajectories clearly show that pollutants emitted from the Asian continent were transported over the Yellow Sea toward the Gosan sampling site ().
Figure 7. The combined MODIS AOD image and 5-day backward trajectories on June 13 (a) and September 18 (b), 2009.
Statistics concerning OC, WSOC, WSOC/OC, EC, and OC/EC during the Continental, Marine, East Sea, and Korean Peninsula air mass types are summarized in . On average, the highest OC and EC concentrations were measured when air mass originated from the Continental area (CC) in summer, whereas the lowest carbonaceous aerosol concentrations were observed when air mass originated from the East Sea (ES) in the fall season. The average WSOC concentration was 1.09∼1.76 μgC m−3, which did not vary significantly from that of other air mass types. This can be explained by recognizing that most of the WSOC originated from long-range transported pollution to the Gosan supersite. Scatter plots of OC and EC for different air mass types are shown in . The highest OC/EC ratio of 3.63 was observed when air mass originated from the Continental area (CC) due to long-range transported pollution. The lowest OC/EC ratio of 0.79 was measured when air mass originated from the Marine area (M).
Table 2. Statistics concerning OC, WSOC, WSOC/OC, EC, and OC/EC during the Continental, Marine, East Sea, and Korean Peninsula air mass types
Figure 8. Scatter plots of EC and OC concentrations for different air mass types (CC = dark triangle, M = open square, ES = open circle, KP = asterisk).
It is interesting to compare the OC and EC concentrations measured in this study with those of previous measurements at Gosan and other Asian sites. The lowest OC concentration was 2.16 μgC m−3 during the fall intensive monitoring period when air mass originated from the East Sea (ES-2), being comparable to that found at Penghu (OC = 2.0 μgC m−3), Taiwan,25 and which is higher than that measured at Rishiri Island (OC = 0.8 μgC m−3), Japan.Citation26 Carbonaceous aerosol concentrations, OC and EC measured for the Marine air mass type in summer were similar to those found at Cape Fuguei, which is located at the northern tip of Taiwan.Citation25 The highest EC concentration of 1.90 μgC m−3 was measured during the summer intensive period when air mass originated from the Continental area (CC-1), and is higher than values obtained in previous studies at other background sitesCitation9,Citation15,Citation25,Citation26 and lower than those obtained at urban sites of AsiaCitation27–32 ().
Figure 9. Relationship between OC and EC at background and urban sites in Asia.
Secondary OC
The EC tracer methodCitation33,Citation34 was applied to estimate the contribution of secondary organic carbon (SOC) to total OC for different air mass types.
where a × EC is combustion primary OC and b is noncombustion primary OC, i.e., mostly primary biogenic OC. Because ozone is an indicator of photochemical activity, the relationship between OC and EC concentrations with an ozone concentration <40 ppb was used to determine primary OC. Surface ozone concentration data from a collocated ambient air quality monitoring station operated by the Ministry of Environment showed clear diurnal variation with higher values in summer due to higher photochemical activities. The parameters a and bdetermined by Equationeq 2 in this study are shown in . The value of a was 1.16 for summer and 1.13 for the fall, whereas those of b were 1.46 and 1.57, respectively. The values of a were lower than those obtained at Pittsburgh (1.24∼2.64), whereas the b values were higher than those estimated at the same site (0.0∼0.66).Citation22
Table 3. SOC estimation by the EC tracer method during summer and fall seasons
The average SOC concentration as determined by the EC tracer method was 1.92 ± 2.26 μgC m−3 and 0.63 ± 0.64 μgC m−3 in the summer and fall, respectively, which respectively accounted for 30.9% and 18.2% of total OC (). To better understand the characteristics of atmospheric carbonaceous aerosol at the Gosan supersite, the contribution of secondary OC to total OC was calculated using Equationeq 1 for different air mass types. The highest contribution of 32.2% was obtained during the Continental air mass type (CC), and the lowest contribution of 8.4% was obtained when air mass originated from the Marine (M) area. Because WSOC is considered a major fraction of SOAs, the calculated SOC was compared with the observed WSOC for the different types of air mass. Outliers due to local biomass burning were excluded in this comparison. A higher correlation (R 2 = 0.74) was found when the air mass originated from the Continental area (CC-1) in summer, suggesting that the measured WSOC mainly consisted of secondary products ().
Table 4. Mean SOC (μgC m−3) and SOC/OC (%) at the Gosan supersite during summer and fall in 2009
Figure 10. Relationship between measured WSOC and calculated SOC during continental air flow in summer (dark square) and fall (open circle) seasons.
SUMMARY AND CONCLUSIONS
In order to better understand the characteristics of atmospheric carbonaceous aerosol at a background site in Northeast Asia, semicontinuous organic carbon (OC) and elemental carbon (EC), and time-resolved water-soluble organic carbon (WSOC), were measured by a Sunset OC/EC and a PILS-TOC analyzer, respectively, at the Gosan supersite on Jeju Island, Korea, in the summer (May 28–June 17) and fall (August 24–September 30) of 2009. Average contributions of EC to TC and WSOC to OC were 26.0% ± 9.7% and 20.6% ± 7.4%, and 37.6% ± 23.5% and 57.2% ± 22.2% during the summer and fall seasons, respectively. As expected, clear diurnal variation of WSOC/OC was found in the summer season, varying from 0.22 during the nighttime up to 0.72 during the daytime, mainly due to the photo-oxidation process. A high OC concentration was occasionally observed at Gosan due to local biomass burning and long-range transported pollution particles. The highest OC/EC ratio of 3.63 was observed when air mass originated from the Asian Continent, whereas the lowest OC/EC ratio of 0.79 was observed when air mass originated from the Marine area. A low WSOC/OC ratio (0.09∼0.21) was observed during local biomass burning periods in summer. However, the ratio was relatively higher (0.20∼0.30) during local biomass burning events in the fall season. Further research should be conducted to investigate specific sources of local biomass burning carbonaceous aerosol. The contribution of secondary OC as determined by the EC tracer method to total OC was estimated to vary in the range 8.4∼32.2% and depended on air mass type. On average, the highest secondary OC concentration was measured in summer when air mass originated from the Continental area (CC-1), and it correlated well (R 2 = 0.74) with the measured WSOC concentration.
ACKNOWLEDGMENTS
This work was funded by the Korea Meteorological Administration Research and Development Program under Grant RACS_2010-1002 through the Advanced Environmental Monitoring Research Center at Gwangju Institute of Science and Technology. It was also supported by the National Research Foundation of Korea (NRF) grant funded by the Korean government (MEST) (Project No. 2008-0060618).
REFERENCES
- Chow , J.C. , Watson , J.G. , Lu , Z. , Lowenthal , D.H. , Frazier , C.A. , Solomon , P.A. , Thuillier , R.H. and Magliano , K. 1996 . Descriptive analysis of PM2.5 and PM10 at regionally representative locations during SJVAQS/AUSPEX . Atmos. Environ , 30 : 2079 – 2112 .
- Park , S.S. , Kim , Y.J. and Fung , K. 2002 . PM2.5 carbon measurements in two urban areas: Seoul and Kwangju, Korea . Atmos. Environ , 36 : 1287 – 1297 .
- Kim , Y.J. , Kim , M.J. , Lee , K.H. and Park , S. S. 2006 . Investigation of carbon pollution episodes using semi-continuous instrument in Incheon, Korea . Atmos. Environ , 40 : 4064 – 4075 .
- Ramanathan , V. , Crutzen , P.J. , Kiehl , J.T. and Rosenfeld , D. 2001 . Aerosols, Climate, and the Hydrological Cycle . Science , 294 : 2119 – 2124 .
- Mauderly , J. L. and Chow , J.C . 2008 . Health Effects of Organic Aerosols . Inhal. Toxicol , 20 : 257 – 288 .
- Seinfeld , J.H. and Pandis , S.N. 1998-1225 . Atmospheric Chemistry and Physics , New York : John Wiley & Sons .
- Sullivan , A. P. , Peltier , R. E. , Brock , C. A. , de Gouw , J. A. , Holloway , J. S. , Warneke , C. , Wollny , A. G. and Weber , R. J. 2006 . Airborne measurements of carbonaceous aerosol soluble in water over northeastern United States: Method development and an investigation into water-soluble organic carbon sources . J. Geophys. Res , 111 : D23S46 – D23S46 . 14
- Sullivan , A. P. , Weber , R. J. , Clements , A. L. , Turner , J. R. , Bae , M. S. and Schauer , J. J. 2004 . A method for on-line measurement of water-soluble organic carbon in ambient aerosol particles: Results from an urban site . Geophys. Res. Lett , 31 : L13105 – L13105 . 4
- Miyazaki , Y. , Kondo , Y. , Han , S. , Koike , M. , Kodama , D. , Komazaki , Y. , Tanimoto , H. and Matsueda , H. 2007 . Chemical characteristics of water-soluble organic carbon in the Asian outflow . J. Geophys. Res , 112 : D22S30 – D22S30 . 18
- Miyazaki , Y. , Kondo , Y. , Shiraiwa , M. , Takegawa , N. , Miyakawa , T. , Han , S. , Kita , K. , Hu , M. , Deng , Z. Q. , Zhao , Y. , Sugimoto , N. , Blake , D. R. and Weber , R. J. 2009 . Chemical characterization of water-soluble organic carbon aerosols at a rural site in the Pearl River Delta, China, in the summer of 2006 . J. Geophys. Res , 114 : D14208 – D14208 . 13
- Huebert , B. J. , Bates , T. , Russell , P. B. , Shi , G. , Kim , Y. J. , Kawamura , K. , Carmichael , G. and Nakajima , T. 2003 . An overview of ACE-Asia: Strategies for quantifying the relationships between Asian aerosols and their climatic impacts . J. Geophys. Res , 108 : 8633 – D23 . 1 – 20 .
- Kim , K. W. , He , Z. and Kim , Y. J. 2004 . Physicochemical characteristics and radiative properties of Asian dust particles observed at Kwangju, Korea, during the 2001 ACE-Asia intensive observation period . J. Geophys. Res , 109 : D19S02 – D19S02 . 15
- Nakajima , T. , Yoon , S.-C. , Ramanathan , V. , Shi , G.-Y. , Takemura , T. , Higurashi , A. , Takamura , T. , Aoki , K. , Sohn , B.-J. , Kim , S.-W. , Tsuruta , H. , Sugimoto , N. , Shimizu , A. , Tanimoto , H. , Sawa , Y. , Lin , N.-H. , Lee , C.-T. , Goto , D. and Schutgens , N. 2007 . Overview of the Atmospheric Brown Cloud East Asian Regional Experiment 2005 and a study of the aerosol direct radiative forcing in east Asia . J. Geophys. Res , 112 : D24S91 – D24S91 . 23
- Mader , B.T. , Yu , J.Z. , Xu , J.H. , Li , Q.F. , Wu , W.S. , Flagan , R.C. and Seinfeld , J.H. 2004 . Molecular composition of the water-soluble fraction of atmospheric carbonaceous aerosols collected during ACE-Asia . J. Geophys. Res. , 109 : D062606 – D06206 . 13
- Han , J. , Moon , K. , Kong , B. , Lee , S. , Kim , J. and Kim , Y. 2005 . Seasonal Variation of Chemical Composition in Fine Particles at Gosan, Korea . Environ. Monit. Assess , 107 : 221 – 237 .
- Moon , K. J. , Han , J. S. , Ghim , Y. S. and Kim , Y. J. 2008 . Source apportionment of fine carbonaceous particles by positive matrix factorization at Gosan background site in East Asia . Environ. Int , 34 : 654 – 664 .
- Birch , M. E. and Cary , R.A . 1996 . Elemental carbon-based method for monitoring occupational exposures to particulate diesel exhaust . Aerosol Sci. Technol , 25 : 221 – 241 .
- Jung , J. , Kim , Y. J. , Lee , K. Y. , Cayetano , M. G. , Batmunkh , T. , Koo , J.-H. and Kim , J. 2010 . Spectral optical properties of long-range transport Asian dust and pollution aerosols over Northeast Asia in 2007 and 2008 . Atmos. Chem. Phys , 10 : 5391 – 5408 .
- Turpin , B. J. , Saxena , P. and Andrews , E. 2000 . Measuring and simulating particulate organics in the atmosphere: problems and prospects . Atmos. Environ , 34 : 2983 – 3013 .
- Elemental Carbon (diesel exnaust) NIOSH Manual of Analytical Methods , NIOSH. 1996 . , 4th , Cincinnati , OH : National Institute of Occupational Safety and Health .
- Schauer , J. J. , Mader , B. T. , DeMinter , J. T. , Heidemann , G. , Bae , M. S. , Seinfeld , J. H. , Flagan , R. C. , Cary , R. A. , Smith , D. , Huebert , B. J. , Bertram , T. , Howell , S. , Kline , J. T. , Quinn , P. , Bates , T. , Turpin , B. , Lim , H. J. , Yu , J. Z. , Yang , H. and Keywood , M. D. 2003 . ACE-Asia Intercomparison of a Thermal-Optical Method for the Determination of Particle-Phase Organic and Elemental Carbon . Environ. Sci. Technol , 37 : 993 – 1001 .
- Polidori , A. , Turpin , B. J. , Lim , H.-J. , Cabada , J. C. , Subramanian , R. , Pandis , S. N. and Robinson , A. L. 2006 . Local and Regional Secondary Organic Aerosol: Insights from a Year of Semi-Continuous Carbon Measurements at Pittsburgh . Aerosol Sci. Technol , 40 : 861 – 872 .
- HYSPLIT (HYbrid Single-Particle Lagrangian Integrated Trajectory) Model; Draxler, R. R. Rolph, G.D., Eds.; NOAA Air Resources Laboratory: Silver Spring, MD, 2011. NOAA ARL READY Web site http://ready.arl.noaa.gov/HYSPLIT.php (http://ready.arl.noaa.gov/HYSPLIT.php)
- Lee , K. H. , Kim , Y. J. , von Hoyningen-Huene , W. and Burrow , J. P. 2007 . Spatio-temporal variability of satellite-derived aerosol optical thickness over Northeast Asia in 2004 . Atmos. Environ , 41 : 3959 – 3973 .
- Chou , C. C.-K. , Lee , C. T. , Cheng , M. T. , Yuan , C. S. , Chen , S. J. , Wu , Y. L. , Hsu , W. C. , Lung , S. C. , Hsu , S. C. , Lin , C. Y. and Liu , S. C . 2010 . Seasonal variations and spatial distribution of carbonaceous aerosols in Taiwan . Atmos. Chem. Phys. Discuss , 10 : 9563 – 9578 .
- Matsumoto , K. , Uyama , Y. , Hayano , T. , Tanimoto , H. , Uno , I. and Uematsu , M. 2003 . Chemical properties and outflow patterns of anthropogenic and dust particles on Rishiri Island during the Asian Pacific Regional Aerosol Characterization Experiment (ACE-Asia) . J. Geophys. Res , 108 : 8666 – D23 . 34 – 15 .
- Park , S. S. , Bae , M. S. , Schauer , J. J. , Ryu , S. Y. , Kim , Y. J. , Yong Cho , S. and Kim , S. J. 2005 . Evaluation of the TMO and TOT methods for OC and EC measurements and their characteristics in PM2.5 at an urban site of Korea during ACE-Asia . Atmos. Environ , 39 : 5101 – 5112 .
- Kim , H.-S. , Huh , J.-B. , Hopke , P. K. , Holsen , T. M. and Yi , S.-M. 2007 . Characteristics of the major chemical constituents of PM2.5 and smog events in Seoul, Korea in 2003 and 2004 . Atmos. Environ , 41 : 6762 – 6770 .
- Lin , P. , Hu , M. , Deng , Z. , Slanina , J. , Han , S. , Kondo , Y. , Takegawa , N. , Miyazaki , Y. , Zhao , Y. and Sugimoto , N. 2009 . Seasonal and diurnal variations of organic carbon in PM2.5 in Beijing and the estimation of secondary organic carbon . J. Geophys. Res , 114 : D00G11 – D00G11 . 14
- Han , S. , Kondo , Y. , Oshima , N. , Takegawa , N. , Miyazaki , Y. , Hu , M. , Lin , P. , Deng , Z. , Zhao , Y. , Sugimoto , N. and Wu , Y. 2009 . Temporal variations of elemental carbon in Beijing . J. Geophys. Res , 114 : D23202 – D23202 . 16
- Jung , J. , Lee , H. , Kim , Y. J. , Liu , X. , Zhang , Y. , Hu , M. and Sugimoto , N. 2009 . Optical properties of atmospheric aerosols obtained by in situ and remote measurements during 2006 Campaign of Air Quality Research in Beijing (CAREBeijing-2006) . J. Geophys. Res , 114 : D00G02 – D00G02 . 18
- Jung , J. , Lee , H. , Kim , Y. J. , Liu , X. , Zhang , Y. , Gu , J. and Fan , S. 2009 . Aerosol chemistry and the effect of aerosol water content on visibility impairment and radiative forcing in Guangzhou during the 2006 Pearl River Delta campaign . J. Environ. Manage , 90 : 3231 – 3244 .
- Cabada , J. C. , Pandis , S. N. , Subramanian , R. , Robinson , A. L. , Polidori , A. and Turpin , B. 2004 . Estimating the Secondary Organic Aerosol Contribution to PM2.5 Using the EC Tracer Method . Aerosol Sci. Technol , 38 : 140 – 155 .
- Turpin , B. J. and Huntzicker , J. J. 1995 . Identification of secondary organic aerosol episodes and quantitation of primary and secondary organic aerosol concentrations during SCAQS . Atmos. Environ , 29 : 3527 – 3544 .