ABSTRACT
Chemical mass balance (CMB) and trajectory receptor models were applied to speciated particulate matter with aerodynamic diameter ≤2.5 μm (PM2.5) measurements from Speciation Trends Network (STN; part of the Chemical Speciation Network [CSN]) and Interagency Monitoring of Protected Visual Environments (IMPROVE) monitoring network across the state of Minnesota as part of the Minnesota PM2.5 Source Apportionment Study (MPSAS). CMB equations were solved by the Unmix, positive matrix factorization (PMF), and effective variance (EV) methods, giving collective source contribution and uncertainty estimates. Geological source profiles developed from local dust materials were either incorporated into the EV-CMB model or used to verify factors derived from Unmix and PMF. Common sources include soil dust, calcium (Ca)-rich dust, diesel and gasoline vehicle exhausts, biomass burning, secondary sulfate, and secondary nitrate. Secondary sulfate and nitrate aerosols dominate PM2.5 mass (50–69%). Mobile sources outweigh area sources at urban sites, and vice versa at rural sites due to traffic emissions. Gasoline and diesel contributions can be separated using data from the STN, despite significant uncertainties. Major differences between MPSAS and earlier studies on similar environments appear to be the type and magnitude of stationary sources, but these sources are generally minor (<7%) in this and other studies. Ensemble back-trajectory analysis shows that the lower Midwestern states are the predominant source region for secondary ammoniated sulfate in Minnesota. It also suggests substantial contributions of biomass burning and soil dust from out-of-state on occasions, although a quantitative separation of local and regional contributions was not achieved in the current study.
Supplemental materials are available for this article. Go to the publisher's online edition of the Journal of the Air & Waste Management Association for a summary of input data, Unmix and PMF factor profiles, and additional maps.
The IMPROVE and STN data have been widely used for source apportionment by receptor models. Applying more than one model to available PM2.5 data reveals similarities and differences in source contribution estimates. The inter-model discrepancies identify areas for more focused investigation. Together, the information could lead to better-defined emission reduction strategies.
INTRODUCTION
The state of Minnesota currently attains National Ambient Air Quality Standards (NAAQS)Citation1,Citation2 for carbon monoxide (CO), sulfur dioxide (SO2), nitrogen dioxide (NO2), ozone (O3), PM10 (particulate matter with aerodynamic diameters <10 μm), and PM2.5 (particulate matter with aerodynamic diameters <2.5 μm). However, enhanced ambient monitoring and a more stringent Minnesota Air Quality Index (AQI) indicates an increase in days classified as “moderate” and “unhealthy” for sensitive groups in Minnesota since 2000.Citation3 The AQI is affected mainly by O3 and PM2.5 concentrations. The 24-hr PM2.5 NAAQS is 35 μg/m3 (98th percentile over 3 years) and the annual average NAAQS is 15 μg/m3 (spatial average over 3 years),Citation4 based on public health criteria.Citation5–7 Dominici et al.Citation8 detected relationships between PM and mortality in the Twin Cities, despite the NAAQS attainment. The Minnesota PM2.5 Source Apportionment Study (MPSAS) was undertaken to identify and quantify PM2.5 source contributions via a weight-of-evidence (WOE) approach by applying receptor models to existing chemically speciated PM2.5 measurements.
Receptor models infer source contributions and atmospheric processes from air quality and meteorological measurements.Citation9–22 Receptor models complement, rather than replace, source-oriented dispersion and chemical transformation models that begin with source emission rates to estimate ambient concentrations.Citation23,Citation24 Both source and receptor models are mathematical representations of reality, requiring simplifying assumptions that create uncertainty. Receptor model assumptions include (1) source profiles are constant over the period of ambient and source sampling; (2) chemical species do not react with each other; (3) the number of sources or source categories is less than or equal to the number of species measured; and (4) measurement uncertainties are random, uncorrelated, and normally distributed. Source models assume a reasonable accuracy for source emissions, air movement, and physical and chemical processes. Source contribution estimates (SCEs) from different models may disagree. A WOE approachCitation25 considers the results and uncertainties of individual methods and reconciles their differences to determine the most plausible range of SCEs. WOE adds confidence to source apportionment and regulatory strategies that are based on it.Citation17,Citation18
MPSAS used chemically speciated PM2.5 measurements from eight urban and rural monitoring sites across the state, applied effective variance (EV), Unmix, and positive matrix factorization (PMF) solutions for the chemical mass balance (CMB) receptor model, estimated source regions using back trajectories, and evaluated uncertainties for local and regional PM2.5 source contributions.Citation26 Methods for reconciling the measurements among networks and the EV-CMB SCEs have been described by Chen et al.Citation27 As part of the WOE approach, this paper documents Unmix, PMF, and trajectory-based analyses and reports reconciliation among the different model results.
RECEPTOR MODELING METHODS
Ambient Data and Source Profiles
The Speciation Trends Network (STN; part of the Chemical Speciation Network [CSN])Citation28 was established in 1999 to monitor urban-scale community exposure to PM2.5. STN has operated four sites in Minnesota, including two (Minneapolis—Phillips Neighborhood [MPN] and St. Paul—Harding High School [SPH]) in the Twin Cities, one in Rochester (ROC), and one at Mille Lacs (ML). MPN, SPH, and ROC are considered urban sites. The ML site is classified as nonurban, as it is located on nonurban tribal lands within 0.1 km of Mille Lacs Lake, a popular tourist attraction. Four Interagency Monitoring of Protected Visual Environments (IMPROVE)Citation29,Citation30 sites are located in remote areas in the north (Voyageurs National Park [VOYA]), northeast (Boundary Waters Canoe Area [BOWA]), southwest (Blue Mounds State Park [BLMO]), and southeast (Great River Bluffs State Park [GRRI]) corners of the state (). Chen et al.Citation27 described these sites in greater detail.
Figure 1. STN and IMPROVE PM2.5 chemical speciation sites in Minnesota. The STN sites are (1) Mille Lacs (ML), (2) Minneapolis—Phillips Neighborhood (MPN), (3) St. Paul—Harding High School (SPH), and (4) Rochester (ROC). The IMPROVE sites are (1) Voyageurs National Park (VOYA), (2) Boundary Waters Canoe Area (BOWA), (3) Blue Mounds State Park (BLMO), and (4) Great River Bluffs State Park (GRRI).
STN and IMPROVE measure 24-hr PM2.5 mass, elements, ions, organic carbon (OC), and elemental carbon (EC). The networks differ, however, in sampling frequency, measured species, analytical methods, and compensation for passive deposition and organic sampling artifacts.Citation31,Citation32 Particularly, IMPROVE OC and EC are quantified by the thermal optical reflectance (TOR) method, whereas STN OC and EC were measured by the thermal optical transmittance (TOT) method prior to 2007.Citation33 For this study, field blank values were retrieved and subtracted from the STN data and errors were propagated to estimate STN uncertainties that were not available prior to July 15, 2003. A criterion based on material balance screened out IMPROVE and STN data with poor mass closure.Citation27 MPSAS analyzed data acquired between 2000 and 2006, which had the largest number of simultaneous samples across the eight sites. Table S1 (Supporting Information) summarizes the average and signal-to-noise ratios (SNRs) for PM2.5 mass and chemical concentrations by site.
Region-specific geological source profiles were measured by grab sampling and resuspension,Citation34 as reported by Chen et al.,Citation27 for (1) native soil dust; (2) paved road dust; (3) deicing material; (4) ready-mix concrete plant trackout; and (5) taconite ore and dust. TaconiteCitation35 is an iron ore mined primarily in northern Minnesota. The geological materials share common markers such as silicon (Si), aluminum (Al), calcium (Ca), and iron (Fe). Ca and Fe are particularly enriched in concrete plant trackout and taconite dust, respectively. Because in-state source profiles for gasoline vehicle, diesel vehicle, residential wood combustion (RWC), wildfire, coal-fired utility plant, and other emissions were not available, those from other studiesCitation36–38 and archived by U.S. Environmental Protection Agency (EPA)Citation39 were used. Secondary sulfate, secondary nitrate, and secondary organic carbon (SOC) were represented by their components in proportion to the stoichiometric ratios, that is, ammonium nitrate (NH4NO3), ammonium sulfate ([NH4]2SO4), ammonium bisulfate ([NH4]HSO4), and organic matter (OM), in EV-CMB modeling.Citation27
Unmix and PMF Receptor Modeling
UnmixCitation40,Citation41 and PMFCitation42,Citation43 solve the CMB equationsCitation44 by identifying source-related “factors” in the data set. Practically, non-negative factor loadings and scores are derived and interpreted as source profiles and source contributions, respectively. Although measured source profiles are not used as inputs to Unmix and PMF, measured profiles are needed to justify the assignment of a source factor to a source type. There is no guarantee that mathematically derived Unmix and PMF factors represent real sources; they often appear to be mixtures of source types that have correlated SCEs in space and or time.Citation22 A needed demonstration of any Unmix or PMF application is that at least one measured source profile can be reasonably associated with each derived source factor.Citation16,Citation21 Unmix and PMF typically require large ambient data sets, for example, more than 100 samples distributed across time and space, for which the underlying source profiles are relatively constant and for which there is large independent variability among actual source contributions. Comparison of source contributions from the EV, Unmix, and PMF CMB solutions provides evidence of the extent to which these assumptions are complied with for a given application.
Ambient data sets used here are identical to those of Chen et al.,Citation27 but they were divided into five groups for Unmix and PMF receptor modeling (). STN and IMPROVE data were analyzed separately due to the different variables measured and precision estimates. Data from the four STN sites were analyzed together owing to their proximity (<250 km apart) and similar source types. Transport and mixing from one site to another could occur within several hours where PM2.5 source profiles are likely to remain the same. STN data were separated into post- and pre-July 15, 2003, periods to minimize the effects of changes in STN sampling and analysis protocols that occurred on July 15, 2003.Citation45,Citation46 It provides an opportunity to examine the robustness of Unmix and PMF solutions under changing measurement methods.
Table 1. Data Groupings for Unmix and PMF model inputs. Footnote*
IMPROVE BLMO and GRRI sites are distant from each other and from BOWA and VOYA; they probably have different source influences, and so their data were modeled separately. Data from BOWA and VOYA were pooled because of their proximity and common exposure to regional sources in the northern part of the state. The number of valid samples ranges from 229 to 872 among the five groups of data. Sample elimination from BLMO, BOWA, and VOYA resulted mostly from incomplete measurements where either Teflon-membrane or quartz-fiber filters were missing. The missing data are random in nature, as PM2.5 concentrations and EV-CMB source contributions are consistent between the overall and annual periods.Citation27 PM2.5 loadings ranged from 0.1 to 59 μg/m3 with higher PM2.5 concentrations found at the urban sites.
Uncertainty weighting coefficients are not required by Unmix software, but they are required inputs for PMF software.Citation47 Among all combinations of species and number of factors that provided Unmix solutions, results were sought that (1) maximized the number of species; (2) maximized the number of factors; and (3) contained the fewest low-SNR species. These combinations were also analyzed by PMF using the inverse analytical precisions of ambient concentrations as weighting coefficients. In subsequent tests, additional species were included and the number of factors was adjusted (−2 to +2) in PMF, as suggested by Reff et al.,Citation48 to achieve source factors that are best associated with measured source profiles. Other criteria for selecting the optimal solutions included consistencies of overall, seasonal, and daily SCEs among Unmix, PMF, and EV-CMB results and of source types in the Minnesota emissions inventory and emission-based conceptual model.Citation27 Potential source regions were further verified by the ensemble air parcel back trajectories (EBTs).
Back-Trajectory Analysis
EBT methods infer source regions associated with different SCE levels based on air mass history represented by backward air mass trajectories.Citation49,Citation50 Receptor–source relationships are represented by the time spent in the respective source grid cell (i, j) by air parcels numerically released from the receptor location and advected backwards in time. For air parcels associated with a particular sample period t, the residence time probability is calculated by
(N: total number of samples) reveals areas that are likely to contain sources contributing to the species or factor.Citation51
The Hybrid Single Particle Lagrangian Integrated Trajectory (HYSPLIT) modelCitation52 calculated EBTs for each monitoring site using the National Oceanic and Atmospheric Administration (NOAA) Eta (now called North American Mesoscale) Data Assimilation System (EDAS) meteorological data (http://www.arl.noaa.gov/ss/transport/archives.html) with a spatial resolution of 80 km. For each 24-hr sample, 8-day back trajectories were calculated every 3 hr with a starting height of 500 m above ground level. Hourly trajectory endpoints, up to 1536 per day, were reported. Residence times are calculated for every 1° by 1° cell in the modeling domain by summing the number of endpoints that falls within the grid cell.Citation20,Citation53
RESULTS AND DISCUSSION
Multiple Unmix and PMF solutions for each of the five data groups were obtainedCitation26 with the most interpretable results summarized in Table S2 (Supporting Information). Unmix and PMF resolved seven common factors (i.e., soil dust, calcium [Ca]-rich dust, diesel and gasoline vehicle exhausts, biomass burning, secondary sulfate, and secondary nitrate) for the Group I and II STN data. A bromine (Br) factor that could not be associated with any source type came out of Group I data. A more reasonable factor emerged from the Group II data that was associated with a road salt deicing profile. The common factors for IMPROVE sites included soil dust, Ca-rich dust, mobile emission, biomass burning, and secondary nitrate. Unmix and PMF resolved separate coal-fired boiler and secondary sulfate factors for the BLMO data set but a mixed factor in other IMPROVE data sets. Factors that could be associated with road salt and taconite dust profiles only emerged at the BOWA and VOYA receptors.
Comparability of Source and Factor Profiles
Minnesota soil/dust profiles are pretty consistent with respect to important markers such as OC, Si, potassium (K), Ca, titanium (Ti), and Fe (). The MPN soil dust profile (MPNSoil), a composite of soil material collected around MPN, contains the lowest carbon abundance (7.6% ± 0.6%) and the highest Si (14.4% ± 1.0%) abundance among all the Minnesota dust profiles, corroborating with soil that has minimal impacts from deposited engine exhaust. High S, NO3 −, and NH4 + fractions in a freeway dust profile (HwayDust) might result in part from deposition of background aerosol. The Ca abundance of 9.4% ± 0.7% for the ROC road dust profile (ROCDust) is much higher than the 3.9–5.9% abundances in the other profiles, consistent with a limestone-rich soil in southeastern Minnesota. Trackout from a ready-mix concrete plant near SPH (MNCal) shows an even higher Ca abundance of 19.9% ± 1.4% (), similar to the abundances found in cement kiln emissions.Citation37 Fe is the dominant component (33–51%) in the taconite dust profiles (MNTac1 and MnTac2), followed by OC, Si, Ca, and manganese (Mn) (). The Mn fraction is higher in taconite (0.3–0.7%) than in other geological materials (<0.2%).
Figure 2. Comparison of PMF geological factors with measured geological source profiles: (a) soil dust, (b) Ca-rich dust, and (c) taconite dust. Error bars in part c (not shown in parts a and b) represent the boot-strapping uncertainties for the Group I taconite factor calculated by PMF. See for modeling groups I–V. OCR and ECR indicate OC and EC measured by TOR, whereas OCT and ECT indicate OC and EC measured by TOT.
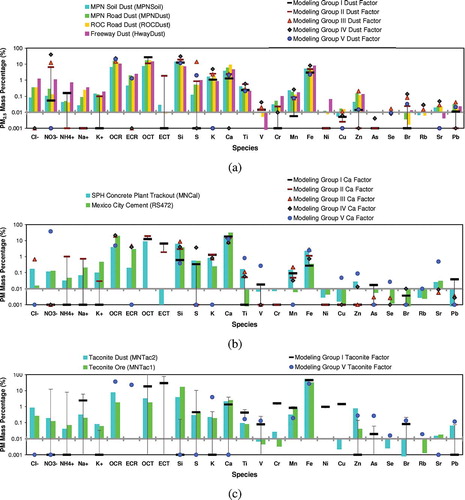
The PMF geological factors, that is, soil dust, Ca-rich dust, and taconite, derived from the post-July 15, 2003, STN data show the best agreement with the MPNSoil, MNCal, and MNTac2 profiles in terms of major marker species (i.e., Si for soil dust, Ca for Ca-rich dust, and Fe for taconite; –c). Corresponding factors from the pre-July 15, 2003, data also agree for these markers within reported uncertainties. The geological source factors and measured source profiles differ with respect to several trace elements such as Ni, Cu, As and Se that have minor abundances. These elements are often variable within a fugitive dust source category.Citation54,Citation55 The BOWA-VOYA data yield the only IMPROVE taconite factor, consistent with the Fe and Mn abundances in MNTac2 and the sites' proximity to taconite processing facilities (e.g., U.S. Steel Corp. Minntac at Mt. Iron; see Watson et al.Citation46). There is more variability among the three IMPROVE Ca-dust factors, with their Ca fractions ranging from 7.5% to 12.2%, lower than those of STN Ca factors (13.9–18.0%). The BOWA-VOYA Ca factor contains higher abundances of Ti, V, Cu, Zn, Se, and Sr than those of the MNCal profile, implying that (1) the mixture of crustal contributions differs from those measured and/or (2) several source types are collinear for these elements ().
Combustion sources such as gasoline exhaust, diesel exhaust, and biomass smoke contain higher OC and EC abundances than those in the geological profiles (–c). OC and EC by themselves are insufficient to distinguish among the combustion sources.Citation56,Citation57 Both the post- and pre-July 15, 2003, STN data yield, via PMF, a high OC (40.3–64.9%) and low EC (0–1.6%) factors that also contains K abundances of 6.4–6.8% (). This K abundance is similar to that of the Big Bend Regional Aerosol Visibility and Observational (BRAVO) study open burning (BVBURN; 5.7%) profile. The EC/OC ratio in the BVBURN profile (measured by the IMPROVE TOR method) appears to be higher (i.e., 0.24 compared to <0.03 for the biomass burning factors), though this in part reflects different OC–EC splits made by TOR and TOT. Two other factors dominated by OC and EC have lower K contents (<1.6%) and are assigned to gasoline and diesel engine exhaust (–b). The diesel factor has an EC/OC ratio (0.27–0.54 by TOT) higher than that of the gasoline factor (0.13–0.14 by TOT). Higher Fe, Zn, Br, and Pb abundances are associated with the diesel factor, despite their low abundances in measured diesel profiles (LVOnRDIE, NWHDc, and PHDIES; –b). The diesel factor may be influenced by resuspended road dust and tire/brake wear that are not included in engine exhaust samples. The IMPROVE data yield only gasoline and biomass burning factors. The EC/OC ratio (by TOR) ranges from 0.34 to 0.48 for gasoline vehicle exhaust and from 0.16 to 0.20 for biomass burning smoke. Higher Zn and Pb fractions in these IMPROVE gasoline factors may indicate a blend of gasoline and diesel exhaust contributions.
Figure 3. Comparison of PMF combustion factors with measured combustion source profiles: (a) gasoline vehicle, (b) diesel vehicle, and (c) biomass burning (BB). See for modeling groups I–V.
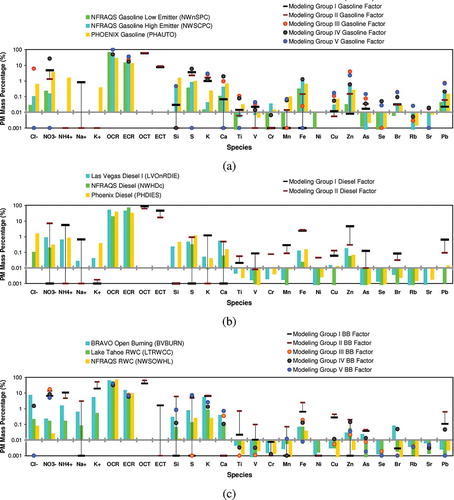
Road salt factors were identified by water-soluble Na+ (STN) and Cl− (IMPROVE) markers. The Na+ and Cl− abundances in the two salt factors (Groups II and V) are 32.9% and 7.4%, respectively. The only standalone coal factor resolved by PMF was at BLMO, and it features Se and S abundances of 0.1% and 12.0%, respectively. The Se/S ratios in the secondary sulfate factors for BLMO, GRRI, and BOWA-VOYA are much lower. Coal-burning contributions were not separated for GRRI, BOWA-VOYA, and STN sites, likely due to insufficient SNR of the marker species for PMF analysis, not because the coal combustion contribution was absent. Ideally, secondary sulfate and secondary nitrate factors contain only the secondary inorganic species, such as sulfate, bisulfate, nitrate, and ammonium, but this is seldom achieved for PMF source factors.Citation22 In this study, the secondary inorganic aerosol factors also contain OC, and EC as well as trace elements at low levels (see Supporting Information).
Unmix factors are presented in the Supporting Information. These factors contain fewer species than the PMF factors and some differ from the PMF factors with respect to common species. However, reasonable temporal correlations (r 2 > 0.7) were achieved between the Unmix factors and their counterpart PMF factors.
Source Contribution Estimates
Average SCEs from PMF, Unmix, and EV-CMB solutions are compared in and for the Group I and Group II data, respectively. Individual factors and source types are grouped into categories of (1) secondary, (2) stationary, (3) area, and (4) mobile sources according to U.S. EPA definitions.Citation58 The secondary sulfate and nitrate contributions dominate in most cases, followed in sequence by the mobile-source (a close one at MPN and SPH by EV-CMB), area-source, and stationary-source contributions.
Table 2. SCEs (in μg/m3) by source type, site, and receptor model for STN sites after July 15, 2003 (modeling group I)
Table 3. SCEs (in μg/m3) by source type, site, and receptor model for STN sites before July 15, 2003 (modeling group II)
PMF and Unmix estimate the lowest and highest secondary source contributions, respectively, mainly due to differences in secondary nitrate. Taconite dust is the only stationary source identified by PMF and Unmix. PMF and EV-CMB estimate similar, though negligible, taconite contributions (0.04–0.09 μg/m3) for the post-July 15, 2003, period. Before July 15, 2003, only EV-CMB resolved a taconite contribution at 0.02–0.08 μg/m3. The PMF taconite factors could contain both dust and stack emissions, but they are still comparable to the measured taconite dust profile (MNTac2).
All three solutions estimate similar area source contributions post July 15, 2003 (), but the dust and biomass burning fractions differ among the solutions. EV-CMB estimates higher biomass burning contributions than the other two solutions for the pre-July 15, 2003, period, whereas the soil dust SCEs appear to be consistent among the three models (). Much higher salt SCEs are reported by PMF and EV-CMB for the pre-July 15, 2003, period (i.e., 0.25–0.60 μg/m3 compared to 0.08–0.13 μg/m3 post July 15, 2003). A known contamination during STN sample analysis might have resulted in biased Na+ concentrations and salt SCEs prior to July 2003.Citation45
For the mobile source category, PMF and Unmix solutions yield higher gasoline exhaust SCEs than diesel exhaust SCEs, whereas the EV-CMB finds the opposite. This disparity is most apparent at MPN, SPH, and ROC after July 15, 2003 (). The sum of all EV-CMB source contributions exceeds 115% of measured PM2.5 mass at MPN and SPH. When compared source by source with the PMF/Unmix solutions, most of the excess mass in EV-CMB SCEs is attributed to larger mobile source contributions. Although the STN data were blank-corrected, the correction could be insufficient to compensate for the organic sampling artifacts at the urban sites.Citation31 EV-CMB possibly attributes the organic sampling artifact to mobile, biomass burning, and/or SOC sources that contain large OC abundances. In addition, the mismatch between OC–EC splits in ambient data (by the STN TOT protocol) and in source profiles (by the IMPROVE TOR protocol) influences the diesel SCEs, as EC is the key marker for diesel emissions.Citation27 The PMF and Unmix achieve better mass closure in terms of factor contributions ( and ) because PM2.5 mass is fitted directly by these solutions, whereas PM2.5 is a floating species in the EV-CMB solution. As a result, reproduction of the PM2.5 mass is almost guaranteed by PMF and Unmix solutions and is not a stringent performance measure.
shows the SCEs for IMPROVE sites (Groups III–V). All three solutions show larger area source contributions than mobile source contributions, consistent with minimal on-road traffic near the sites. The area source SCEs are consistent across solutions (within ±20%) for BOWA, VOYA, and BLMO, though PMF and Unmix attribute less of the area source PM2.5 to biomass burning than does the EV-CMB solution. At GRRI, the Unmix area source contribution (0.58 μg/m3) is much lower than the PMF or EV-CMB SCEs, whereas PMF and EV-CMB results differ only in the Ca-rich dust contribution (). EV-CMB reports negligible Ca-rich dust (<0.06 μg/m3) SCEs at the IMPROVE sites and attributes Ca mostly to the coal-fired boiler source. PMF and Unmix resolve the coal-fired boiler source at BLMO; for other sites, however, the coal combustion contribution might be embedded in the secondary sulfate factor. There are also inconsistencies with respect to the mobile source contributions. Except for GRRI, PMF reports mobile SCEs of ∼0.1 μg/m3, compared to SCEs of ∼0.3 μg/m3 by EV-CMB. PMF and EV-CMB mobile SCEs agree better at GRRI (0.53 vs. 0.62 μg/m3). Unmix mobile SCEs are similar to PMF values for BOWA and VOYA but are similar to EV-CMB values for BLMO and GRRI ().
Table 4. SCEs (in μg/m3) by source type, site, and receptor model for IMPROVE sites (modeling groups V, III, and IV)
Unlike those at urban STN sites, the sum of all IMPROVE EV-CMB source contributions agrees with measured PM2.5 concentration within ±3%. For IMPROVE sites, ambient and source profile OC and EC were measured by the same IMPROVE TOR protocol. Diesel contributions, which might be overestimated by EV-CMB for the STN sites, are not detected at the IMPROVE sites. The IMPROVE network corrects the organic sampling artifacts with backup filtersCitation31 that show larger OC areal densities than the 15-min duration field blanks used for STN data. SOC is a minor (0.01–0.04 μg/m3) contributor at the IMPROVE sites compared to SOC contributions at the STN sites (0.12–0.37 μg/m3), which might be due to an uncompensated OC artifact.
Reconciled Source Attribution for Urban and Rural Areas
From the WOE viewpoint, fractional source contributions (FSCs) for “urban” and “rural” areas of Minnesota may be best estimated by the mean or median FSCs across STN and IMPROVE sites, respectively, and among PMF, Unmix, and EV-CMB results (). Uncertainties of the urban and rural FSCs are then determined from the 10th and 90th percentiles of all (4–12) estimates. These mean FSCs sum to a good mass closure, that is, 105–109% (see ). –b confirms a similar source apportionment between post- and pre-July 15, 2003, STN data, with larger differences for taconite dust (1–3%), salt (1–4%), and gasoline (16–21%) contributions. Chow et al.Citation56 suggested difficulties in determining the gasoline-diesel split accurately without organic marker compounds. Overall mobile FSCs (gasoline + diesel) are found more consistent at 29–34%. The average mobile FSC is only 4% of PM2.5 at the nonurban IMPROVE sites where secondary sulfate and biomass burning fractions are higher (). The higher biomass burning contribution at IMPROVE sites (i.e., averaged 13%) may be due to prolonged smoldering emissions from wild or prescribed fires.Citation59,Citation60
Table 5. FSCs (% of PM2.5) from this study compared with those from similar environments
Figure 4. Model-collective estimates (i.e., square and number: average; bar: median; box: 10th and 90th percentiles) of fractional source contributions (FSCs) for (a) STN sites after July 15, 2003; (b) STN sites prior to July 15, 2003; and (c) IMPROVE sites.
This is the first use of available Minnesota data for statewide PM2.5 source apportionment, so opportunities for comparison with other studies are limited. Receptor modeling, especially PMF, has been applied to several Midwestern STN sites, including Detroit and Chicago,Citation61–63 and rural IMPROVE sites at Bondville (BOND), Illinois, and Mammoth Cave National Park (MACA) in KentuckyCitation61,Citation64 (see Figure S1 in Supporting Information), and these are compared with the Minnesota SCEs in . The Detroit and Chicago sites are located in the upper Midwest and likely influenced by sources similar to those affecting MPN and SPH. Buzcu-Guven et al.Citation61 and Gildemeister et al.Citation62 resolved eight factors for Detroit, including regional sources such as secondary sulfate, secondary nitrate, soil dust, biomass burning, and mobile sources (gasoline, diesel). Gildemeister et al.,Citation62 based on STN data mostly acquired prior to July 15, 2003, reported a salt factor responsible for ∼4% of PM2.5 mass. Detroit-specific industrial factors such as steel, metal plating, and zinc were not found for Minnesota. As for Chicago, PMF and EV-CMB both identified nine factors/sources,Citation63 though the two solutions differ notably in industrial and biomass burning sources (). Gasoline and diesel contributions were not separated at Chicago by either PMF or EV-CMB analysis.
SCEs at BONDCitation61 differ from those at Minnesota IMPROVE sites. Despite its rural nature, industrial sources such as copper, lead smelting, and metal plating accounted for 11% of BOND PM2.5 and mobile source contributions constituted as much as 17% of PM2.5. Buzcu-Guven et al.Citation61 attributed these contributions to long-range transport from Indiana and Ohio. Such strong industrial impacts were not found at MACA. Zhao and HopkeCitation64 reported a mobile FSC (10%) higher than those found at Minnesota rural sites. Secondary nitrate contributes less at MACA, possibly due to elevated sulfate concentrations and warmer weather in winter.Citation65 About 16% of MACA PM2.5 mass was associated with an optical pyrolysis (OP)Citation66,Citation67-rich sulfate factor that Zhao and HopkeCitation64 attributed to acidic catalyzed SOC.
Potential Source Regions
PMF-factor-score-weighted probability maps (DP ij ) were generated for each STN and IMPROVE site. These maps are more useful for estimating locations of regional sources, often including secondary sulfate, secondary nitrate, windblown dust, and large-scale wildfires or prescribed burns. Spatial resolution of the trajectories is too coarse to resolve urban-scale sources such as vehicle exhaust and localized industrial emissions.Citation16 shows these maps for ROC and GRRI, a STN-IMPROVE pair that are only ∼70 km apart despite differing in their urban-rural setting. Factor probability maps are expected to be similar between ROC and GRRI if the factor is dominated by regional-scale sources and/or long-range transport.
Figure 5. EBT probability maps for (a, b) secondary sulfate, (c, d) soil dust, (e, f) biomass burning, and (g, h) secondary nitrate factors resolved by PMF for the ROC and GRRI sites.
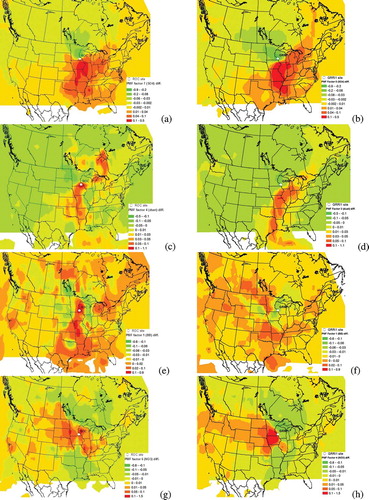
Occurrences of high secondary sulfate factor scores correspond with a region in Central Plains stretching from Great Lakes to northern Texas (–b). This region, particularly the lower Midwest, contains the highest densities of coal-fired power plants in the country.Citation68 Coal combustion is a major source of SO2, of which conversion rate to sulfate varies with season and weather conditions. Trajectories weighted by the “soil dust” factor suggest both local (for ROC only) and potential intrastate sources (–d). Major dust sources are located along a corridor from the south of Minnesota into neighboring states of Iowa, Missouri, and Arkansas (Figure S2.)
Wild and prescribed fire locations determined from the Moderate Resolution Imaging Sepctroradiometer (MODIS) satellite confirms large areas of agricultural burning in the Central Plains and most of the southeastern states (see Supporting Information). Another region with biomass burning appears northwest of Minnesota and runs across the U.S.-Canadian border into the provinces of Manitoba and Saskatchewan. Biomass burning probability maps (–f) do not reveal source regions as clearly as those for secondary sulfate and dust factors, though the Central Plain–southeastern states and northwestern Minnesota are indeed highlighted for ROC and GRRI, respectively. Transport of wildfire smoke from the northern Rockies also shows up in both maps. The secondary nitrate weighted trajectories show a common source region to the west of ROC/GRRI (–h). This is consistent with ammonia (NH3) emissions in the vast rural areas of Minnesota, North Dakota, South Dakota, Nebraska, and Iowa, as ammonium is the counterpart of nitrate in the secondary nitrate formation.Citation69 Another source region to the east of Minnesota also shows up in the ROC map.
CONCLUSIONS
This study represents the first effort to apply multiple receptor models to both urban and rural PM2.5 monitoring data across the state of Minnesota. PMF and Unmix factors were associated with source types based on comparison with measured source profiles. There was evidence of some collinearity among source factors, but not so large that it would influence the source attribution. PMF, Unmix, and EV-CMB reached consensus on (1) secondary sources (sulfate, nitrate, and organic carbon) dominate PM2.5 mass, particularly at rural sites; (2) mobile sources outweigh area sources including fugitive dust and biomass burning at urban sites, and vice versa at rural sites; (3) taconite production and coal-fired boilers were the only stationary sources, with minor primary PM2.5 contributions when compared to the other source categories; (4) gasoline and diesel exhaust contributions were separated only at the urban STN sites, but the large variability among the SCEs from different CMB solutions indicate that the split is not accurate; and (5) secondary sulfate and nitrate were similar for all of solution methods. SOC was resolved only by EV-CMB.
Overall urban and rural PM2.5 source contributions were estimated by averaging fractional source contributions (FSCs) from PMF, Unmix, and EV-CMB for STN (urban) and IMPROVE (rural) sites. This led to a good mass closure with respect to resolved source/factor contributions, that is, 105–109%. Urban FSCs (post July 15, 2003), by the decreasing order, are secondary nitrate (28%), secondary sulfate (27%), gasoline engine exhaust (21%), diesel engine exhaust (13%), soil dust (5%), Ca-rich dust (4%), biomass burning smoke (3%), SOC (2%), salt (1%), and taconite dust (1%). Compared with source apportionment studies for Detroit and Chicago, major differences appear on the type and magnitude of stationary sources that may be location-specific. FSCs for the Minnesota rural IMPROVE sites are secondary sulfate (41%), secondary nitrate (28%), biomass burning (13%), coal utility (6%), soil dust (5%), Ca-rich dust (5%), gasoline vehicle (4%), salt (4%), SOC (<1%), and taconite dust (1%). Coal utility contributions were not commonly resolved for Midwestern IMPROVE sites, but a few other studies (e.g., Buzcu-Guven et al.Citation61 and Zhao and HopkeCitation64) reported multiple sulfate factors implying fresh and aged aerosols from coal combustion.
Ensemble back-trajectory analysis was consistent with results from similar studies that identified emitters in lower Midwestern states as the largest contributors to secondary ammonium sulfate. Transport from the north tended to produce levels that were below sulfate annual averages. Biomass burning caused by wildfires and prescribed burns may have large contributions from out-of-state on occasions, as indicated by the satellite observations and trajectory analysis. Regional transport is likely important for biomass burning and dust particles concentrations at Minnesota sampling sites, in addition to substantial local RWC and road dust emissions. Further separation of regional and local burning or dust contributions is not achieved in this study but may be accomplished in the future with more specific organic markers, which will also help narrow down the uncertainties in mobile source contributions.
uawm_a_619082_sup_22237631.pdf
Download PDF (1.1 MB)ACKNOWLEDGMENTS
This study was supported, in part, by the Minnesota Pollution Control Agency (MPCA). The information expressed in this paper does not necessarily reflect the MPCA's policies. The authors thank D. Trimble, S. Kohl, and S. Chancellor for their assistance in the laboratory and data analysis and H. Wiegner for helping collect the Minnesota geological dust samples.
REFERENCES
- Bachmann , J.D. 2007 . Critical Review Summary—Will the Circle Be Unbroken: A History of the U.S. National Ambient Air Quality Standards . EM 2007 , 13 June : 27 – 34 .
- Chow , J.C. , Watson , J.G. , Feldman , H.J. , Nolan , J. , Wallerstein , B.R. , Hidy , G.M. , Lioy , P.J. , McKee , H.C. , Mobley , J.D. , Bauges , K. and Bachmann , J.D. 2007 . Critical Review Discussion—Will the Circle Be Unbroken: A History of the U.S. National Ambient Air Quality Standards . J. Air Waste Manage. Assoc. 2007 , 57 : 1151 – 1163 . doi: 10.3155/1047-3289.57.10.1151
- Minnesota Pollution Control Agency (MPCA). Air Quality Index for Minnesota. Minnesota Pollution Control Agency: St. Paul, MN, 2010 http://aqi.pca.state.mn.us/ (http://aqi.pca.state.mn.us/) (Accessed: 26 September 2011 ).
- U.S. Environmental Protection Agency. 40 CFR Part 50: National Ambient Air Quality Standards for Particulate Matter; Final Rule; Fed. Regist. 2006, 71, 61144-61233 http://www.epa.gov/ttn/amtic/files/ambient/pm25/pt5006.pdf (http://www.epa.gov/ttn/amtic/files/ambient/pm25/pt5006.pdf) (Accessed: 26 September 2011 ).
- Chow , J.C. , Watson , J.G. , Mauderly , J.L. , Costa , D.L. , Wyzga , R.E. , Vedal , S. , Hidy , G.M. , Altshuler , S.L. , Marrack , D. , Heuss , J.M. , Wolff , G.T. , Pope , C.A. III and Dockery , D.W. 2006 . Critical Review Discussion—Health Effects of Fine Particulate Air Pollution: Lines That Connect . J. Air Waste Manage. Assoc. 2006 , 56 : 1368 – 1380 .
- Mauderly , J.L. and Chow , J.C. 2008 . Health Effects of Organic Aerosols . Inhal. Toxicol. , 20 : 257 – 288 . doi: 10.1080/08958370701866008
- Pope , C.A. III and Dockery , D.W. 2006 . Critical Review: Health Effects of Fine Particulate Air Pollution: Lines That Connect . J. Air Waste Manage. Assoc. , 56 : 709 – 742 .
- Dominici , F. , McDermott , A. , Zeger , S.L. and Samet , J.M. 2003 . Airborne Particulate Matter and Mortality: Timescale Effects in Four US Cities . Am. J. Epidemiol. , 157 : 1055 – 1065 .
- Cooper , J.A. and Watson , J.G. 1980 . Receptor Oriented Methods of Air Particulate Source Apportionment . J. Air Pollut. Control Assoc , 30 : 1116 – 1125 .
- Watson , J.G. 1984 . Overview of Receptor Model Principles . J. Air Pollut. Control Assoc. , 34 : 619 – 623 .
- Chow , J.C. and Watson , J.G. 2002 . Review of PM2.5 and PM10 Apportionment for Fossil Fuel Combustion and Other Sources by the Chemical Mass Balance Receptor Model . Energy Fuels , 16 : 222 – 260 .
- Javitz , H.S. , Watson , J.G. , Guertin , J.P. and Mueller , P.K. 1988 . Results of a Receptor Modeling Feasibility Study . J. Air Pollut. Control Assoc. , 38 : 661 – 667 .
- Brook , J.R. , Vega , E. and Watson , J.G. 2004 . “ Receptor Methods ” . In Particulate Matter Science for Policy Makers—A NARSTO Assessment, Part 1 , Edited by: Hales , J.M. and Hidy , G.M. 235 – 281 . London : Cambridge University Press .
- Watson , J.G. , Chow , J.C. and Fujita , E.M. 2001 . Review of Volatile Organic Compound Source Apportionment by Chemical Mass Balance . Atmos. Environ. , 35 : 1567 – 1584 .
- Watson , J.G. , Chow , J.C. , Lowenthal , D.H. , Robinson , N.F. , Cahill , C.F. and Blumenthal , D.L. 2002 . Simulating Changes in Source Profiles from Coal-Fired Power Stations: Use in Chemical Mass Balance of PM2.5 in the Mt. Zirkel Wilderness . Energy Fuels , 16 : 311 – 324 .
- Watson , J.G. , Chen , L.-W.A. , Chow , J.C. , Lowenthal , D.H. and Doraiswamy , P. 2008 . Source Apportionment: Findings from the U.S. Supersite Program . J. Air Waste Manage. Assoc. , 58 : 265 – 288; doi: 10.3155/1047-3289.58.2.265 .
- Watson , J.G. and Chow , J.C. 2005 . “ Receptor Models ” . In Air Quality Modeling—Theories, Methodologies, Computational Techniques, and Available Databases and Software. Vol. II—Advanced Topics , Edited by: Zannetti , P. 455 – 501 . Pittsburgh , PA : Air and Waste Management Association and the EnviroComp Institute .
- Watson , J.G. and Chow , J.C. 2004 . Receptor Models for Air Quality Management . EM , 10 October : 27 – 36 .
- Watson , J.G. and Chow , J.C. 2007 . “ Receptor Models for Source Apportionment of Suspended Particles ” . In Introduction to Environmental Forensics , 2nd , Edited by: Murphy , B. and Morrison , R. 279 – 316 . New York : Academic Press .
- Chen , L.-W.A. , Doddridge , B.G. , Dickerson , R.R. , Chow , J.C. and Henry , R.C. 2002 . Origins of Fine Aerosol Mass in the Baltimore-Washington Corridor: Implications from Observation, Factor Analysis, and Ensemble Air Parcel Back Trajectories . Atmos. Environ. , 36 : 4541 – 4554 .
- Chen , L.-W.A. , Watson , J.G. , Chow , J.C. and Magliano , K.L. 2007 . Quantifying PM2.5 Source Contributions for the San Joaquin Valley with Multivariate Receptor Models . Environ. Sci. Technol. , 41 : 2818 – 2826 .
- Chen , L.-W.A. , Lowenthal , D.H. , Watson , J.G. , Koracin , D. , Kumar , N. , Knipping , E.M. , Wheeler , N. , Craig , K. and Reid , S. 2010 . Toward Effective Source Apportionment Using Positive Matrix Factorization: Experiments with Simulated PM2.5 Data . J. Air Waste Manage. Assoc. , 60 : 43 – 54 . doi: 10.3155/1047-3289.60.1.43
- Held , T. , Ying , Q. , Kleeman , M.J. , Schauer , J.J. and Fraser , M.P. 2005 . A Comparison of the UCD/CIT Air Quality Model and the CMB Source-Receptor Model for Primary Airborne Particulate Matter . Atmos. Environ. , 39 : 2281 – 2297 .
- Lowenthal , D.H. , Watson , J.G. , Koracin , D. , Chen , L.-W.A. , DuBois , D. , Vellore , R. , Kumar , N. , Knipping , E.M. , Wheeler , N. , Craig , K. and Reid , S. 2010 . Evaluation of Regional Scale Receptor Modeling . J. Air Waste Manage. Assoc. , 60 : 26 – 42 . doi: 10.3155/1047-3289.60.1.26
- U.S. Environmental Protection Agency. Guidance on the Use of Models and Other Analyses for Demonstrating Attainment of Air Quality Goals for Ozone, PM2.5, and Regional Haze; EPA -454/B-07-002; U.S. Environmental Protection Agency: Research Triangle Park, NC, 2007 http://www.epa.gov/ttn/scram/guidance/guide/final-03-pm-rh-guidance.pdf (http://www.epa.gov/ttn/scram/guidance/guide/final-03-pm-rh-guidance.pdf) (Accessed: 26 September 2011 ).
- Watson , J.G. , Chow , J.C. , Chen , L.-W. A. and DuBois , D.W. 2008 . Receptor Modeling for the Minnesota Particulate Matter 2.5 (PM2.5) Study , St. Paul , MN : prepared by Desert Research Institute, Reno, NV, for Minnesota Pollution Control Agency .
- Chen , L.-W. A. , Watson , J.G. , Chow , J.C. , DuBois , D.W. and Herschberger , L. 2010 . Chemical Mass Balance Source Apportionment for Combined PM2.5 Measurements from U.S. Non-Urban and Urban Long-Term Networks . Atmos. Environ. , 44 : 4908 – 4918 .
- Flanagan , J.B. , Jayanty , R.K. M. , Rickman , E.E. Jr. and Peterson , M.R. 2006 . PM2.5 Speciation Trends Network: Evaluation of Whole-System Uncertainties Using Data from Sites with Collocated Samplers . J. Air Waste Manage. Assoc. , 56 : 492 – 499 .
- Malm , W.C. , Sisler , J.F. , Huffman , D. , Eldred , R.A. and Cahill , T.A. 1994 . Spatial and Seasonal Trends in Particle Concentration and Optical Extinction in the United States . J. Geophys. Res. , 99 ( D1 ) : 1347 – 1370 .
- Watson , J.G. , Zhu , T. , Chow , J.C. , Engelbrecht , J.P. , Fujita , E.M. and Wilson , W.E. 2002 . Receptor Modeling Application Framework for Particle Source Apportionment . Chemosphere , 49 : 1093 – 1136 .
- Chow , J.C. , Watson , J.G. , Chen , L.-W. A. , Rice , J. and Frank , N.H. 2010 . Quantification of Organic Carbon Sampling Artifacts in U.S. Non-Urban and Urban Networks . Atmos. Chem. Phys. , 10 : 5223 – 5239 .
- Watson , J.G. , Chow , J.C. , Chen , L.-W.A. and Frank , N.H. 2009 . Methods to Assess Carbonaceous Aerosol Sampling Artifacts for IMPROVE and Other Long-Term Networks . J. Air Waste Manage. Assoc. , 59 : 898 – 911; doi: 10.3155/1047-3289.59.8.898 .
- Chow , J.C. , Watson , J.G. , Chen , L.-W. A. , Arnott , W.P. , Moosmüller , H. and Fung , K.K. 2004 . Equivalence of Elemental Carbon by Thermal/Optical Reflectance and Transmittance with Different Temperature Protocols . Environ. Sci. Technol. , 38 : 4414 – 4422 .
- Chow , J.C. , Watson , J.G. , Houck , J.E. , Pritchett , L.C. , Rogers , C.F. , Frazier , C.A. , Egami , R.T. and Ball , B.M. 1994 . A Laboratory Resuspension Chamber to Measure Fugitive Dust Size Distributions and Chemical Compositions . Atmos. Environ. , 28 : 3463 – 3481 .
- Jiang, H.; Wu, C.Y.; Biewen, T. Metals Emissions from Taconite Ore Processing Facilities in Minnesota; Minnesota Pollution Control Agency: St. Paul, MN, 2007 http://www.pca.state.mn.us/air/toxics/paper-metalsemissionsfromtaconiteoreprocessing.pdf (http://www.pca.state.mn.us/air/toxics/paper-metalsemissionsfromtaconiteoreprocessing.pdf) (Accessed: 26 Sept 2011 ).
- Green , M.C. , Chang , M.-C.O. , Chow , J.C. , Kuhns , H.D. , Chen , L.-W.A. , Nussbaum , N.J. , Nikolic , D. , Arnott , W.P. , Kumar , S. and Etyemezian , V. 2004 . Las Vegas Carbon Source Apportionment Study, Final Report , Las Vegas , NV : prepared by Desert Research Institute, Reno, NV, for Clark County Department of Air Quality Management .
- Chow , J.C. , Watson , J.G. , Kuhns , H.D. , Etyemezian , V. , Lowenthal , D.H. , Crow , D.J. , Kohl , S.D. , Engelbrecht , J.P. and Green , M.C. 2004 . Source Profiles for Industrial, Mobile, and Area Sources in the Big Bend Regional Aerosol Visibility and Observational (BRAVO) Study . Chemosphere , 54 : 185 – 208 .
- Watson, J.G.; Fujita, E.M.; Chow, J.C.; Zielinska, B.; Richards, L. W.; Neff, W. D.; Dietrich, D. Northern Front Range Air Quality Study. Final Report; prepared by Desert Research Institute, Reno, NV, for Colorado State University: Fort Collins, CO; 1998 http://charon.cira.colostate.edu/DRIFinal/ZipFiles/ (http://charon.cira.colostate.edu/DRIFinal/ZipFiles/) (Accessed: 26 September 2011 ).
- U.S. Environmental Protection Agency. SPECIATE Version 4.0; Environmental Protection Agency: Research Triangle Park, NC, 2007 http://www.epa.gov/ttn/chief/software/speciate/index.html (http://www.epa.gov/ttn/chief/software/speciate/index.html) (Accessed: 26 September 2011 ).
- Henry , R.C. 1997 . History and Fundamentals of Multivariate Air Quality Receptor Models . Chemom. Intell. Lab. Sys. , 37 : 37 – 42 .
- Henry , R.C. 2003 . Multivariate Receptor Modeling by N-Dimensional Edge Detection . Chemom. Intell. Lab. Sys. , 65 : 179 – 189 . doi: 10.1016/S0169-7439(02)00108-9
- Paatero , P. 1997 . Least Squares Formulation of Robust Non-negative Factor Analysis . Chemom. Intell. Lab. Sys. , 37 : 23 – 35 .
- Paatero , P. , Hopke , P.K. , Song , X.H. and Ramadan , Z. 2002 . Understanding and Controlling Rotations in Factor Analytical Models . Chemom. Intell. Lab. Sys. , 60 : 253 – 264 .
- Hidy , G.M. and Friedlander , S.K. December 6-11 1971 . “ The Nature of the Los Angeles Aerosol ” . In Proceedings of the Second International Clean Air Congress , Edited by: Englund , H.M. and Beery , W.T. December 6-11 , 391 – 404 . New York : Academic Press . 1970, Washington, D.C
- RTI . 2005 . Review of Sodium Ion Contamination Issue for the Speciation Trends Network (Revised); RTI/08858/012/02S , Research Triangle Park , NC : prepared by RTI, Research Triangle Park, NC, for U.S. Environmental Protection Agency .
- Watson , J.G. , Chow , J.C. , Chen , L.-W.A. , DuBois , D.W. , Kohl , S.D. and Trimble , D.L. 2008 . Monitoring and Data Analysis for the Minnesota Particulate Matter 2.5 (PM2.5) Study , St. Paul , MN : prepared by Desert Research Institute, Reno, NV, for Minnesota Pollution Control Agency .
- U.S. Environmental Protection Agency. EPA Positive Matrix Factorization (PMF) 3.0 Model; U.S. Environmental Protection Agency: Research Triangle Park, NC, 2010 http://www.epa.gov/heasd/products/pmf/pmf.html (http://www.epa.gov/heasd/products/pmf/pmf.html) (Accessed: 26 September 2011 ).
- Reff , A. , Eberly , S.I. and Bhave , P.V. 2007 . Receptor Modeling Of Ambient Particulate Matter Data Using Positive Matrix Factorization: Review of Existing Methods . J. Air Waste Manage. Assoc. , 57 : 146 – 154 .
- Ashbaugh , L.L. , Malm , W.C. and Sadeh , W.Z. June 19 1983 . A Methodology for Establishing the Probability of the Origin of Air Masses Containing High Pollutant Concentrations; Presented at the 76th Annual APCA Meetings June 19 , Altanta , GA
- Koracin , D. , Vellore , R. , Lowenthal , D.H. , Watson , J.G. , Koracin , J. , McCord , T. , DuBois , D.W. , Chen , L.S.-W.A. , Kumar , N. , Knipping , E.M. , Wheeler , N.J.M. , Craig , K. and S , Reid . Regional Source Identification Using Lagrangian Stochastic Particle Dispersion and HYSPLIT Backward-Trajectory Models . J. Air Waste Manage. Assoc. 2011 , 61 660 – 672 . doi: 10.3155/1047-3289.61.6.660
- Stohl , A. 1996 . Trajectory Statistics—A New Method to Establish Source-Receptor Relationships of Air Pollutants and Its Application to the Transport of Particulate Sulfate in Europe . Atmos. Environ. , 30 : 579 – 587 .
- Draxler, R.R.; Hess, G.D. Description of the HYSPLIT-4 Modeling System; NOAA Technical Memorandum ERL ARL-224; National Oceanic and Atmospheric Administration, Air Resources Laboratory: Silver Spring, MD, 1997 http://www.arl.noaa.gov/data/models/hysplit4/win95/arl-224.pdf (http://www.arl.noaa.gov/data/models/hysplit4/win95/arl-224.pdf) (Accessed: 26 September 2011 ).
- Xu , J. , DuBois , D.W. , Pitchford , M.L. , Green , M.C. and Etyemezian , V. 2006 . Attribution of Sulfate Aerosols in Federal Class I Areas of the Western United States Based on Trajectory Regression Analysis . Atmos. Environ. , 40 : 3433 – 3447 .
- Chow , J.C. , Watson , J.G. , Ashbaugh , L.L. and Magliano , K.L. 2003 . Similarities and Differences in PM10 Chemical Source Profiles for Geological Dust from the San Joaquin Valley, California . Atmos. Environ. , 37 : 1317 – 1340 . doi: 10.1016/S1352-2310(02)01021-X
- Labban , R. , Veranth , J.M. , Chow , J.C. , Engelbrecht , J.P. and Watson , J.G. 2004 . Size and Geographical Variation in PM1, PM2.5 and PM10: Source Profiles from Soils in the Western United States . Water Air and Soil Pollution , 157 : 13 – 31 .
- Chow , J.C. , Watson , J.G. , Lowenthal , D.H. , Chen , L.-W. A. , Zielinska , B. , Mazzoleni , L. R. and Magliano , K. L. 2007 . Evaluation of Organic Markers for Chemical Mass Balance Source Apportionment at the Fresno Supersite . Atmos. Chem. Phys , 7 : 1741 – 2754 .
- Fujita , E.M. , Campbell , D.E. , Arnott , W.P. , Chow , J.C. and Zielinska , B. 2007 . Evaluations of the Chemical Mass Balance Method for Determining Contributions of Gasoline and Diesel Exhaust to Ambient Carbonaceous Aerosols . J. Air Waste Manage. Assoc. , 57 : 721 – 740 . doi: 10.3155/1047-3289.57.6.721
- U.S. Environmental Protection Agency . 1997 . Compilation of Air Pollutant Emission Factors. Volume I: Stationary Point and Area Sources , Research Triangle Park , NC : U. S. Environmental Protection Agency, Office of Air and Radiation, Office of Air Quality Planning and Standards .
- Chen , L.-W.A. , Moosmüller , H. , Arnott , W.P. , Chow , J.C. , Watson , J.G. , Susott , R.A. , Babbitt , R.E. , Wold , C.E. , Lincoln , E.N. and Hao , W.M. 2007 . Emissions from Laboratory Combustion of Wildland Fuels: Emission Factors and Source Profiles . Environ. Sci. Technol. , 41 : 4317 – 4325 .
- Chen , L.-W.A. , Verburg , P. , Shackelford , A. , Zhu , D. , Susfalk , R. , Chow , J.C. and Watson , J.G. 2010 . Moisture Effects on Carbon and Nitrogen Emission from Burning of Wildland Biomass . Atmos. Chem. Phys. , 10 : 6617 – 6625 .
- Buzcu-Guven , B. , Brown , S.G. , Frankel , A. , Hafner , H.R. and Roberts , P.T. 2007 . Analysis and Apportionment of Organic Carbon and Fine Particulate Matter Sources at Multiple Sites in the Midwestern United States . J. Air Waste Manage. Assoc. , 57 : 606 – 619 . doi: 10.3155/1047-3289.57.5.606
- Gildemeister , A.E. , Hopke , P.K. and Kim , E. 2007 . Sources of Fine Urban Particulate Matter in Detroit, MI . Chemosphere , 69 : 1064 – 1074 .
- Rizzo , M.J. and Scheff , P.A. 2007 . Fine Particulate Source Apportionment Using Data from the USEPA Speciation Trends Network in Chicago, Illinois: Comparison of Two Source Apportionment Models . Atmos. Environ. , 41 : 6276 – 6288 .
- Zhao , W.X. and Hopke , P.K. 2006 . Source Identification for Fine Aerosols in Mammoth Cave National Park . Atmos. Res. , 80 : 309 – 322 .
- West , J.J. , Ansari , A.S. and Pandis , S.N. 1999 . Marginal PM2.5: Nonlinear Aerosol Mass Response to Sulfate Reductions in the Eastern United States . J. Air Waste Manage. Assoc. , 49 : 1415 – 1424 .
- Chow , J.C. , Watson , J.G. , Pritchett , L.C. , Pierson , W.R. , Frazier , C.A. and Purcell , R.G. 1993 . The DRI Thermal/Optical Reflectance Carbon Analysis System: Description, Evaluation and Applications in U.S. Air Quality Studies . Atmos. Environ. , 27A : 1185 – 1201 . doi: 10.3155/1047-3289.57.9.1014
- Chow , J.C. , Watson , J.G. , Chen , L.-W.A. , Chang , M.C.O. , Robinson , N.F. , Trimble , D. and Kohl , S.D. 2007 . The IMPROVE—A Temperature Protocol for Thermal/Optical Carbon Analysis: Maintaining Consistency with a Long-Term Database . J. Air Waste Manage. Assoc. , 57 : 1014 – 1023; doi: 10.3155/1047-3289.57.9.1014 .
- DuBois, D.W.; Xu, J.; Green, M.C.; Watson, J.G. Causes of Haze Assessment (COHA) Web site. Desert Research Institute: Las Vegas, NV, 2008 http://www.coha.dri.edu/ (http://www.coha.dri.edu/) (Accessed: 26 September 2011 ).
- Pitchford , M.L. , Poirot , R.L. , Schichtel , B.A. and Malm , W.C. 2009 . Characterization of the Winter Midwestern Particulate Nitrate Bulge . J. Air Waste Manage. Assoc. , 59 : 1061 – 1069 . doi: 10.3155/1047-3289.59.9.1061
- Zhao , W.X. and Hopke , P.K . 2006 . Source Investigation for Ambient PM2.5 in Indianapolis, IN . Aerosol Sci. Technol. , 40 : 898 – 909 .