
 ?Mathematical formulae have been encoded as MathML and are displayed in this HTML version using MathJax in order to improve their display. Uncheck the box to turn MathJax off. This feature requires Javascript. Click on a formula to zoom.
ABSTRACT
Customer reviews on sharing economy platforms like Airbnb have been studied extensively. However, their effectiveness has recently been questioned. We investigate their role regarding listing churn on Airbnb using panel data. We find that listings with few or poor ratings will likely leave the platform. Correcting for the listings’ characteristics, we find that the best possible rating strongly predicts the listings’ success. We conclude that the best rating is a necessary but insufficient condition for success.
1. Introduction
When people shop, book a ride, or rent accommodations online, they will most likely encounter customer ratings and reviews. These ratings and reviews, typically integrated within the platforms’ feedback systems, are essential in trust-building in online markets (Ba & Pavlou, Citation2002; Dellarocas, Citation2003). Building trust is a central prerequisite for trade and, thereby, one major pillar for economic success in the sharing economy, as the participating parties usually expose themselves to risk (Jøsang et al., Citation2007; Wang & Emurian, Citation2005). Most people are only willing to take that risk if they trust that the exchange will occur to their satisfaction (Hsin Chang & Wen Chen, Citation2008).
In the classical sense, building trust meant trust due to a direct personal relationship or, indirectly, through a network of trusted contacts. For the latter, reputation and brands, usually in the form of word-of-mouth, played a central role. In contrast, trust between users on two-sided online platforms must rely on less direct means. Such platform-based business models have become increasingly popular. For example, people substitute low-budget hotels with privately offered accommodations (Zervas et al., Citation2017) and share rides and cars with strangers (e.g., BlaBlaCar and Getaround). How is this possible without classical trust-building tools? The reason is the successful implementation of large-scale trust-building in the online world. Rating and review systems allowing users to build an online reputation are essential for trust-building.
Research has intensively studied rating- and review systems (e.g., Cabral & Hortaçsu, Citation2010; Resnick et al., Citation2006; Ter Huurne et al., Citation2017). However, the effectiveness of such systems has been questioned for various reasons. Among others, the self-selection of reviewers leads to a loss of information value, as extreme ratings (both good and bad) are more likely to be published than moderate ones (Schoenmueller et al., Citation2020). Some authors argue that the influence of ratings on consumer decisions means that providers and platforms have a motive to influence, control, or even manipulate reviews (Rosario et al., Citation2020). Hosts frequently try to eliminate bad ratings by re-registering (Ba & Pavlou, Citation2002; Dell’amico, Citation2020; Leoni, Citation2020); however, there is no solid empirical foundation for this claim. In light of the excess of highly positive rating scores, some researchers wonder if they are meaningful (Bridges & Vásquez, Citation2018; Filippas et al., Citation2018; Zervas et al., Citation2021). Finally, several authors have identified a lack of empirical research on rating systems’ effectiveness, especially taking a longitudinal perspective and studying the effect of ratings on survival (Acemoglu et al., Citation2022; Hati et al., Citation2021; Leoni, Citation2020; Ter Huurne et al., Citation2017; Teubner, Citation2018). As a result, there is uncertainty about whether ratings are (still) a suitable tool to overcome information asymmetry on peer-to-peer sharing platforms.
In addition to these calls for further longitudinal studies, we address another problem: selection bias. If “better” listings have higher ratings and a higher probability of survival, such listings will be overrepresented in cross-section and short panel samples. Such an overrepresentation can lead to biased estimates and might hide reverse causality. In that sense, it would not be sufficient to explain that well-rated listings are more successful than listings with lower or no ratings. We suspect selection biases are particularly prevalent in the sharing economy as early supply-side adopters might have an advantage. Thereby, a listing’s success might depend not only on its characteristics but also on when it was launched. While similar problems can emerge in pure online marketplaces, sharing markets are usually geographically bound and ultimately limited to, for example, the number of foreign visits in a city.
With this study, we address these issues and attempt to advance the understanding of the formative aspect of online ratings, particularly regarding their dynamics over time. Focusing on the supplier side, we study a cohort of accommodations posted on Airbnb, the largest and most prominent example of the sharing economy (Dann et al., Citation2018). This paper is organized along with the following two main research questions.
RQ1:
Can rating scores potentially drive Airbnb listings out of the market?
RQ2:
Does the ratings’ effectiveness change over the listings’ maturity?
In a nutshell, our findings show that the distribution of ratings leans very much to the positive end. Using Markov chain modeling, we find that listings with few or low ratings are likelier to leave the platform. The more and better its rating becomes, the higher the listing’s survival chances. Controlling for listing characteristics, we find that the rating strongly predicts activity (and, ultimately, survival). Studying a cohort of 2016’s listings, we find that a 5-star rating increases the probability of remaining active until the end of the evaluation period by around 30%, compared to listings with 3.5 or fewer stars.
Furthermore, we find that of all listings with a motive to re-register, only a small fraction (3%) does so. This study makes the following two core contributions. Firstly, we confirm that star ratings are still a meaningful signal strongly influencing listings’ success even in a highly skewed rating environment. We find that in this process, top scores represent a necessary but not sufficient signal. Thereby, and secondly, we contribute to understanding how ratings work in a situation where the best possible rating is the norm. More generally, we show how rating dynamics lead to a (cross-sectionally) skewed rating distribution.
The remainder of this article is structured as follows. Section 2 lays out the study’s theoretical background and related research streams. Section 3 then introduces the data and method. Section 4 presents the results. We discuss our findings, implications, limitations, and potential avenues for future work in Section 5. Last, Section 6 concludes.
2. Theoretical aspects and research on the topic
2.1. Information asymmetry and the sharing economy
The involved parties do not have the same information in typical market transactions. In online transactions, such information asymmetry is often particularly problematic as, ex-ante, physical inspection, or in-depth inspection of the product at hand are impossible. Furthermore, providers have a decisive influence on the quality, for example, by deciding how well to equip the lodging.
Different forms of information asymmetry and its consequences in markets have been well-known and studied for decades (Akerlof, Citation1970; Holmström, Citation1979; Pauly, Citation1974; Rothschild & Stiglitz, Citation1976). From the information-asymmetry perspective, some transactional characteristics seem to be particularly critical: 1) the uniqueness of a transaction (as compared to repeated transactions), 2) the fact that characteristics cannot be wholly determined or contractually terminated in advance (e.g., through guarantees), and 3) the absence of a trusted intermediary who guarantees quality.
All three characteristics apply to online marketplaces such as accommodation-sharing platforms. Mutual reviews of customers and providers seem to be one part of the remedy and, ultimately, one reason why online markets do not fail – against the above-mentioned theoretical odds. Online reviews address two problems: Firstly, they (ideally) provide unbiased information on the properties (quality) of the offered good or service. Thus, they act as a neutral third party. Secondly, as any deviation might result in a negative review, reviews function as a threat of sanctioning, incentivizing both parties to behave appropriately. Indeed, the literature suggests that star ratings can lead actors to act in a socially desired way (e.g., Newlands et al., Citation2019).
2.2. Transaction cost theory and the sharing economy
Transaction cost theory, proposed by economist Ronald Coase and further developed by Oliver E. Williamson, analyzes the contractual relationships between the parties to a transaction (Coase, Citation1937). It provides explanations as to why certain transactions can be processed and organized with varying degrees of efficiency depending on the institutional arrangement. Depending on the transaction costs, hierarchical forms of organization (within a company), an open market or mixed forms (e.g., alliances) can be optimal (Williamson, Citation1981). Transaction costs arise from transfers of goods or services between actors. Uncertainty, frequency, and the costs themselves (information costs, bargaining costs, and enforcement costs) are the characteristic features that describe the transaction.
In the context of this study, the most important application of transaction cost theory in the information systems literature concerns the analysis of electronic markets. Electronic markets generally reduce transaction costs by providing a direct platform for supply and demand to interact, bypassing middlemen (Frenken & Schor, Citation2017). At the same time, the question arises as to how digital ecosystems should be evaluated in the context of transaction cost theory (Plekhanov et al., Citation2023).
2.3. Research on Trust in the Sharing Economy
Trust is a central subject of research on sharing- and platform economy transactions, which researchers have known from early on (see, e.g., Ratnasingam & Phan, Citation2003). A provider’s reputation is a crucial element for trust-building. However, trust has multiple dimensions (e.g., benevolence, ability) and targets (e.g., platform, providers, product) (Hawlitschek et al., Citation2018; Räisänen et al., Citation2021; Ter Huurne et al., Citation2017). Some studies investigate the building blocks of trust (e.g., Ogbanufe & Kim, Citation2018; H. Wang et al., Citation2018), finding that perception factors such as familiarity and risk perception are essential. Other studies focus on particular aspects of profiles, such as profile photos, generally finding a positive relation between professional photos, trustworthiness, and economic success factors (Abrate & Viglia, Citation2019; Ert et al., Citation2016; Teubner et al., Citation2022). Kaimann (Citation2020) investigates the composition of online ratings of a peer-to-peer ridesharing platform and finds that some of the driver’s attitudes (conversation, music, peds, etc.) positively influence customer ratings.
2.4. The role of reviews and star ratings
Researchers empirically investigated the relationship between purchase decisions and customer reviews on various online platforms, including eBay and Amazon (see, e.g., Ba & Pavlou, Citation2002; Chevalier & Mayzlin, Citation2006; Dellarocas, Citation2003; Pavlou & Dimoka, Citation2006). An eBay seller’s reputation positively affects the end prices they achieve in their auctions (Melnik & Alm, Citation2002; Resnick et al., Citation2006). The first reviews seem to be of relatively high importance for sellers, but the importance of further reviews decreases (Livingston, Citation2005). The assessments of negative ratings differ in part. While Melnik and Alm (Citation2002) found that some negative ratings in the early stages might not affect overall success, Cabral and Hortaçsu (Citation2010) note that negative feedback often induces further negative ratings and lowers sales rates. Furthermore, Cabral and Hortaçsu (Citation2010) observed that many sellers become inactive after a series of below-average ratings.
Some studies detect problems with star ratings and question their effectiveness in overcoming information asymmetry. Schoenmueller et al. (Citation2020) indicate that online ratings often tend to be self-selecting, with extreme opinions, in particular, more likely to be communicated, reducing their informational value. Further, due to the importance of ratings and the business behind them, another concern is that consumer ratings may lose weight through biased reporting, biased interpretation, manipulation, and fraudulent or fake reviews (Dorner et al., Citation2020; Fisher et al., Citation2018; Rosario et al., Citation2020). Bridges and Vásquez (Citation2018) ask whether ratings become meaningless if most of them are very positive. They argue that the star rating alone might not be a sufficiently reliable indicator. For the complete picture, they stress the importance of written feedback and reading between the lines of such text reviews.
An observation that casts doubt regarding ratings’ usefulness is distributions’ skewness (Bridges & Vásquez, Citation2018; Zervas et al., Citation2021). Most platforms’ mean rating is equal to or very close to the best value, and moderate reviews are infrequent (Filippas et al., Citation2018). Furthermore, ratings seem to inflate over time, meaning that, overall, average ratings increase while average quality does not (Filippas et al., Citation2019). Filippas et al. (Citation2019) argue that this tendency could make ratings irrelevant.
2.5. Gaps in the literature
While an extensive range of (empirical) studies employs Airbnb data (Dann et al., Citation2018), there are very few studies that focus on the (long-term) effectiveness of ratings. Ter Huurne et al. (Citation2017) noted that empirical studies on sharing platforms showing the consequences of trust mechanisms are rare. They call for further studies that investigate the actual functioning of trust mechanisms. In fact, we are aware of only two studies empirically considering rating-induced selection processes in the sharing economy. Researching Airbnb rating skewness, Teubner and Glaser (Citation2018) found indication for survivorship bias as one contributing factor. Specifically, well-rated accommodations have a higher chance of “surviving” in the market. Similarly, using survivorship models on a 15-month sample of Airbnb listings in Ibiza, (Leoni, Citation2020) finds that lower-rated listings are more likely to disappear.
Long-term panel studies are needed. Teubner and Glaser (Citation2018) call for further research to explain the effectiveness of ratings, for example, by replicating their findings in other cities. Their discovery of a survivorship bias must alert every researcher to work cautiously with short (or cross-sectional) data. Leoni (Citation2020) notes that further analysis with longitudinal data could mitigate potential problems with reverse causality. For example, suppose new entrants could try to stand out from established offers by particularly favorable prices or “instant-booking” but at the same time have a shorter life expectancy. In that case, these characteristics could correlate with short life expectancy. In the long run, though, low prices and good booking options might be the only suitable way for new listings to establish themselves. Another open issue is returning listings, that is, hosts who delete and re-register their accommodation to reset their ratings.
While rating- and review systems have been studied intensively, the effectiveness of such systems has recently been questioned. We identify a lag of longitudinal studies that can account for market-timing and selection bias. Moreover, to the best of our knowledge, returning listings have not been considered empirical investigations of the sharing economy. Using a cohort approach, we address this knowledge gap and find that even when ratings are strongly biased toward the positive end, the best possible rating strongly predicts a listing’s success. We conclude that the best rating is a necessary but insufficient condition for success, rendering the deviation from it an informative signal, not its achievement.
3. Data collection, main variables, and methods
We employ a panel data set of market data to address the outlined research questions. This allows us 1) to investigate the market over time (rather than looking at static “snapshot” data) and 2) to study actual and economically incentivized behavior (rather than surveying mere intentions).
3.1. Data collection
The data used for this study is sourced from InsideAirbnb,Footnote1 a website that systematically collects data on listings, transactions, and reviews from Airbnb. The website currently provides monthly data for more than 100 cities, partly dating back to 2015. The data includes a wide range of information in Airbnb’s publicly visible profiles, such as price, rooms, bathrooms, accommodation type, and reviews.
We supplemented, consolidated, and evaluated the raw data from InsideAirbnb in several steps. provides an overview of the relationships and use of the resulting data sets, which we explain in the following.
Figure 1. Visualization of the data sets and their usage.
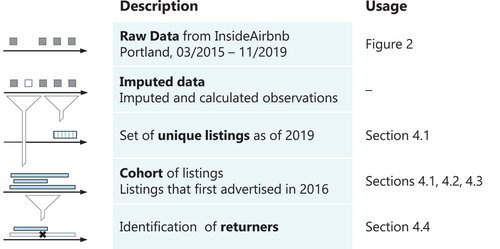
The raw data consists of listings in Portland (Oregon, United States) between March 2015 and November 2019 (i.e., excluding gaps, 47 months). We chose to focus on Portland for three reasons. First, InsideAirbnb provides a long panel data series for Portland with only a few gaps. Second, Portland’s data is not much influenced by regulation in the observed period (compared to other cities such as New York City or San Francisco). Third, the supply (and demand) is less seasonal than in other cities with temporary visiting causes such as weather (e.g., Miami), trade fairs (e.g., Austin), or cultural festivals (e.g., New Orleans). We chose to end the observation in November 2019 due to the subsequent market turbulence caused by the spread of the COVID-19 pandemic.
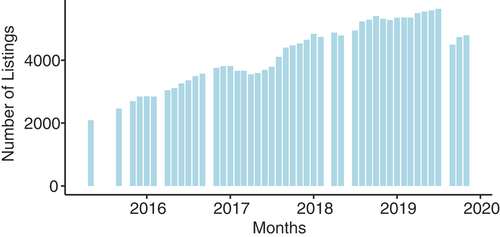
illustrates the raw listings data in Portland by month with few gaps. The number of listings increases over time. Notably, the sole appearance of a listing in a particular month does not mean that the listing was active and bookable then. We will explain this in more detail below. Not all listings appear every month in the data, but missing observations can be inferred.Footnote2
Figure 2. Observations (number of listings) per month.
3.2. Main variables
The primary independent variable is the listings’ review score. After each transaction, Airbnb invites guests to review the accommodation on an integer scale from one to five stars.Footnote3 Internally, Airbnb handles these ratings on a scale from 20 (≡ 1 star) to 100 (≡ 5 stars). Every Airbnb listing has a page showing descriptions, usually photos, reviews, and the prominently placed average of all guests’ ratings. Until November 2019, Airbnb presented this rating as a half-star rounded value, such as 4.0, 4.5, or 5.0 stars (Airbnb, Citation2019). We will use the rounded half-star values for most of the subsequent analyzes. As the internal values were not directly visible to prospective guests at the time of data collection, we expect that changes in the rounded star-values suit better explain the success of a listing than the internal scale. Airbnb rounded the internal rating scale to stars at the following intervals: 100 to 95 means 5.0 stars, 94 to 85 means 4.5 stars, and 84 to 75 means 4.0 stars. There are almost no accommodations with equal or less than 3.5 stars. Thus, we group all ratings below 75 to 3.5 or fewer stars.
Another critical aspect is assessing whether a listing is still active on the platform. Unlike previous studies, we do not consider nonappearance as the (only) key to determining whether a listing has become inactive. Our somewhat broader definition of (in)activity builds on the following considerations: When hosts quit the platform, they can either actively delete their account or simply abandon it. When deleted, the listing would no longer appear in the data. Conversely, though, disappearing listings may still exist (e.g., because InsideAirbnb did not retrieve them temporarily, e.g., for technical reasons). Analyzing the average gap length, we find that most (>80%) of the listings reappear after one month, and over 95% reappear within nine months. We thus deem one year of disappearance as a valid indicator of deletion. In contrast, when hosts do not delete their listings but leave them orphaned, a listing’s continued appearance does not mean it is still active. We hence define a listing as active if the host edited the calendar within the preceding eleven months, if the accommodation’s number of reviews changed in this period, or if it first appeared in this period. Otherwise, we consider the listing inactive from the last change in the mentioned variables.
3.3. Method
This work empirically investigates listings in Portland. Airbnb is one of the largest and most prominent examples of the sharing economy and has served as a “guinea pig” for several studies (Dann et al., Citation2018). The raw data covers the period from March 2015 to November 2019, to have no effects from the COVID-19 pandemic in the data. We use the data to study the relevance of ratings for listings’ survival. Besides using fundamental statistical analysis, we follow a cohort approach, describing churn and its contributing factors by a Markov chain and binary choice models. In the more in-depth studies, we focus on the cohort of listings first advertised in 2016.
Cohort studies are widely used in medicine and various other disciplines to get some (cautious) insights into causality when researchers can not actively assign a treatment (“exposure”) to the sample (see, e.g., Buchmann & DiPrete, Citation2006; Kahn, Citation2010; Pearce et al., Citation2012). Given the still young and dynamic development of Airbnb, the advantage is twofold. First, we minimize the risk of false attribution of generation effects, for example, when early adopters on Airbnb’s supply-side are less risk-averse than subsequent suppliers. Second, external developments that equally affect all cohort members do not influence the analysis within the cohort (e.g., changing regulations, temporary demand shocks). Alternatives such as time-dependent interaction terms are more complex and cannot always account for these effects.
For the study of churn rates, we use a Markov chain model. Understanding ratings (in means of stars) as “states,” Markov chains can intuitively represent the underlying transition processes (Gagniuc, Citation2017). The aim is to indicate the probability of an event occurring, for instance, a higher rating or leaving the platform, based on a rating in the previous period.
Our dependent variable is binary, as listings either remain active until 2019 or become inactive before. Consequently, we use a set of logit models to estimate the relationship between the binary dependent variable and explanatory factors. In the trade-off between straightforward interpretation and accuracy, we also use a weighted linear probability (wlp) model, as suggested by Wooldridge (Citation2010, p. 454).
4. Results
4.1. Basic findings and descriptive statistics
4.1.1. Unique listings as of 2019
This section’s database consists of all unique listings that appeared at least once in 2019. Thus, the following statistics closelyFootnote4 represent the entire population of Airbnb listings of Portland in 2019.
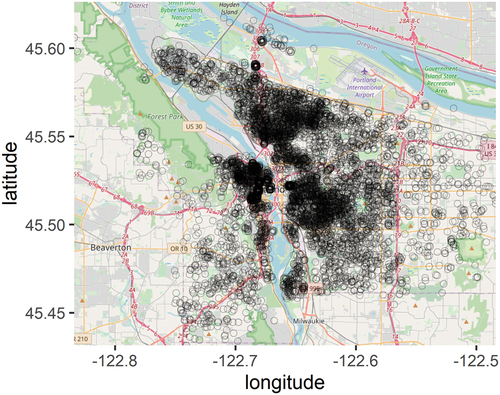
Over this time frame, there were 7,524 unique listings. The listings spread over Portland’s entire metropolitan area, as seen in . Most listings regard an “entire home/apartment” (5,367; 71%), and a smaller fraction a “private room” (2,078; 28%). Hosts usually describe their property as a house (3,182; 42%), an apartment (1,768; 23%), or a guest suite/house (1,291; 17%). We grouped property types with less than 30 listings into “other.” The median price for a night is 95 US-Dollars; 75% of the accommodations charge more than USD 65 (United States dollar) per night. Due to some very high values, the mean (USD 133) lies close to the 3rd quartile (USD 145).
Figure 3. Map of Portland (background image: © OpenStreetMap contributors) with listing locations.
summarizes the key statistics for the number of reviews and the rating scores. The median listing has 24 reviews and a 98 out of 100 score, which rounds to 5.0 stars. The mean listing has more reviews (63.3) but a slightly lower score (96.7). The difference between the mean and median is due to extreme values on different distribution sides: The lowest rating is 20 (i.e., one star), and the highest number of reviews is 793. Overall, 13% are without review, and 95% have less than 255 reviews.
Looking at the user-visible, half-star ratings, instead of the internal scale of 20 to 100, shows that 5.0 stars are the most common score (5,390; 72%). The second largest group is without a review score (1,048; 14%), followed by a rating of 4.5 (884; 12%). Ratings of 4.0 (143; 2%) and 3.5 or below (59; <1%) play a marginal role. Note that most values of the “none”-category do not have a score as they never got reviewed. However, for a minority, the values are missing in the data set.
Figure 4. (a) (left). Review scores of Airbnb listings (Portland 2019). (b) (right). Plot of the number of reviews against the review score (Portland 2019).
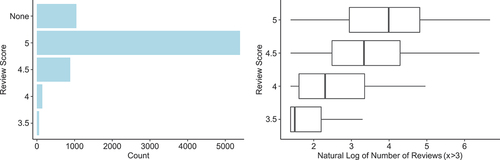
How do the number of ratings (natural log) and the review score (half-star values) relate? As can be seen in , there is a positive association between the rating score and the number of reviews: Accommodations with the highest rating score (5.0 stars) have 89 reviews on average, those with a rating of 4.5 have 62, while those with four stars, or 3.5 and below, have 26 and 7, respectively. Note that for this graph, we included only reviews with at least three reviews for reliability in the data.
4.1.2. Cohort
The cohort of accommodations that were first advertised in 2016 in Portland (see Section 3) consists of 2,405 listings with a median rating of 98 (average 95.7). Thus, the average cohort’s rating is slightly below the general population ( in the Appendix), while the share of unrated accommodations is roughly equal (14.5%). The percentage of private- and shared rooms is higher in the cohort (35% and 2%, respectively) than in the population (two proportion z-test: p < .01), while the median and the mean price are lower (USD 90 and USD 129 per night, respectively).
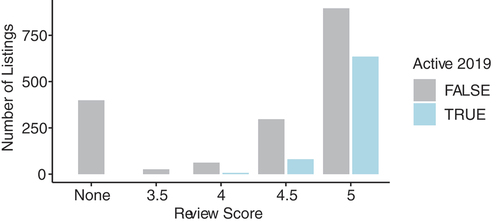
Three years after the start of the cohort, in 2019, 725 (30%) listings are still active. As shown in , many of those leaving have no or a non-optimal review score. In contrast, more than 80% of those remaining have the best possible score of 5.0 stars. Nevertheless, a 5.0 review is no warranty for long-term activity, as there are more inactive than active 5.0-star listings.
Figure 5. Number of listings by review score (cohort, Portland, 2016–2019).
4.2. Rating states and transitions
In the following section, we use Markov chain modeling to show how the 2016 cohort develops over time to contribute to the first research question (RQ1: Can rating scores potentially drive Airbnb listings out of the market?). First, we only examine ratings and the probability that a listing will become inactive. Second, we add the number of ratings as an indicator of success.
4.2.1. Markov chain of ratings
We defined six rating states (nodes): four correspond to the stars presented on the accommodation’s page (5.0, 4.5, 4.0, 3.5 or below), and “Exit” and “None.” The “Exit”-state represents an absorbing state and occurs if the listing becomes inactive before 2019. “None” describes the state in which a listing does not (yet) have a rating.
summarizes the states and transitions (probabilities) of the ratings. All chances refer to the originating node. For reasons of clarity, the graph does not depict non-adjacent links. Almost all observations start without a score, that is, at the bottom right (“None”). With a probability of 61%, the listing remains unrated in the next period, while with a probability of 11%, it will no longer be active in the upcoming period. With a chance of 28%, the listing will have a rating in the next period (not in ). The listing will most likely (21%) get the highest score (5.0). Lower ratings are less likely than higher ratings.
Figure 6. Markov states and transition probabilities of the rating.
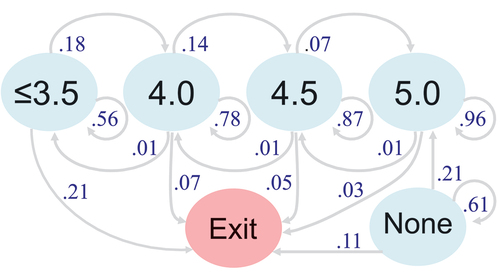
In the bigger picture, shows that the lower the rating, the higher the probability that a listing will leave the platform in the next period. Nevertheless, the lower the score, the higher the chance the rating will improve in the next period. The downgrading chances are relatively small and equal among all rating categories (1%). These effects reflect the finding that the better the rating, the higher the probability that a listing will maintain its rank, that is, stay in operation. As Teubner and Glaser (Citation2018) titled it, it is either “up or out.”
4.2.2. Two-dimensional Markov-chain considering the number of valuations
We add the number of ratings as a second dimension to the previous section’s analysis, thereby gaining insights into the listings’ success but excluding listings without reviews.
shows the two-dimensional Markov chain. The horizontal axis depicts the rating in means of stars, and the vertical axis is the number of ratings. We clustered the number of reviews into a scheme of 1–3 reviews, 4–29 reviews, and 30 or more reviews. The nodes’ size increases with the number of observations in this node; that is, the more listings remain in this node over two periods. We see that the better the rating and the higher the number of reviews, the larger the node. As before, “Exit” means that the listing became inactive. For clarity, does not show links with probabilities below 0.05 and nodes without links.
Figure 7. Two-dimensional Markov chain with number of reviews (vertical) and ratings (horizontal).
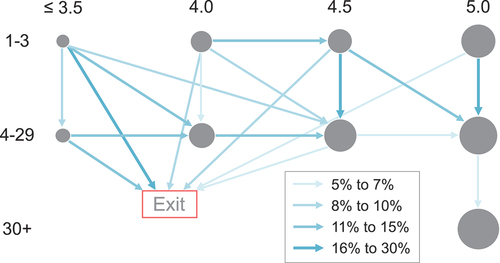
A closer look at suggests that only listings with the highest possible rating are successful in the long run. There are almost no listings with 30 or more reviews and a rating below 5.0, only the best rating leads to long-term success. Listings with low ratings are less likely to establish themselves and leave the platform more frequently. The churn rates of low-rated listings are highest in the early phase (1–3 ratings).
4.3. Determinants of listings activity
The following section uses binary choice models to add a perspective to the first research question (RQ1). Subsequently, we use a similar method to answer the second research question (RQ2: Does the ratings’ effectiveness change over the listings’ maturity?).
4.3.1. Basic model
As before, we study the relationship between the listing’s characteristics and survival (activity) at its ultimate moment of activity. We model the relationship in the logit and wlp model as follows:
Only the first four independent variables are scaled metrically; all others are nominal and ordinal. presents the results. We will interpret the logit coefficients relative to a “median” listing (5.0 stars, 90 USD per night, entire home, property type “House”). A median listing’s chance of being active in 2019 is 40.8%. This exceeds the overall expectation, as only 30% (725) of the cohort’s listings remain active.
The probability of staying active depends on the rating: if the rating is 4.5 stars instead of 5.0, the estimated probability drops to 22.9%. Put differently, improving the rating by 0.5 from 4.5 to 5 stars almost doubles the chances of remaining active. The estimated survival probability for a listing with a low rating (≤3.5) is close to zero (<0.01%).
Note that some property type coefficients are considerable. For example, the persistence probability of a “Guesthouse” is 80.4%, almost double that of an otherwise identical “house” (40.8%, median listing, see above).
Comparing the logit coefficients’ interpretation to those of the wlp (), we conclude that wlp estimates are a precise and handy proxy for the technically more appropriate logit regression. Therefore, we will use the wlp model to intuitively illustrate time changes in the coefficients in
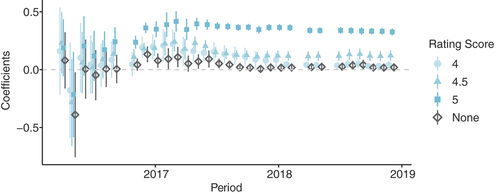
Figure 8. Coefficients of the rating score predicting activity in 2019 (cohort, Portland).
4.3.2. Periodic considerations
The previous paragraphs examined the relationship between a listing’s characteristics and activity using the listing’s ultimate observation. Now we use the dependent variables in the status at a given point to investigate how their meaning changes over time. Reviews significantly influence listings’ success from early on (RQ2). Similar to the previous section, we model the relationship as follows:
The index t in EquationEquation 2(2)
(2) indicates that we only use the value (occurrence) for the independent variables at time t. We estimate whether a listing’s characteristics at t significantly predict activity (survival). We estimate the model for all periods in a logit- and wlp-form but only present the wlp results.
presents the rating score estimates and confidence intervals of the wlp-model, excluding all remaining coefficients from EquationEquation 2(2)
(2) for clarity reasons. On the far right of , the last estimate resembles previous results: From the ex-post perspective, good (best) ratings increase (strongly) the probability of staying active.
Moving the listings’ properties into the past (from right to left in ), we see minor increases in the coefficients until mid-2017. It follows that the best rating is a strong indicator of long-term activity in the mid-term. The positive effect of the best rating is significant from August 2016 onwards; thus, at a time when new listings are still to join the cohort. The estimated coefficient is 0.24. In other words, a listing with a rating of 5.0 in August 2016 will have a 24% points higher chance of remaining active than a listing with a rating of 3.5 or below. The estimate doubled to around 42% points in March 2017. In the first four periods, the highest rating is not significantly related to long-term success.
Summing up, after a period of around half a year, in which ratings are only partially linked to longer-term success, ratings increasingly suit to predict long-term activity. From early periods on, 5.0 stars strongly relate to long-term activity. A rating of 4.5 stars still increases the chances, while 4.0 stars only increase the prospects in a transitional phase. This phase is limited to roughly the first year of a listing’s existence.
4.4. Do hosts re-register?
The previous analyzes suggest that poorly rated listings become inactive. However, hosts could try to eliminate bad ratings by re-registering their accommodation. This problem is also known as “re-entry” or “cheap pseudonyms” (Friedman & Resnick, Citation2001; Jøsang & Golbeck, Citation2009). As a result, it appears that poorly rated listings leave the platform, although hosts only reset their ratings by re-registering. Therefore, in addition to our two research questions, we asked whether hosts re-register.
Airbnb distinguishes between listings and hosts. Hosts can have multiple listings, and guests review listings, not hosts. Thus, two reasonable procedures exist for re-registering from the hosts’ point of view. They can place another duplicate listing online using their existing host profile or create an entirely new account. Therefore, we have performed two additional analyzes: First, we searched for hosts that re-advertise very similar or identical listings when their original listing becomes inactive. Second, we looked for similar listings from newly registered hosts, again with an overlap in time (“new but old”).
In both cases, the original, poorly rated listings can be actively deleted but do not necessarily have to, as hosts might leave the listing orphaned. We identify potential returnees using the following criteria: 1) we only consider listings with a rating below 5.0 stars since we assume that the incentive to reset a rating only exists for non-optimal ratings; 2) reappearing listings locate at a maximum distance of 252 meters from the original listingFootnote5; 3) listings reappear earliest two weeks before and up to one month after the original listing’s inactivity (the period is somewhat broader due to the uncertainty of the exact date of inactivity); 4) all core characteristics of the listings must be identical, e.g., regarding the number of bedrooms and the number and type of beds; 5) the landing page image and descriptions (texts) are similar, or at least not mutually exclusive (manual comparison).
As a result, this yielded seven listings in the cohort that, based on their characteristics, clearly match a previously existing listing of the same host. Consequently, about 1.8% of the hosts with inactive listings re-registered the listing using their host account. Notably, three of the seven returners probably refer to a single listing.
Next, we search for “new but old” hosts. Instead of comparing appearance dates as before, we use hosts’ registration dates to search for potential matches with previously active listings. We assume that the date of a host’s registration can be up to two weeks before and up to one month after the last activity of the original listing. We identified six hosts as re-registrations of previous listings.
Thus, we estimate that 3.3% (13) of those listings that become inactive and have a motive to reset the rating (385) will re-register. The proportion is vanishingly small (0.5%) relative to the entire cohort. We assume that this is a lower limit as, due to our assumptions, we may not identify all returners. For example, we do not register listings and hosts that re-register more than two weeks before or more than one month after the (estimated) original listing’s inactivity. Besides, it is not always possible to determine with certainty that a listing is a returner, for example, when the landing-page images show different rooms. Furthermore, it is possible that providers deliberately interpret characteristics differently when registering a new listing in order not to be recognized as a returner. For example, returners may count a sofa bed (no longer) as a bed or declare a chamber (no longer) as an entire room. Finally, even if hosts have the optimal rating, they might wish to reset text reviews.
5. Discussion
5.1. Summary
This study investigates the role of ratings in building trust and overcoming information asymmetries in online markets by considering the relation between a listing’s rating score and activity. We contribute to the research on trust-building mechanisms in digital services and provide implications for platform operators and users.
Information asymmetries can pose a threat to the successful execution of transactions. Traditional instruments, such as guarantees, cannot always be implemented online. Therefore, platforms found new ways to build trust between users, most prominently through mutual rating and review systems. By publishing rating scores, platforms aim to inform users about others’ experiences, thereby reducing information asymmetry and, ultimately, building trust between strangers. We investigate these rating scores’ long-term effectiveness based on a rich data set of Airbnb listings in Portland, Oregon, USA.
Previous studies found that the distribution of rating scores is positively skewed (Filippas et al., Citation2018; Schoenmueller et al., Citation2020; Zervas et al., Citation2021). We reproduce this finding with fundamental statistical analysis across all listings as of 2019. Rounded to the half unit, more than 70% of the accommodations exhibit the best possible rating (5.0 stars), and 82% have a rating of at least 4.5 stars. Given this extreme distribution, some authors asked whether ratings are still meaningful and effectively mitigating information asymmetries (Bridges & Vásquez, Citation2018; Schoenmueller et al., Citation2020).
Our study can be seen as a response to this open-ended question and the repeated calls for longitudinal studies on reputation systems (Leoni, Citation2020; Ter Huurne et al., Citation2017). We focus on the cohort of listings that first occurred in 2016. Roughly 70% of these listings have become inactive by 2019. We apply two-dimensional Markov modeling to investigate the relationship between a listing’s score and its success in the market (RQ1). Using the listing’s number of reviews as an indicator, we find that the highest ratings are a prerequisite for long-term success. We interpret this finding as an indication of rating effectiveness as a “make-or-break” feature in the market and as a predictor of listings’ success vs. churn.
While Markov chains represent a suitable method to describe stochastic processes, we apply binary classification models to account for other factors that potentially relate to listing success (RQ1). Using logit regression, we find that without an excellent rating (i.e., 5.0 or 4.5 stars), an average accommodation (regarding its remaining characteristics) has almost no chance of remaining active. With a rating of 5.0, the chance is 20% points higher than a rating of 4.5. Nevertheless, the best possible rating is no warranty for long-term activity, as an average accommodation’s overall probability to remain active (even with a 5.0 rating) is a little over 40%.
To evaluate changes over time in the cohort, we regress survival on the listings’ characteristics at each observed point in time (RQ2). We find that 5-star ratings are a reliable indication of long-term success from early on. Slightly lower ratings (4.5 and 4.0) show a positive correlation with long-term success for a phase of roughly one year after the start of the cohort. Thus, in a transitionary phase, a good, while not perfect, rating, and no rating at all, is better than a bad rating (i.e., 3.5 stars or lower). As this positive effect fades over time, we conclude that only the best rating is a robust success signal in the long run. In other words, an excellent rating is a necessary, but not sufficient, condition for success.
Finally, scholars questioned whether hosts intend to reset negative ratings by re-registering (see, e.g., Leoni, Citation2020). Subprime accommodations would then seemingly leave the platform, although they only press a virtual reset button. We identify a share of 3% of hosts resetting their reviews by signing up again. We cover both hosts re-inserting their listings and those setting up a new host profile. Our criteria for flagging re-registering are relatively narrow; therefore, we suggest 3% as a lower bound.
5.2. Implications
This study has several practical and theoretical implications. First, ratings are a proper selection mechanism in online markets. Listings with non-optimal ratings are more likely to drop out and rarely achieve many ratings. However, a rating system’s effectiveness depends on whether guests communicate positive or negative experiences. As ratings are high on average, below-average experiences can be shared effectively and differentiated, thereby reducing transaction costs, just as emphasized by transaction cost theory. Since possible negative ratings represent an income risk, ratings give customers a valuable tool to punish hosts, for instance, for lack of effort. Then, there is no incentive to make short-term profits for well-rated hosts at the expense of quality, for example, a lower cleaning effort.
Thus, both for platforms and customers, ratings are a cost-effective tool to incentivize against negative experiences effectively. With this, concluding that rating systems are indispensable for platforms and users, we deliver an in-field confirmation of Keser and Späth (Citation2021)’s experimental study. The study’s findings that listings with few or poor ratings are more likely to leave the platform underscore the importance of ratings in reducing information costs and building trust between market participants.
However, ratings are not suited to inform and incentivize outstandingly positive results. Guests cannot communicate an above-average experience through ratings alone, as the maximum rating equals the (rounded) average. Accommodations providers cannot quantitatively stand out from the norm, for example, after making extraordinary efforts. The differentiation of listings at the upper end has become and will thus become increasingly difficult. Some platforms’ efforts to highlight outstanding listings might respond to these limits. Examples include Airbnb’s “Superhost” badge and the change to reporting averages with decimal places instead of rounded half-star values.
Due to the strong tendency toward excellent ratings, one can argue that the effectiveness of ratings builds primarily on their harm as negative signals and punishments. In this sense, ratings cannot serve as a potential reward or distinction, as a long history of outstanding ratings renders the best rating the standard. Transaction cost theory suggests that high search costs can impede efficient transactions. Extremely positive ratings may not always reflect true quality due to manipulation and distortions, which can increase search costs and undermine platform performance. In this light, platforms could adjust their rating system, allowing for a more accurate differentiation among the best-rated listings. Different measures are conceivable, for example, 1) More effort could be required for outstandingly positive ratings, for example, through more extended mandatory documentation; 2) Platforms could standardize each customer’s ratings to the customer’s average rating; thus, ratings would become relative to other accommodations rated by the guest; 3) Platforms could ask customers how they value the accommodation relative to others, for example, whether it belongs to the top 5%. Unlinking such statements from publishing consequences but using them for an annual award of the (actual) top offers could promote honesty.
On a broader level, it can be discussed whether platform operators should focus on introducing robust quality assurance mechanisms that go beyond customer ratings. While positive ratings are essential, they should complement them with other quality indicators such as verified reviews, standardized listing criteria, and enhanced verification processes for hosts. By doing so, platform operators can reduce the risk of manipulation and increase trust among participants, ultimately improving the platform’s overall reputation and user satisfaction.
Furthermore, recognizing the potential vulnerability of ratings to manipulation and distortions, platform operators should continuously refine their feedback systems to ensure their accuracy and reliability. The study’s findings suggest that the mitigation of manipulation is essential to minimize enforcement costs associated with resolving disputes and addressing fraudulent behavior. This could involve introducing dynamic algorithms that detect and mitigate rating manipulation, fostering transparency in the rating process, and encouraging users to provide constructive and genuine feedback. Additionally, operators could explore alternative feedback mechanisms such as peer-to-peer reviews or expert evaluations to complement traditional ratings, providing users with a more comprehensive assessment of listings’ quality.
Ultimately, platforms should enhance user engagement. The study highlights the significance of ratings in determining the success and longevity of listings on the platform. Therefore, platform operators should prioritize initiatives aimed at enhancing user engagement and incentivizing both hosts and guests to provide meaningful feedback. This could include offering rewards or incentives for leaving detailed reviews, facilitating communication channels between hosts and guests to address any concerns or issues promptly, and fostering a sense of community and trust within the platform ecosystem. By actively encouraging user participation in the rating process, platform operators can improve the overall quality of listings and enhance the platform’s competitiveness in the sharing economy market.
5.3. Critical appraisal and future work
Finally, as with any research based on empirical data, this study has its strengths and limitations. One of the strengths is that the ratings are of high quality, as Airbnb ratings’ reliability is presumably higher than ratings on other platforms. First, individual ratings are expensive as guests may only give them after the platform-mediated payment and booking. Thus, manipulators must pay at least the Airbnb fees for fake reviews. Second, as Airbnb manages large parts of the transactions (e.g., calendar and payment), it can prevent and detect biased reviews easier than pure review platforms. Third, a review quota of roughly two-thirds renders the average rating more robust against manipulations and isolated opinions (Fradkin et al., Citation2015; Lu & Tabari, Citation2019). Compared to other online transactions, such as shopping, a single rating on Airbnb has a higher value as rental transactions occur less frequently.
Nevertheless, rating systems and their validity as a quality signal are not without limitations. Since a 5.0-star rating is a necessary success condition, we reckon that there is a high incentive for manipulation, particularly shortly after a listing’s launch. Without manipulation, it could be difficult for new hosts to compete with established and well-rated listings. Furthermore, our reputation measurement is narrow, as ratings are only one dimension of the reviewing process. Written feedback and ratings that refer to particulars (e.g., cleanness, description accuracy) probably contribute to a host’s online reputation. Therefore, examining the content of some written feedback, for instance, in terms of length and quality, could be a fruitful way of deepening our research. The correlation between these characteristics and the quantitative evaluation could then be analyzed.Footnote6 Nevertheless, we believe that the focus on the overall ranking is without loss of generality, as 1) prospective guests have limited attention, 2) the overall ranking is the most prominently placed evaluation, and 3) the average ranking is probably the most appropriate proxy for unique quality measurement.
Our research shows that poor ratings are one of the leading causes of churn. However, as hosts do not explain their disappearance, it might be conceivable that hosts had other reasons for quitting the platform. Hosts may have moved the listing to other platforms, or out of the market, for example, because they needed the space for other purposes or no longer owned the property.
Future research should address how different effects contribute to the ratings’ empirical distribution. Several authors have identified multiple plausible explanations that lead to an increase in the average rating (Newlands et al., Citation2019; Rosario et al., Citation2020; Schoenmueller et al., Citation2020). However, the effect’s interplay and the degree to which they contribute to the overall rating skewness is mostly unclear. Another aspect is that booking platforms face a trade-off regarding ratings: On the one hand, they want to provide an objective rating system, informing customers about quality as honestly as possible. On the other hand, there is the incentive to market listings in the best possible way (e.g., through excellent ratings) to stimulate transactions and generate profits. Therefore, the question arises of how far it is in the platforms’ interest to present a more differentiated picture of the many “optimal” listings. Experiments and surveys could investigate the extent to which more detailed information might affect booking behavior and overall market dynamics.
6. Conclusion
The success of (sharing) platforms such as Airbnb is primarily fueled by the platforms’ capacity to build trust between peers unknown to each other. One essential component of online trust-building is ratings, in the case of Airbnb (and many other platforms), measured on a scale of one to five stars. Several authors question the effectiveness and usefulness of ratings, among others, due to their skewness toward positive scores, biased incentives, and reporting preferences (Bridges & Vásquez, Citation2018; Filippas et al., Citation2018; Rosario et al., Citation2020; Schoenmueller et al., Citation2020; Zervas et al., Citation2021). Further, several authors call for panel studies to address this issue (Leoni, Citation2020; Ter Huurne et al., Citation2017; Teubner & Glaser, Citation2018).
This study demonstrates that Airbnb’s star rating is a crucial mechanism for the platform’s functioning. For the listings, gaining and holding the optimal rating is a necessary but not sufficient condition for long-term success. We observe that almost all long-term successful listings have a five-star rating. Further, the probability of staying in business shrinks starkly with a non-optimal rating (or no rating), making an optimal rating a necessary condition. However, we also observe that many 5.0-rated listings do not stay active over multiple years. They become inactive even though they have the best possible rating. An optimally rated listing, across all other characteristics, has a chance of roughly 50% for long-term activity. Thus, the 5.0 rating is no warranty, that is, no sufficient condition for long-term activity.
Ratings provide guests with information and, above all, a powerful tool for setting incentives. Given the devastating effects of a subprime rating, guests exert decisive power on who gets to stay in the market. Only those listings continuously managing to receive the highest ratings will prevail. If, overall, the reported ratings represent actual quality, only listings that fully meet guests’ expectations will survive in the market. This gives guests some certainty about the quality of long-standing listings with excellent ratings. We show that selection processes partly drive the distortions toward very positive evaluations. When only the best-evaluated listings remain in the market, cross-sectional observations show higher averages than all ever-registered hosts. By investigating a cohort, we see that selection processes develop over several years, with only the top-rated listings remaining in business.
Disclosure statement
No potential conflict of interest was reported by the author(s).
Data availability statement
The data analyzed throughout this study is available online at http://insideairbnb.com/.
Additional information
Notes on contributors
Aaron S. Kolleck
Aaron Kolleck is a doctoral researcher at TU Berlin and Associated Researcher at the Weizenbaum Institute. As an economist by background, he is studying the behavior of individuals in platform-based markets and the economic effects of the sharing economy.
Timm Teubner
Timm Teubner is a professor of Trust in Digital Services in the Faculty of Economics and Management at TU Berlin. He is a member of the Institute of Technology and Management, the Einstein Center Digital Future, and a fellow of the Berlin Centre for Consumer Policies. The main focus of his work is the analysis and the design of digital platform ecosystems. He approaches this subject from a socio-technical perspective on information systems. This includes the investigation of user behavior and psychology, technical, legal, as well as strategic aspects.
Notes
1. insideairbnb.com.
2. We observe month-by-month gaps for all listings together () and individual gaps. We inferred both using linear interpolation between the gap’s initial and final value (second step in ). Thereby, we imputed roughly 17% of the data. We checked our results against no imputation but found them to be robust.
3. In addition to the numerical rating, the review also includes texts, which we do not consider here.
4. Except for those listings that only appeared in December 2019 or have not been scraped by InsideAirbnb.
5. Airbnb blurs the exact locations of the accommodations in the publicly accessible offer lists. There is no information on the degree of deviation between revealed and true location. However, for listings that show different locations over time, in 95% of the cases they are a maximum of 252 m apart. Therefore, we assume that accommodations whose blurred locations are more than 252 m apart cannot be identical.
6. We thank an anonymous reviewer for this salient idea.
References
- Abrate, G., & Viglia, G. (2019). Personal or product reputation? Optimizing revenues in the sharing economy. Journal of Travel Research, 58(1), 136–148. https://doi.org/10.1177/0047287517741998
- Acemoglu, D., Makhdoumi, A., Malekian, A., & Ozdaglar, A. (2022). Learning from reviews: The selection effect and the speed of learning. Econometrica, 90(6), 2857–2899. https://doi.org/10.3982/ECTA15847
- Airbnb. (2019, November 5). In case you missed it: 3 product updates to catch up on. https://community.withairbnb.com/t5/Airbnb-Updates/In-Case-You-Missed-It-3-product-updates-to-catch-up-on/m-p/1171247#M15569
- Akerlof, G. A. (1970). The market for “lemons”: Quality uncertainty and the market mechanism. The Quarterly Journal of Economics, 84(3), 488–500. https://doi.org/10.2307/1879431
- Ba, S. L., & Pavlou, P. A. (2002). Evidence of the effect of trust building technology in electronic markets: Price premiums and buyer behavior. MIS Quarterly: Management Information Systems, 26(3), 243–268. https://doi.org/10.2307/4132332
- Bridges, J., & Vásquez, C. (2018). If nearly all Airbnb reviews are positive, does that make them meaningless? Current Issues in Tourism, 21(18), 2057–2075. https://doi.org/10.1080/13683500.2016.1267113
- Buchmann, C., & DiPrete, T. A. (2006). The growing female advantage in college completion: The role of family background and academic achievement. American Sociological Review, 71(4), 515–541. https://doi.org/10.1177/000312240607100401
- Cabral, L., & Hortaçsu, A. (2010). The dynamics of seller reputation: Evidence from eBay. The Journal of Industrial Economics, 58(1), 54–78. https://doi.org/10.1111/j.1467-6451.2010.00405.x
- Chevalier, J. A., & Mayzlin, D. (2006). The effect of word of mouth on sales: Online book reviews. Journal of Marketing Research, 43(3), 345–354. https://doi.org/10.1509/jmkr.43.3.345
- Coase, R. H. (1937). The nature of the firm. Economica, 4(16), 386–405. https://doi.org/10.1111/j.1468-0335.1937.tb00002.x
- Dann, D., Teubner, T., & Weinhardt, C. (2018). Poster child and guinea pig – insights from a structured literature review on Airbnb. International Journal of Contemporary Hospitality Management, 31(1), 427–473. https://doi.org/10.1108/IJCHM-03-2018-0186
- Dell’amico, M. (2020). Webs of trust: Choosing who to trust on the internet. Privacy Technologies and Policy, 113–126. https://doi.org/10.1007/978-3-030-55196-4_7
- Dellarocas, C. (2003). The digitization of word of mouth: Promise and challenges of online feedback mechanisms. Management Science, 49(10), 1407–1424. https://doi.org/10.1287/mnsc.49.10.1407.17308
- Dorner, V., Giamattei, M., & Greiff, M. (2020). The market for reviews: strategic behavior of online product reviewers with monetary incentives. Schmalenbach Business Review, 72(3), 397–435. https://doi.org/10.1007/s41464-020-00094-y
- Ert, E., Fleischer, A., & Magen, N. (2016). Trust and reputation in the sharing economy: The role of personal photos in Airbnb. Tourism Management, 55, 62–73. https://doi.org/10.1016/j.tourman.2016.01.013
- Filippas, A., Horton, J. J., & Golden, J. (2018). Reputation inflation. Proceedings of the 2018 ACM Conference on Economics and Computation (pp. 483–484). https://doi.org/10.1145/3219166.3219222
- Filippas, A., Horton, J. J., & Golden, J. (2019). Reputation inflation. NBER Working Paper No. w25857. https://ssrn.com/abstract=3391010
- Fisher, M., Newman, G. E., Dhar, R., Johar, G., & van Osselaer, S. (2018). Seeing stars: How the binary bias distorts the interpretation of customer ratings. Journal of Consumer Research, 45(3), 471–489. https://doi.org/10.1093/jcr/ucy017
- Fradkin, A., Grewal, E., Holtz, D., & Pearson, M. (2015). Bias and reciprocity in online reviews: Evidence from field experiments on Airbnb. Proceedings of the Sixteenth ACM Conference on Economics and Computation (pp. 641–641). https://doi.org/10.1145/2764468.2764528
- Frenken, K., & Schor, J. (2017). Putting the sharing economy into perspective. Environmental Innovation and Societal Transitions, 23, 3–10. https://doi.org/10.1016/j.eist.2017.01.003
- Friedman, E., & Resnick, P. (2001). The social cost of cheap pseudonyms. Journal of Economics & Management Strategy, 10(2), 173–199. https://doi.org/10.1162/105864001300122476
- Gagniuc, P. A. (2017). Markov chains: From theory to implementation and experimentation. John Wiley & Sons. https://doi.org/10.1002/9781119387596
- Hati, S. R. H., Balqiah, T. E., Hananto, A., & Yuliati, E. (2021). A decade of systematic literature review on Airbnb: The sharing economy from a multiple stakeholder perspective. Heliyon, 7(10), e08222. https://doi.org/10.1016/j.heliyon.2021.e08222
- Hawlitschek, F., Notheisen, B., & Teubner, T. (2018). The limits of trust-free systems: A literature review on blockchain technology and trust in the sharing economy. Electronic Commerce Research and Applications, 29, 50–63. https://doi.org/10.1016/j.elerap.2018.03.005
- Holmström, B. (1979). Moral hazard and observability. The Bell Journal of Economics, 10(1), 74–91. https://doi.org/10.2307/3003320
- Hsin Chang, H., & Wen Chen, S. (2008). The impact of online store environment cues on purchase intention: Trust and perceived risk as a mediator. Online Information Review, 32(6), 818–841. https://doi.org/10.1108/14684520810923953
- Jøsang, A., & Golbeck, J. (2009). Challenges for robust trust and reputation systems. 5th International Workshop on Security and Trust Management, Saint Malo, France.
- Jøsang, A., Ismail, R., & Boyd, C. (2007). A survey of trust and reputation systems for online service provision. Decision Support Systems, 43(2), 618–644. https://doi.org/10.1016/j.dss.2005.05.019
- Kahn, L. B. (2010). The long-term labor market consequences of graduating from college in a bad economy. Labour Economics, 17(2), 303–316. https://doi.org/10.1016/j.labeco.2009.09.002
- Kaimann, D. (2020). Behind the review curtain: Decomposition of online consumer ratings in peer-to-peer markets. Sustainability, 12(15), 6185. https://doi.org/10.3390/su12156185
- Keser, C., & Späth, M. (2021). The value of bad ratings: An experiment on the impact of distortions in reputation systems. Journal of Behavioral and Experimental Economics, 95(C), 101782. https://doi.org/10.1016/j.socec.2021.101782
- Leoni, V. (2020). Stars vs lemons. Survival analysis of peer-to peer marketplaces: The case of Airbnb. Tourism Management, 79, 104091. https://doi.org/10.1016/j.tourman.2020.104091
- Livingston, J. A. (2005). How valuable is a good reputation? A sample selection model of internet auctions. Review of Economics and Statistics, 87(3), 453–465. https://doi.org/10.1162/0034653054638391
- Lu, L., & Tabari, S. (2019). Impact of Airbnb on customers’ behavior in the UK hotel industry. Tourism Analysis, 24(1), 13–26. https://doi.org/10.3727/108354219X15458295631891
- Melnik, M. I., & Alm, J. (2002). Does a seller’s eCommerce reputation matter? Evidence from eBay Auctions. The Journal of Industrial Economics, 50(3), 337–349. https://doi.org/10.1111/1467-6451.00180
- Newlands, G., Lutz, C., & Fieseler, C. (2019). The conditioning function of rating mechanisms for consumers in the sharing economy. Internet Research, 29(5), 1090–1108. https://doi.org/10.1108/INTR-03-2018-0134
- Ogbanufe, O., & Kim, D. J. (2018). “Just how risky is it anyway?” the role of risk perception and trust on click-through intention. Information Systems Management, 35(3), 182–200. https://doi.org/10.1080/10580530.2018.1477292
- Pauly, M. V. (1974). Overinsurance and public provision of insurance: The roles of moral hazard and adverse selection. The Quarterly Journal of Economics, 88(1), 44–62. https://doi.org/10.2307/1881793
- Pavlou, P. A., & Dimoka, A. (2006). The nature and role of feedback text comments in online marketplaces: Implications for trust building, price premiums, and seller differentiation. Information Systems Research, 17(4), 392–414. https://doi.org/10.1287/isre.1060.0106
- Pearce, M. S., Salotti, J. A., Little, M. P., McHugh, K., Lee, C., Kim, K. P., Howe, N. L., Ronckers, C. M., Rajaraman, P., Craft, A. W., Parker, L., & Berrington de González, A. (2012). Radiation exposure from CT scans in childhood and subsequent risk of leukaemia and brain tumours: A retrospective cohort study. The Lancet, 380(9840), 499–505. https://doi.org/10.1016/S0140-6736(12)60815-0
- Plekhanov, D., Franke, H., & Netland, T. H. (2023). Digital transformation: A review and research agenda. European Management Journal, 41(6), 821–844. https://doi.org/10.1016/j.emj.2022.09.007
- RäRäIsänenänen, J., Ojala, A., & Tuovinen, T. (2021). Building trust in the sharing economy: Current approaches and future considerations. Journal of Cleaner Production, 279, 123724. https://doi.org/10.1016/j.jclepro.2020.123724
- Ratnasingam, P., & Phan, D. D. (2003). Trading partner trust in b2b [Business to business] e-commerce [electronic-commerce]: A case study. Information Systems Management, 20(3), 39–50. https://doi.org/10.1201/1078/43205.20.3.20030601/43072.5
- Resnick, P., Zeckhauser, R., Swanson, J., & Lockwood, K. (2006). The value of reputation on eBay: A controlled experiment. Experimental Economics, 9(2), 79–101. https://doi.org/10.1007/s10683-006-4309-2
- Rosario, A. B., Valck, K. D., & Sotgiu, F. (2020). Conceptualizing the electronic word-of-mouth process: What we know and need to know about eWOM [electronic Word of Mouth] creation, exposure, and evaluation. Journal of the Academy of Marketing Science, 48(3), 422–448. https://doi.org/10.1007/s11747-019-00706-1
- Rothschild, M., & Stiglitz, J. (1976). Equilibrium in competitive insurance markets: An essay on the economics of imperfect information. The Quarterly Journal of Economics, 90(4), 629–649. https://doi.org/10.2307/1885326
- Schoenmueller, V., Netzer, O., & Stahl, F. (2020). The polarity of online reviews: Prevalence, drivers and implications. Journal of Marketing Research, 57(5), 853–877. https://doi.org/10.1177/0022243720941832
- Ter Huurne, M., Ronteltap, A., Corten, R., & Buskens, V. (2017). Antecedents of trust in the sharing economy: A systematic review. Journal of Consumer Behaviour, 16(6), 485–498. https://doi.org/10.1002/cb.1667
- Teubner, T. (2018). The web of host–guest connections on Airbnb: A network perspective. Journal of Systems & Information Technology, 20(3), 262–277. https://doi.org/10.1108/JSIT-11-2017-0104
- Teubner, T., Adam, M., Camacho, S., & Hassanein, K. (2022). What you see is what you G(u)e(s)t: How profile photos and profile information drive providers’ expectations of social reward in Co-usage sharing. Information Systems Management, 39(1), 64–81. https://doi.org/10.1080/10580530.2020.1871533
- Teubner, T., & Glaser, F. (2018). Up or Out – The dynamics of star rating scores on Airbnb. Proceedings of the Twenty-Sixth European Conference on Information Systems (ECIS2018), Portsmouth, UK (pp. 13.
- Wang, H., Du, R., & Olsen, T. (2018). Feedback mechanisms and consumer satisfaction, trust and repurchase intention in online retail. Information Systems Management, 35(3), 201–219. https://doi.org/10.1080/10580530.2018.1477301
- Wang, Y. D., & Emurian, H. H. (2005). An overview of online trust: Concepts, elements, and implications. Computers in Human Behavior, 21(1), 105–125. https://doi.org/10.1016/j.chb.2003.11.008
- Williamson, O. E. (1981). The economics of organization: The transaction cost approach. American Journal of Sociology, 87(3), 548–577. https://doi.org/10.1086/227496
- Wooldridge, J. M. (2010). Econometric analysis of cross section and panel data. MIT Press.
- Zervas, G., Proserpio, D., & Byers, J. W. (2017). The rise of the sharing economy: Estimating the impact of Airbnb on the hotel industry. Journal of Marketing Research, 54(5), 687–705. https://doi.org/10.1509/jmr.15.0204
- Zervas, G., Proserpio, D., & Byers, J. W. (2021). A first look at online reputation on Airbnb, where every stay is above average. Marketing Letters, 32(1), 1–16. https://doi.org/10.1007/s11002-020-09546-4
Appendix
A1: Tables and statistical notes
Table A1. Summary statistics of the number of reviews and the review score (internal scale of 20 to 100).
Table A2. Estimating the active persistence (until 2019) of listings.
Annotation on : We investigated interactions between the price and other dependent variables but found none. Consequently, listings with a lower rating cannot increase their survival chances by lowering the price. The price coefficient (natural log) indicates a negative correlation. Thus, more expensive listings are less persistent, even though the effect is not very strong: When the median listing increases its price from USD 90 to USD 99 (10%), the estimated probability of survival decreases by 2.5% (from 40.8% to 39.8%).
A2: How “good” is no rating?
Overall, comparing the node’s persistence and exit probability in , “no rating” ranges between a score of 3.5 and 4.0 stars. The influence of no (or mediocre) ratings changes over time (). Starting in December 2016, listings without rating have a significant advantage over listings with 3.5 or fewer stars. The benefit converges to zero over the year 2017. Consequently, no rating is “better” for up to 18 months after the initial advertisement. In the long run, only the top rating (and a rating of 4.5) can (slightly) improve the chances for long-term success.