
ABSTRACT
Objectives
To assess the ability of the USCOM® (USCOM), using measurements of cardiac output (CO) and systemic vascular resistance (SVR), to predict the development of pre-eclampsia (PE) and severe PE in hypertensive pregnancies.
Study design
Prospective cohort study of women in the second or third trimester recruited at a tertiary center in Sydney, Australia. Demographic data and hemodynamic measurements using the USCOM were taken for all study participants at recruitment. Pregnancy outcome, including development of PE and severe PE, was tracked. Data were analyzed using ANOVA testing, pair-wise comparison testing, and Student’s t-testing.
Results
Recruitment included 65 normotensive controls, 34 women with chronic hypertension (CH), 51 with gestational hypertension (GH), and 21 with PE. Significantly higher weight, body surface area, and blood pressure measurements were found in the hypertensive, compared with the normotensive control and pregnancies. There were no observed differences in USCOM-measured CO, cardiac index, SVR, or systemic vascular resistance index between hypertensive women who did versus did not develop PE or severe PE in later pregnancy. Analysis of the CH and GH subgroups, as well as only unmedicated hypertensive women (n = 24), also showed no significant difference in hemodynamic parameters between those who did or did not develop PE or severe PE.
Conclusions
Our group was unable to successfully predict the onset of PE or severe PE based on hemodynamic parameters measured with the USCOM. It is possible this relates to the high proportion of women on antihypertensive medication at recruitment.
Introduction
Pre-eclampsia (PE) is defined as the presence of de novo hypertension after 20 weeks’ gestation, accompanied by at least one of: proteinuria; evidence of end organ dysfunction, including acute kidney injury, liver dysfunction, neurological features (such as visual scotoma, hyperreflexia, or persistent headaches), or hematological features; or fetal growth restriction (FGR) (Citation1). The disorder is considered one of the most severe complications of pregnancy and is responsible for 500,000 fetal and neonatal, and 30,000 maternal deaths globally per year (Citation2).
PE is accompanied by derangements in the expected cardiovascular adaptations to pregnancy. In healthy women, early pregnancy involves a drop in systolic and diastolic blood pressure (SBP/DBP) and systemic vascular resistance (SVR). This drop is compensated for by a rise in cardiac output (CO), at first due to an increase in heart rate (HR), and subsequently due to an increase in stroke volume (SV), related to an increase in total circulating blood volume and a progressive increase in left ventricular mass (Citation3). CO rises until mid-pregnancy and returns to baseline levels at term; SVR remains reduced throughout pregnancy (Citation4).
Most commonly, PE is divided into early- and late-onset forms, which exhibit contrasting hemodynamic profiles. The earlier form occurs before 34 weeks and is usually associated with an abnormally low CO and high SVR in the first trimester, FGR, and more severe biventricular systolic impairment (Citation5). Late-onset PE, by contrast, is associated with high CO, low SVR, and mild cardiac dysfunction (Citation5–7). Twenty-five percent of women with gestational hypertension (GH) or chronic hypertension (CH) will develop PE, compared to a baseline risk of 4% of all pregnancies (Citation8).
Previously, the measurement of CO and associated indices was restricted to invasive measures (such as via a Swan-Ganz catheter), or more labor- and resource-intensive methods, such as echocardiography. The USCOM is a novel noninvasive continuous wave 2D Doppler method for CO measurement. It has previously been shown that the USCOM demonstrates repeatable results in the healthy pregnant population (Citation9), has been validated in the pregnant population (Citation10–12) and has been shown to have good agreement with other noninvasive measurements of peri-operative CO monitoring (Citation13).
In some centers, the USCOM is being used to guide hemodynamically tailored therapy in high-risk and hypertensive pregnancies according to hypertensive phenotype (Citation14). However, it has not yet been shown to be capable of the prospective prediction of PE. This study therefore aimed to assess whether the USCOM can be used to predict the development of PE using maternal hemodynamics in hypertensive pregnancies.
Additionally, our group attempted to predict the development of severe PE among hypertensive and pre-eclamptic women. Our hypothesis was that more severe disease in later pregnancy may present with more readily detectable hemodynamic changes in early pregnancy, and that there may be some hemodynamic features of PE which can distinguish which patients will progress to the severe form.
Methods
Study design
A prospective observational study was performed at St. George Hospital, Sydney, Australia, a tertiary referral center for high-risk pregnancies. Women were recruited through the high-risk pregnancy clinic, the day assessment unit, and among the inpatient population. A population of normotensive pregnant women were recruited as controls from the hospital’s outpatient obstetrics clinic. All women recruited were provided information sheets, and written consent was completed by all participants prior to participation.
Inclusion criteria were women at or above the age of 18, with singleton pregnancies, in the second or third trimester. Exclusion criteria were women with an undetermined gestational age, cardiac abnormalities/conditions, other chronic disease, or fetal abnormalities. Definitions of hypertensive disorders were made with reference to the ISSHP recommendations (Citation1):
CH was defined as an established diagnosis of hypertension prior to conception, or hypertension identified in the first 20 weeks of pregnancy without a prior diagnosis.
GH was defined as hypertension diagnosed after 20 weeks gestation, without any features of pre-eclampsia.
PE was defined as de novo hypertension after 20 weeks’ gestation, accompanied by proteinuria and/or other evidence of maternal end-organ dysfunction, and/or fetal growth restriction.
Severe PE was defined as PE with pulmonary edema, renal failure, thrombocytopenia (platelet count < 150 × 109/L), thromboembolic disease, elevated liver enzymes (AST > 40 U/L), severe hypertension (SBP > 170 mmHg or DBP > 110 mmHg) or the development of eclampsia. It is no longer recommended by the ISSHP to classify PE as “severe” and “non-severe” in a clinical setting (Citation1); however, our group chose to include this category for research purposes only, to determine whether severity of disease impacts the ability of the USCOM to predict its appearance.
Demographic data were collected on all women at recruitment, including age, height, weight, and gestational age. Additionally, baseline hemodynamic parameters for all women, including HR and BP, were collected. All participants had USCOM measurements at recruitment.
Measurement method
The USCOM is a noninvasive ultrasonographic cardiac output measurement modality. It is a portable, lightweight device, which can be used at the bedside. It employs a non-imaging Doppler probe, placed into the sternal notch, or within the second to fifth intercostal spaces, and records the velocity of blood exiting the aortic or pulmonary valves, respectively. Using the velocity time integral (VTI) of the signal waveform and a proprietary algorithm to estimate the cross-sectional area of the left ventricular outflow tract (CSA) which takes the patient’s height and sex as inputs, the USCOM estimates the cardiac output via the equation CO = VTI * CSA * HR.
The USCOM has two methods for adjusting the accuracy of the velocity-time graph and exclude noise. The automated method, called FlowTrace, automatically traces the outline of the signal waveform to generate the VTI. This can also be done manually in the TouchPoint mode, where the user traces a graphic representation of the signal (see ). Given that the FlowTrace method removes the potential for human error in measurement adjustments, it was used for all measurements (with the exception of excluding gross computer-generated errors).
Figure 1. USCOM graphic user interface of the velocity-time signal of a patient’s blood exiting the aortic valve, with superimposed FlowTrace (in red).
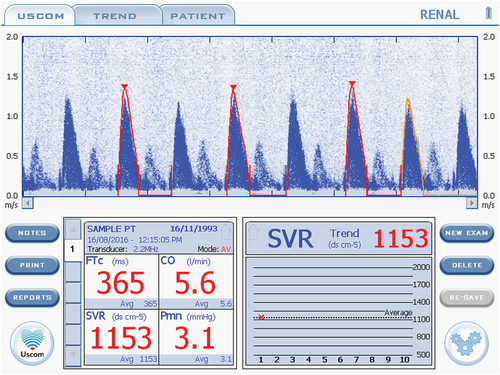
gives an example of the morphology desired in an USCOM trace. In accordance with the manufacturer’s instructions, Doppler traces were excluded and re-taken if the scale did not capture the peak velocity, if the peak of the waveform or its triangular shape was poorly defined or blunted, if the diastolic period was labeled or traced incorrectly, or the FlowTrace estimate of the curve did not reflect the images on the screen. TouchPoint mode was used only to correct gross computer-generated errors (such as the computer misinterpreting noise for signal, leading to erratic/bizarre waveforms) and to exclude beats that were morphologically inadequate. At least two morphologically adequate beats were required for a measurement to be included. Re-measurement due to a poor trace was deemed acceptable, in line with previous work showing that repeated measurements on the same pregnant woman are not significantly different (Citation9)
For each USCOM measurement, participants were rested for 5 min before measurement in a quiet environment and were not allowed to interact or use mobile phones during the resting period. Women were requested not to consume caffeine prior to the USCOM measurement. Pregnant participants under 20 weeks gestation were measured supine, with a pillow under the upper back to extend the neck (for an optimal acoustic window), while participants over 20 weeks gestation were measured in the left lateral position (approximately 15–30 degrees) to avoid aortocaval obstruction (Citation11,Citation15). It has previously been demonstrated that measurements in non-pregnant participants in the left-lateral, supine, and right-lateral positions lead to no statistically significant difference in USCOM CO measurement or profile quality (Citation16), and this method has been used by our group previously (Citation9).
It has previously been demonstrated that measurements with the USCOM demonstrate good repeatability in pregnancy (Citation9), and therefore only single measurements were taken. Due to the logistical difficulty in recruiting women from multiple sources, four operators in total performed USCOM measurements. Operators were unable to be blinded, as they were also responsible for patient recruitment. However, use of the FlowTrace automated VTI calculation method was thought to mitigate potential bias. Prior to performing scans included in the study, all operators had undertaken a training program prescribed by the manufacturer and had performed at least 30 measurements in accordance with the manufacturer’s recommendations. The threshold of 30 scans was also used by our group in a previous study. Operators collected data serially, rather than in parallel, and therefore, we were unable to assess inter-observer agreement.
Data analysis
Demographic data and hemodynamic indices (CO/cardiac index (CI), SVR/SVR index (SVRI), and SV/stroke volume index (SVI)) were analyzed using ANOVA to compare normotensive pregnant, CH, GH, and PE groups, with a Bonferroni-corrected p-threshold of 0.001 to account for multiple comparisons. The data were analyzed with participants grouped into both their diagnoses at recruitment and at the conclusion of pregnancy, to account for participants who progressed into PE and into severe PE. Similar analysis was performed only on participants not on antihypertensive therapy.
Pair-wise comparisons using either Tukey HSD testing or Student’s t-tests were used where significant differences were identified with ANOVA. Additionally, Student’s t-tests were performed in comparing hemodynamic indices between hypertensive women who did and did not develop PE.
All statistics were performed using R in the R Studio environment. Missing data were not imputed.
Ethics
The study was approved by the Human Research Ethics Committee of the South-Eastern Sydney Local Health District, NSW Health, HREC reference number 16/137.
Results
In total, 171 women were recruited– 65 normotensive controls, 34 with CH, 51 with GH, and 21 women with PE.
The demographic data for women recruited are presented in and . presents demographic data grouped into diagnoses at recruitment, and grouped into diagnoses at delivery. Demographic measures include age, height, weight, and BSA (all of which inform CO/SVR). Also included is the proportion of women already on antihypertensive medication (including beta-blockers) at the time of recruitment, and which antihypertensives were being used. Unfortunately, many women did not have their antihypertensive management recorded in our dataset due to data collection issues; the proportion of available data is included. Only includes the severe PE group, as this group was only populated after recruitment. Of note, one woman (number 86 in our dataset) progressed from being normotensive to developing PE, which is why the normotensive control population reduced in size.
Table 1. Recruitment demographic and hemodynamic data of initial groups in mean and standard deviation, compared with ANOVA testing. Statistically significant results are shown in red. Significant results of pair-wise comparisons shown using in-cell symbols.
Table 2. Recruitment demographic and hemodynamic data of final groups with one-way ANOVA testing, in mean and standard deviation. Statistically significant results are shown in red. Significant results of pair-wise comparisons shown using in-cell symbols.
P-values in reflect the results of one-way ANOVA analysis; is assessed through Students’ t-tests. Where ANOVA was positive, pair-wise comparisons were conducted and reflected in the symbols in individual cells. Statistically significant differences are represented by the following symbols:
* - compared with the CH group
$ - compared with the GH group
# - compared with the PE group
@ - compared with the severe PE group
Table 3. Haemodynamic indices in hypertensive pregnant women who did and did not progress to PE, compared using ANOVA.
Table 4. Haemodynamic parameters in women initially diagnosed with CH or GH with subsequent progression to PE, compared using ANOVA testing.
Table 5. Haemodynamic parameters of women initially diagnosed with PE with or without subsequent development to severe PE, compared using students’ t-tests.
Table 6. Haemodynamic parameters among untreated participants who did and did not progress to PE, compared using ANOVA testing.
In the recruitment grouping, normotensive pregnant women had a significantly lower weight than the CH and GH groups, a lower BSA than the GH group, and lower SBP, DBP, and MAP readings than all other groups. When patients were grouped according to their diagnosis at delivery, ANOVA testing and pair-wise comparisons revealed that women who remained normotensive throughout pregnancy weighted less than CH and GH pregnancies, had a lower BSA than GH pregnancies, and had significantly lower SBP, DBP, and MAP readings than all other groups.
There were no significant differences identified in age, height, or HR in the recruitment or delivery groupings.
There was an observable but non-statistically significant difference in gestation between the groups. Women with CH, both in the recruitment and delivery groupings, tended to be of an earlier gestation, which is possibly reflective of earlier referral to day assessment/high risk pregnancy clinics. In contrast, women of the PE and severe PE groupings tended to be of a later gestation, which may be a consequence of the appearance of PE later in pregnancy.
In those women who were diagnosed, in the initial grouping, with either CH or GH, there were no significant differences in hemodynamic indices in those who progressed to PE compared with those that did not nor were there any differences between those women who progressed to severe or non-severe PE, as demonstrated in . Additionally, splitting those hypertensive women who developed PE from either CH or GH (as in ) yielded no statistically significant differences in hemodynamic parameters. However, these subsample sizes were small (n = 7 for CH, n = 16 for GH). Additionally, there were no statistically significant differences between women with PE at recruitment who did or did not progress to severe PE, as shown in .
Given the large proportion of women on antihypertensive medication at recruitment, and that the proportion of hypertensive women medicated for hypertension rose by the time of delivery, we also assessed the capability of the USCOM to predict which non-medicated participants would progress to PE. No significant differences between women who did and did not progress to PE were identified, as shown in .
Discussion
Our study was unsuccessful in demonstrating utility of the USCOM in predicting the development of PE following a diagnosis of hypertension in pregnancy. This was true for women with either CH or GH, whether or not the participant was on antihypertensive medication and with or without the presence of “severe” features.
This outcome is disappointing as the USCOM could potentially be incorporated into the evolving body of work on screening for, and prediction of, PE. Screening strategies which have been shown most capable of identifying women at high risk of PE incorporate clinical assessment (such as weight and maternal and familial history of PE), BP, first-trimester uterine Doppler, and maternal serum biochemistry (including biomarkers such as pregnancy-associated plasma protein A). These assessments have been shown to reduce the screen-positive rate and increase the detection rate for PE compared with legacy risk factor-based methods (Citation14) and have been shown effective in guiding aspirin therapy in the ASPRE RCT (Citation17) as well as in subsequent confirmatory studies (Citation18).
No current models of screening or prediction incorporate hemodynamic assessment beyond noninvasive measures such as HR and BP (Citation19). However, there is some evidence that abnormal early hemodynamics may be capable of the prediction of PE. For example, on large datasets, principal component analysis can predict the development of, and differentiate between, hypertensive phenotypes according to hemodynamic and biochemical features in early pregnancy, such as total peripheral resistance, endoglin levels, CO, BMI, and MAP (Citation20).
Further, there is evidence which suggests that tailored antihypertensive therapy in PE leads to superior patient outcomes. One prospective cohort study found that the risk of recurrence in women whom had previously had PE can be reduced by the correction of deranged hemodynamic variables (such as CO or SVR) with hemodynamic specific therapy before the development of hypertension, relative to standard antihypertensive therapy (Citation21). Accordingly, prospective use of hemodynamic indices in managing PE risk is used at the University of Washington Medical Centre. Patients at high risk of developing PE have noninvasive hemodynamic assessments, their indices plotted against reference ranges, and treatments are planned in response to the patient’s hemodynamic profile according to local clinical guidelines (Citation14).
Currently, in Australia, more advanced hemodynamic assessment is not incorporated into the treatment algorithms for commencing antihypertensive therapy in pregnancy. The Society of Obstetric Medicine Australia and New Zealand (SOMANZ) regularly publishes guidelines on the management of hypertension in pregnancy. The most updated guideline at the time of the commencement of our study was the 2014 iteration (Citation22), which has since been updated. In this document, the authors recommend commencing antihypertensive therapy for any woman with an SBP ≥160 mmHg and/or DBP ≥110 mmHg, primarily to reduce the risk of intracerebral hemorrhage and eclampsia. Therapy recommended included oxyprenolol, labetalol, methyldopa, prazosin, hydralazine, nifedipine, and clonidine, which reflects the antihypertensive therapy being used on the women recruited in our study.
Given that there is some suggestion in the literature that hemodynamics can be predictive of PE, and that therapy along these lines may be of benefit, we would argue that the USCOM warrants further investigation as a tool for prediction and for guiding therapy. In particular, if it was proven useful, the USCOM would be of great utility to clinicians given its portability and relatively low cost.
Importantly, our study has a number of potential confounders that would be worth addressing in future work. Our sample size was too small (purely due to difficulties we faced in recruitment) for adequate subgroup analysis, which may have obscured significant differences in hemodynamics between hypertensive subtypes. In particular, this made it difficult to compare hemodynamic profiles between CH and GH pregnancies that did progress to PE and to compare only untreated women.
Our study did not incorporate fetal measurements, purely on logistical grounds. This meant that we were unable to include an important distinguishing characteristic between PE phenotypes, which may have informed our USCOM results. In one recent study, it was noted that the distinction between early and late PE was initially made on the basis of the inability of uterine artery Doppler to effectively identify cases of late-onset disease (Citation23), which supports the argument that late variants have different underlying vascular characteristics. It has been further shown that PE with and without FGR has very different cardiovascular profiles – PE without FGR had a higher CO and lower SVR than normal controls, while PE with FGR had lower CO and higher SVR than the normal population. Importantly, not only is this finding independent of gestation but similar studies on cardiovascular predictors of PE have found that while a high SVR/low CO seems to predict early PE and vice versa, occasionally the ratio is swapped (Citation6). These data would suggest that the presence or absence of FGR is a key diagnostic feature, and potentially a predictive tool that could be included in future work.
Additionally, our group had difficulty recruiting women with established hypertensive diagnoses prior to being commenced on antihypertensive medication. We observed a high proportion of women with high-risk pregnancies who had been started on antihypertensives by their primary physician. This is likely to become increasingly common, particularly in light of the CHIPS and CHAP studies, which suggest better maternal outcomes without compromising fetal outcomes with well-controlled CH and GH (Citation24,Citation25). This finding is also consistent with the global epidemiological data. One recent review in Nature Reviews Endocrinology suggested two causes for the decreasing burden of morbidity and mortality related to hypertensive disorders in pregnancy in high-income countries (HICs): one, that the incidence of hypertensive disorders of pregnancy in HICs is falling; and two, due to the improving prenatal screening and early-intervention (Citation26). Therefore, while in some HICs the incidence of hypertensive disorders is increasing – such as in the United States, where according to one nation-wise sample of delivery data between 1995 and 2008 the proportion of pregnancies meeting modern primary CH criteria has almost doubled, and meeting modern secondary CH criteria has tripled (Citation27) – overall there may be a disproportionate rise in the proportion of medicated women as primary care physician awareness and screening systems improve.
This has important implications for the utility of the USCOM in predicting PE – for the device to be useful, it would need to predict PE despite the presence of antihypertensive medication in high-risk pregnancies. Although we separately analyzed data on non-medicated women, no significant predictive ability was found. There are multiple potential explanations for this. It may be reflective of the small sample size, or that non-medicated hypertension indicates milder disease which is less likely to progress. However, it may also indicate that broad hemodynamic assessment using the USCOM simply lacks predictive ability.
It has been found that the USCOM is capable of recording consistent readings between different observers in an adult and pediatric ICU setting (Citation28,Citation29). Although our group has previously demonstrated the repeatability of USCOM results in the pregnant population by a single user, it has yet to be demonstrated that USCOM readings are consistent between users in this study population, which may introduce an additional source of variability. This is an important avenue for future work because of the unclear training requirements for the device. The manufacturer recommends only 30 examinations to achieve competency; the recommendations to be found in the literature vary from a training time of 2 weeks (Citation10), 20 to 50 practice examinations (Citation15,Citation30–33), and formal training sessions of varying duration (Citation34,Citation35). Importantly, data would suggest that novices with 30 practice examinations are still unable to record examinations of comparable quality to an expert (>200 examinations) (Citation35). It is possible that more rigorous training requirements and a more formalized system for assessing the quality of a scan, would be of benefit in demonstrating reliability between users.
It may be the case that the USCOM does not prove useful as a predictor of PE. However, this does not rule out comprehensive hemodynamic assessment for this purpose. In addition to accounting for FGR, another interesting avenue of research may be the potential predictive power of trans-thoracic echo in hypertensive pregnancies. It is known that hypertensive disorders of pregnancy involve maladaptive cardiac changes, most severe in PE. In one case series, women with established PE were seen to have higher LV myocardial index, higher relative wall thickness, lower LV global/endocardial/epicardial strain and LV strain rates, and some indication of early diastolic dysfunction (Citation36). To our knowledge, there has been only one study investigating the use of TTE as a predictive tool in this setting. In a cohort of patients with GH at recruitment, TTE demonstrating high SVR and concentric hypertrophy was shown to predict adverse maternal outcomes (however, the study did not isolate which adverse outcome was predicted, which included proteinuria, placental abruption, induced preterm delivery, and post-partum hypertension). Similarly, while LAD, end-diastolic volume, and left atrial maximal area were uniform at the time of GH diagnosis, those patients who developed complications demonstrated changes to the left atrial minimal area and fractional area change, higher interventricular septum diameter, posterior wall diastolic thickness, LVM/LVMi, and were significantly more likely to have developed concentric cardiac geometry (Citation37). It is possible that cardiac maladaptation to pregnancy identified via TTE, in addition to early pregnancy hemodynamic changes, may be of more benefit in predicting PE than the USCOM.
Conclusion
Unfortunately, our data do not suggest that the USCOM device is useful in predicting the development of PE in hypertensive pregnancies. However, we would argue that the USCOM remains an important device for ongoing research, particularly given its portability and ease of use, and may be suitable for further work on directed therapy in hypertensive pregnant women with or without a high SVR state.
Acknowledgments
The authors would like to extend many thanks to the maternity staff at St. George Hospital for helping to facilitate this research.
Disclosure statement
No potential conflict of interest was reported by the author(s).
Data availability statement
The data collected for this study can be accessed by directly contacting the corresponding author.
Additional information
Funding
References
- Brown MA, Magee LA, Kenny LC, et al. The hypertensive disorders of pregnancy: ISSHP classification, diagnosis & management recommendations for international practice. Pregnancy Hyperts. 2018;13:291–10. doi:10.1016/j.preghy.2018.05.004.
- Ukah UV, De Silva DA, Payne B, et al. Prediction of adverse maternal outcomes from pre-eclampsia and other hypertensive disorders of pregnancy: a systematic review. Pregnancy Hyperts. 2018;11:115–123. doi:10.1016/j.preghy.2017.11.006.
- Melchiorre K, Sharma R, Khalil A, et al. Maternal cardiovascular function in normal pregnancy: evidence of maladaptation to chronic volume overload. Hypertens. 2016;67(4):754–762. doi:10.1161/HYPERTENSIOAHA.115.06667.
- Duvekot JJ, Peeters LLH. Maternal cardiovascular hemodynamic adaptation to pregnancy. Obstet Gynecol Surv. 1994;49(Supplement):S1. doi:10.1097/00006254-199412011-00001.
- Melchiorre K, Sutherland GR, Watt-Coote I, et al. Severe myocardial impairment and chamber dysfunction in preterm preeclampsia. Hypertens Preg. 2012;31(4):454–471. doi:10.3109/10641955.2012.697951.
- Valensise H, Vasapollo B, Gagliardi G, et al. Early and late preeclampsia: two different maternal hemodynamic states in the latent phase of the disease. Hypertens. 2008;52(5):873–880. doi:10.1161/HYPERTENSIONAHA.108.117358.
- Guy GP, Ling HZ, Garcia P, et al. Maternal cardiac function at 35–37 weeks’ gestation: prediction of pre-eclampsia and gestational hypertension. Ultrasound Obstet Gynecol. 2017;49(1):61–66. doi:10.1002/uog.17300.
- Saudan P, Brown MA, Buddle ML, et al. Does gestational hypertension become pre-eclampsia? BJOG Int J Obstet Gynaecol. 1998;105(11):1177–1184. doi:10.1111/j.1471-0528.1998.tb09971.x.
- Mangos JG, Pettit F, Preece R, et al. Repeatability of USCOM®-measured cardiac output in normotensive non-pregnant and pregnant women. Pregnancy Hypertens. 2018;12:71–74. doi:10.1016/j.preghy.2018.03.009.
- Kager CCM, Dekker GA, Stam MC. Measurement of cardiac output in normal pregnancy by a non-invasive two-dimensional independent Doppler device. Aust N Z J Obstet Gynaecol. 2009;49:142–144. doi:10.1111/j.1479-828X.2009.00948.x.
- McNamara H, Barclay P, Sharma V. Accuracy and precision of the ultrasound cardiac output monitor (USCOM 1A) in pregnancy: comparison with three-dimensional transthoracic echocardiography. Br J Anaesth. 2014;113:669–676. doi:10.1093/bja/aeu162.
- Khalil A, Goodyear G, Joseph E, et al. PP097. Cardiac output and systemic vascular resistance in normal pregnancy and in control non-pregnant women. Pregnancy Hypertens Int J Womens Cardiovasc Health. 2012;2(3):292–293. doi:10.1016/j.preghy.2012.04.208.
- Chong SW, Peyton PJ. A meta-analysis of the accuracy and precision of the ultrasonic cardiac output monitor (USCOM). Anaesthesia. 2012;67(11):1266–1271. doi:10.1111/j.1365-2044.2012.07311.x.
- McLaughlin K, Snelgrove JW, Sienas LE, et al. Phenotype‐directed management of hypertension in pregnancy. J Am Heart Assoc. 2022;11(7):e023694. doi:10.1161/JAHA.121.023694.
- Vinayagam D, Patey O, Thilaganathan B, et al. Cardiac output assessment in pregnancy: comparison of two automated monitors with echocardiography: CO monitors vs echocardiography in pregnancy. Ultrasound Obstet Gynecol. 2017;49(1):32–38. doi:10.1002/uog.15915.
- Siu CW, Tse HF, Lee K, et al. Cardiac resynchronization therapy optimization by ultrasonic cardiac output monitoring (USCOM) device.Pacing Clin Electrophis. 2007 [[cited 2021 Sep 4]];30(1):50–55. doi:10.1111/j.1540-8159.2007.00579.x.
- Rolnik DL, Wright D, Poon LC, et al. Aspirin versus placebo in pregnancies at high risk for preterm preeclampsia. N Engl J Med. 2017;377(7):613–622. doi:10.1056/NEJMoa1704559.
- Guy G, Leslie K, Diaz Gomez D, et al. Implementation of routine first trimester combined screening for pre‐eclampsia: a clinical effectiveness study. BJOG Int J Obstet Gynaecol. 2021;128(2):149–156. doi:10.1111/1471-0528.16361.
- Allotey J, Snell KI, Smuk M, et al. Validation and development of models using clinical, biochemical and ultrasound markers for predicting pre-eclampsia: an individual participant data meta-analysis. Health Technol Assess. 2020;24(72):1–252. doi:10.3310/hta24720.
- McLaughlin K, Zhang J, Lye SJ, et al. Phenotypes of pregnant women who subsequently develop hypertension in pregnancy. J Am Heart Assoc. 2018;7(14):e009595. doi:10.1161/JAHA.118.009595.
- Mulder EG, Ghossein-Doha C, Cauffman E, et al. Preventing recurrent preeclampsia by tailored treatment of nonphysiologic hemodynamic adjustments to pregnancy. Hypertens. 2021;77(6):2045–2053. doi:10.1161/HYPERTENSIONAHA.120.16502.
- Lowe SA, Bowyer L, Lust K, et al. SOMANZ guidelines for the management of hypertensive disorders of pregnancy 2014. Aust N Z J Obstet Gynaecol. 2015;55(5):e1–e29. doi:10.1111/ajo.12399.
- Tay J, Foo L, Masini G, et al. Early and late preeclampsia are characterized by high cardiac output, but in the presence of fetal growth restriction, cardiac output is low: insights from a prospective study. Am J Obstet Gynecol. 2018;218(5):0.e517.1–0.e517.12. doi:10.1016/j.ajog.2018.02.007.
- Magee LA, Von Dadelszen P, Singer J, et al. The CHIPS randomized controlled trial (control of hypertension in pregnancy study): is severe hypertension just an elevated blood pressure? Hypertens. 2016;68(5):1153–1159. doi:10.1161/HYPERTENSIONAHA.116.07862.
- Tita AT, Szychowski JM, Boggess K, et al. Treatment for mild chronic hypertension during pregnancy. N Engl J Med. 2022;386(19):1781–1792. doi:10.1056/NEJMoa2201295.
- Jiang L, Tang K, Magee LA, et al. A global view of hypertensive disorders and diabetes mellitus during pregnancy. Nat Rev Endocrinol. 2022;18(12):760–775. doi:10.1038/s41574-022-00734-y.
- Bateman BT, Bansil P, Hernandez-Diaz S, et al. Prevalence, trends, and outcomes of chronic hypertension: a nationwide sample of delivery admissions. Am J Obstet Gynecol. 2012;206(2):0.e134.1–0.e134.8. doi:10.1016/j.ajog.2011.10.878.
- van Lelyveld-Haas LEM, van Zanten ARH, Borm GF, et al. Clinical validation of the non-invasive cardiac output monitor USCOM-1A in critically ill patients. Eur J Anaesthesiol. 2008;25(11):917–924. doi:10.1017/S0265021508004882.
- Koh W, Schneider KA, Zang H, et al. Measurement of cardiac output using an ultrasonic cardiac output monitor (USCOM) in patients with single-ventricle physiology. Pediatr Cardiol. 2022;43(6):1205–1213. doi:10.1007/s00246-022-02840-0.
- Dey I, Sprivulis P. Emergency physicians can reliably assess emergency department patient cardiac output using the USCOM continuous wave Doppler cardiac output monitor: USCOM cardiac output assessment in ED. Emerg Med Australas. 2005;17(3):193–199. doi:10.1111/j.1742-6723.2005.00722.x.
- Wong LSG, Yong BH, Young KK, et al. Comparison of the USCOM ultrasound cardiac output monitor with pulmonary artery catheter thermodilution in patients undergoing liver transplantation. Liver Transpl. 2008;14(7):1038–1043. doi:10.1002/lt.21483.
- Huang L, Critchley LAH. Study to determine the repeatability of supra-sternal Doppler (ultrasound cardiac output monitor) during general anaesthesia: effects of scan quality, flow volume, and increasing age. Br J Anaesth. 2013;111(6):907–915. doi:10.1093/bja/aet254.
- Critchley LAH, Huang L. USCOM—window to the circulation: utility of supra-sternal Doppler in an elderly anaesthetized patient for a robotic cystectomy. J Clin Monit Comput. 2014;28(1):83–93. doi:10.1007/s10877-013-9499-5.
- Siu L, Tucker A, Manikappa SK, et al. Does patient position influence Doppler signal quality from the USCOM ultrasonic cardiac output monitor? Anesth Analg. 2008;106(6):1798–1802. doi:10.1213/ane.0b013e3181732127.
- Patel N, Dodsworth M, Mills JF. Cardiac output measurement in newborn infants using the ultrasonic cardiac output monitor: an assessment of agreement with conventional echocardiography, repeatability and new user experience. Arch Dis Child Fetal Neonatal Ed. 2011;96(3):F206–F211. doi:10.1136/adc.2009.170704.
- Buddeberg BS, Sharma R, O’Driscoll JM, et al. Cardiac maladaptation in term pregnancies with preeclampsia. Pregnancy Hypertens. 2018;13:198–203. doi:10.1016/j.preghy.2018.06.015.
- Novelli GP, Valensise H, Vasapollo B, et al. Left ventricular concentric geometry as a risk factor in gestational hypertension. Hypertens. 2003;41(3):469–475. doi:10.1161/01.HYP.0000058001.67791.0A.