
ABSTRACT
Background
The triglyceride-glucose (TyG) index is an alternative biomarker for insulin resistance that may be connected to incident hypertension. We performed the meta-analysis to clarify the connection between TyG index and new-onset hypertension in the general population.
Methods
We recruited cohort studies that assessed the association between TyG index and the risk of hypertension in the general population by searching the databases of PubMed, EMBASE, and Web of Science (SCI) from their inception dates until July 18, 2023. The primary focus of the study was on the hazard ratio (HR) of hypertension in relation to the TyG index. The adjusted HR and 95% confidence interval (CI) were pooled by the random-effects model. Subgroup analyzes stratified by age, sex, follow-up duration, body mass index (BMI), and ethnicity were performed.
Results
Our analysis comprised 35 848 participants from a total of 7 cohort studies. The highest TyG index category showed a 1.51-fold greater risk of hypertension in the general population than the lowest category (HR = 1.51, 95%CI 1.26–1.80, p < .001). Consistent results were obtained using sensitivity analysis by eliminating one trial at a time (p values all <0.001). Subgroup analysis showed that the relationship between TyG index and hypertension was not substantially influenced by age, sex, BMI, participant ethnicity, and follow-up times (P for interaction all >0.05).
Conclusions
Elevated TyG index significantly increased the risk of new-onset hypertension in the general population. It is necessary to conduct the research to clarify the probable pathogenic processes underpinning the link between the TyG index and hypertension.
Introduction
The most common modifiable risk factor for cardiovascular disorders is hypertensionCitation1. It affects approximately 1.28 billion individuals between the ages of 30 and 79 worldwideCitation2 and continues to be the leading contributor to premature death and related disability-adjusted life-yearsCitation3. There is growing evidence that early management for risk factors for hypertension can stop it from developing and lower the chance of developing cardiovascular diseaseCitation4. To offer a preventive intervention, it is essential to identify those at high risk for developing hypertension. At the moment, predicting the likelihood of developing hypertension is primarily dependent on established risk factors like age, dietary salt intake, alcohol consumption, and cigarette smoking. But it continues to be less prognosticCitation5. Therefore, it is necessary and of exceptional significance for clinical practice to identify new predictors of hypertension.
Insulin resistance (IR) has been linked to hypertension and is now recognized as both a pathogenic cause and predictor of hypertensionCitation6. It is a condition characterized by impaired sensitivity and responsiveness of insulinCitation7. However, there aren’t any particular techniques used in clinical settings to accurately determine IRCitation8. The triglyceride-glucose (TyG) index has been identified as a brand-new and trustworthy substitute biomarker for IRCitation9. The TyG index is a composite measure that consists of fasting triglyceride and glucose levels. It is computed as TyG index = Ln [fasting triglyceride (mg/dl) x fasting glucose (mg/dl)/2]Citation10. There is a high correlation between TyG index and the occurrence of cardiovascular disorders, according to growing dataCitation11. However, regarding the TyG index’s ability to predict new-onset hypertension in the general hypertension, there was no clear answer. Multiple cross-sectional studies have provided evidence suggesting a possible correlation between elevated TyG index values and a higher risk of hypertensionCitation12. Nevertheless, it is important to acknowledge that these studies are of a cross-sectional nature, which poses challenges in determining the sequence of events and establishing causal relationships. Several recent cohort studies have been published that explore the association between TyG index and the new-onset hypertension in the general populationCitation13–19. Therefore, we performed a meta-analysis of these cohort studies to clarify the association between TyG index and the risk of new-onset hypertension in general population in order to give more trustworthy information for clinical practice.
Methods
Design of the study and literature search
Ethical approval was obtained by the Institutional Review Board of the First Affiliated Hospital of Chengdu Medical College (CYFYEC-C-F63). The study adhered to the Declaration of Helsinki. The study conducted a systemic review and meta-analysis in accordance with the guidelines outlined in the Preferred Reporting Items for Systematic Reviews and Meta-Analyses (PRISMA)Citation20. The study protocol was registered in PROSPERO (CRD42023447674), an internationally recognized database for prospectively registered systematic reviews). A comprehensive review of the PubMed, EMBASE, and Web of Science databases was performed, covering the period from their established through July 18, 2023. Only studies conducted on human subjects and published in the English language were included after applying filters. The databases were queried using the specified heading terms: “triglyceride-glucose,” “TyG,” “hypertension,” and “high blood pressure.” In addition, a manual search was conducted to discover other qualifying studies by consulting relevant literature references. The titles and abstracts of the literature were subjected to initial screening, followed by the acquisition of full-text articles and their subsequent reading for rescreening. All participants involved in these studies were obtained written informed consent and consent to publish their individual details had been obtained from all participants.
Inclusion and exclusion standards of study
These studies included in the analysis met the following criteria: 1) The study employed a cohort design. 2) The participants enrolled in this trial did not present with hypertension at baseline. 3) The TyG index was assessed in the initial measurement. 4) The objective of this study was to evaluate the correlation between the TyG index and the likelihood of developing hypertension. 5) The primary outcome of interest was adjusted using a multivariate analysis. The exclusion criteria were defined as follows: 1) Conference abstracts presented at academic conferences. 2) Review papers. 3)Non-cohort study design. 4) The data pertaining to the desired outcome was either unavailable or not reported. 5) In cases where multiple reports were found to include the same participants or overlapping people, preference was given to the study with the highest sample size.
Extraction of data and quality assessment
The titles and abstracts of papers were evaluated for eligibility by two writers in a separate and unbiased manner. The researchers involved in this analysis obtained diverse data from each eligible study including the first author, years of publication, sample size, and follow-up duration. Additionally, the authors collected data pertaining to patients’ baseline characteristics, such as age, BMI, proportion of male participants, and the TyG index analysis. Lastly, the outcome measures, specifically the adjusted hazard ratio (HR) and the corresponding 95% confidence interval (CI), were also recorded. The author conducted a comprehensive evaluation of the selected studies and data, which were subsequently evaluated by another author for final inclusion. And inconsistencies that arose were handled through consensus. The methodological assessment of the studies included in the analysis was conducted using the Newcastle – Ottawa Quality scale (NOS) appraisal instrument for cohort studies, as performed by two independent reviewersCitation21. The discrepancies encountered throughout the examination were effectively resolved through a process of dialogue.
Statistical analysis
The statistical analysis in this study were conducted using Review Manager 5.3 and Stata 14.0 software. The TyG index was analyzed as a categorical variable. The HR and 95%CI were calculated for participants with the greatest TyG index level in comparison to those with the lowest TyG index level. The HR and 95%CI were combined using the general inverse variance weighting method, employing either a fixed effects or random effects model based on the level of heterogeneity observed. The index of inconsistency (I2) was employed as a measure to assess the degree of heterogeneity among the studies. The I2 values of 25%, 50%, and 75% correspond to mild, moderate, and severe levels of heterogeneity, respectivelyCitation22. Sensitivity analysis was performed in order to investigate the probable factors contributing to heterogeneity. The assessment of publication bias was conducted by the visual examination of funnel plots. The researchers employed the trim and fill strategy in case when they detected the presence of publication biasCitation23. The researchers conducted pre-defined subgroup analyzes to assess the impact of several study parameters, such as age, BMI, ethnicity, sex of participants, and follow-up durations, on the relationship between the TyG index and the risk of developing hypertension. The statistical tests employed in this study were conducted as two-sided tests, and statistical significance was determined using a threshold of p < .05.
Results
Characteristics of the included studies
illustrated the process employed for selecting the literature in this study. This meta-analysis comprised a total of 35 848 participants across seven investigationsCitation13–19. The mean age of participants in the seven trials varied between 35.8 and 57.2 years. The mean body mass index (BMI) varied between 20.9 and 27.2 kg/m2. The duration of the follow-up period varied between 1.7 and 9 years. Five study participants were recruited from China, while two study participants were recruited from Spain and Singapore, respectively. The assessment of methodological quality using the Newcastle-Ottawa Scale (NOS) suggested that all the literature works included in the study had a high level of quality. displayed the fundamental characteristics of the studies that were included in the analysis.
Figure 1. Flowchart of the study selection process and results.
Table 1. Baseline characteristics of the included studies.
Triglyceride-glucose index and new-onset hypertension
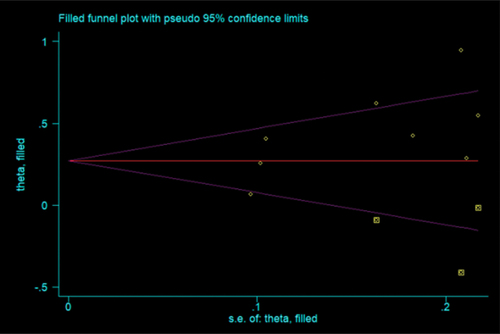
The meta-analysis examined the TyG index as a categorical variable and included seven studies that investigated the relationship between the TyG index and the risk of developing hypertension in the general population. As depicted in , the combined hazard ratio (HR) for the development of new-onset hypertension, when comparing the group with the highest TyG index to the group with the lowest TyG index, was found to be 1.51 (95%CI: 1.26–1.80, p < .001). Nevertheless, a notable degree of heterogeneity was seen among the seven trials, with an I2 value of 68% and a statistically significant P-value of 0.002. The assessment of publication bias was conducted. Upon visual examination, it was seen that the funnel plot exhibited asymmetry, suggesting the existence of publication bias, as depicted in . Following the implementation of the trim-and-fill strategy, the resultant pooled effect size obtained from the fixed-effects model exhibited a close resemblance to the primary outcome (HR = 1.293, 95%CI:1.186–1.410; p = .004)(I2 = 40.75, p < .001). displayed a revised funnel plot subsequent to the inclusion of three simulated missing studies.
Figure 2. Forest plots for the meta-analysis of the association between TyG index and new-onset hypertension in general population.
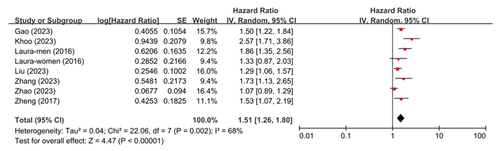
Figure 3. Funnel plots for the meta-analysis of the TyG index and risk of new-onset hypertension.
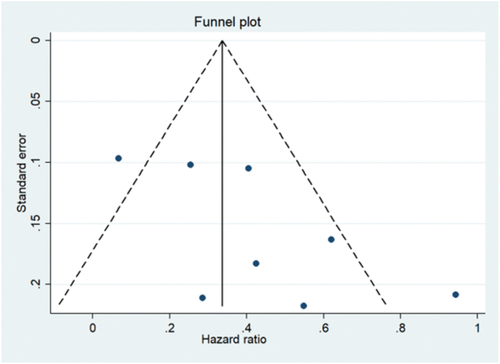
Figure 4. New funnel plot after adding three simulated missing studies.
Sensitivity analysis and subgroup analysis
A sensitivity analysis was conducted to assess the potential impact of excluding a specific study on the overall stability of the combined results derived from the remaining investigations. It was observed that the exclusion of each individual study did not significantly decrease the heterogeneity, with the exception of the study conducted by Zhao et al.Citation16, which resulted in a minor reduction in heterogeneity (I2 = 47%, p < .001), as depicted in . Furthermore, the results of the sensitivity analysis indicated that the exclusion of any individual study did not significantly impact the overall calculation of hazard ratio (HR) for hypertension, as demonstrated in . In the subgroup analysis of the outcome, these studies were categorized based on age (<50 or ≥50), BMI (<24 or ≥24), follow-up period (<6 or ≥6), participant ethnicity (Chinese or Non-Chinese), and sex (male or female). The analysis of revealed no statistically significant changes among the subgroups (both p > .05 for interaction).
Figure 5. Subgroup analysis for the association between TyG index and new-onset hypertension (a. Subgroup analysis according to the age of the participants b. Subgroup analysis according to the BMI of the participants c. Subgroup analysis according to the follow-up duration).
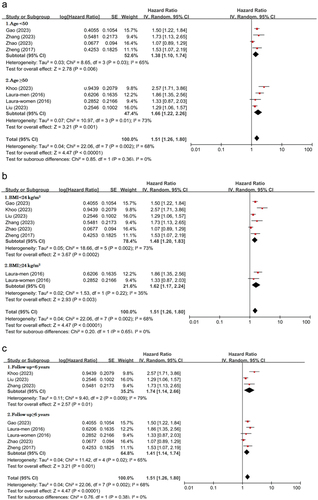
Figure 6. Subgroup analysis for the association between TyG index and new-onset hypertension (D. Subgroup analysis according to the ethnicity of the participants E. Subgroup analysis according to the sex of the participants).
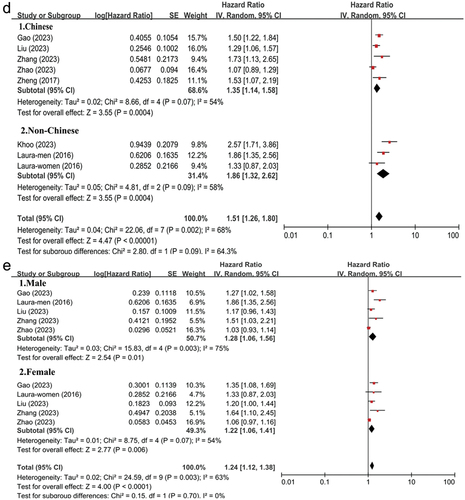
Table 2. Sensitivity analysis of the association between TyG index and new-onset hypertension.
Discussion
To the utmost extent of our understanding, this investigation represented the inaugural meta-analysis of cohort investigations that offered thorough elucidation regarding the correlation between TyG index and the occurrence of hypertension in the general population. A significant correlation was seen between the TyG index and the occurrence of new-onset hypertension, even after adjusting the potential confounding factors. This link remained consistent across different subgroups and was confirmed by sensitivity analysis. Collectively, these findings indicated that the TyG index served as a standalone prognosticator for the likelihood of developing hypertension in the general population.
A prior meta-analysis had documented a correlation between TyG index and hypertensionCitation12. This study provided evidence that an elevated TyG index might be correlated with an increased likelihood of hypertension within the broader adult population. Nevertheless, it was important to acknowledge that a significant proportion of the studies included in the analysis were of a cross-sectional nature, including six out of the total eight studiesCitation12. Additionally, it was crucial to recognize that the observational design employed in these enrolled researches did not permit us to demonstrate a causal relationship between the TyG index and new-onset hypertension. In contrast, our study exclusively incorporated cohort studies, hence mitigating the potential recall bias commonly associated with cross-sectional design studies. Furthermore, it was worth noting that all of these researches had been conducted using multivariate analysis. Hence, the findings of our study had the potential to offer enhanced reliability and persuasive evidence about the association between the TyG index and new-onset hypertension. Although a high heterogeneity was observed in our study, we performed subgroup analysis and sensitivity analysis. The results were robust. In addition, the publication bias was also observed in our study. But we performed the trim-and-fill correction procedure, and the meta-analysis results did not alter. Therefore, we had enough reasons to believe that these findings were reliable.
The possible mechanisms behind the correlation between the TyG index and the development of new-onset hypertension can be elucidated by insulin resistance (IR). The TyG index has been widely recognized as a trustworthy surrogate biomarker for insulin resistance (IR)Citation9. There exists a substantial body of researches indicating that exposure to IR can contribute to the onset and progression of hypertension through its detrimental effects on vascular function and structureCitation24–26. Furthermore, the occurrence of hypertension in individuals with insulin resistance can be attributed to the improper activation of the renin-angiotensin-aldosterone system and sympathetic nervous systemCitation27. Hence, it is plausible that the TyG index may exert an influence on the susceptibility to hypertension via those mechanisms elucidated above. Moreover, numerous investigations have provided evidence indicating that individuals with elevated TyG index exhibit a higher risk for increased arterial stiffnessCitation28. Arterial stiffness is considered to be a risk factor for hypertensionCitation29. This observation provides additional support to our findings in an indirect manner.
Our study had clinical implications, which provided a rationale to consider the elevated TyG index as a valuable predictor of hypertension in general population. It might provide new insights into the primary prevention of hypertension. The utilization of the TyG index within clinical settings has the potential to enhance risk assessment capabilities and facilitate the implementation of personalized preventive measures or treatments for individuals diagnosed with hypertension.
This meta-analysis had several strengths, such as a substantial sample size, a prolonged duration of follow up, and appropriate adjustments for key cardiovascular risk variables. Of course, there were several limitations that must be taken into account. The limited number of included researches hampered the performance of a meta-regression analysis to investigate potential sources of heterogeneity. Furthermore, the dose-response analysis was not conducted to determine if the association between the TyG index and the risk of developing hypertension followed a linear or non-linear pattern, since some studies lacked the required information. Ultimately, our research only focused on the prognostic value of the baseline TyG index among the general population. The impact of longitudinal fluctuations in the TyG index on the likelihood of developing hypertension in the general population was still not fully understood.
Conclusion
It is a substantial correlation between a higher TyG index and a greater likelihood of developing new-onset hypertension among the general population. It can be regarded as a prognostic indicator for the development of hypertension. Additional researches are necessary to clarify potential pathophysiological mechanisms that contribute to the relationship between TyG index and hypertension.
Accessibility of data
The datasets used in the present investigation may be obtained from the corresponding author upon a reasonable request.
Authors’ contributions
CQ.Y and PJ.W contributed to the creation of the research design. CQ.Y and Y.S were actively engaged in the process of data collecting and analysis. CQ.Y contributed to the writing of the text. The manuscript modifying involved the participation of YS and PJW. The article was reviewed by all of the writers.
Disclosure statement
No potential conflict of interest was reported by the author(s).
Additional information
Funding
References
- Mancia Chairperson G, Kreutz Co-Chair R, Brunström M, Januszewicz, A, Muiesan, ML, Tsioufis, K, Agabiti-Rosei, E, Algharably, EAE, Azizi, M, Benetos, A, et al. ESH Guidelines for the management of arterial hypertension the Task Force for the management of arterial hypertension of the European Society of Hypertension Endorsed by the European Renal Association (ERA) and the International Society of Hypertension (ISH). J Hypertens. 2023;41:1874–9. PubMed: 37345492.
- Zhou B, Carrillo-Larco RM, Danaei G, Riley LM, Paciorek CJ, Stevens GA, Gregg EW, Bennett JE, Solomon B, Singleton RK. Worldwide trends in hypertension prevalence and progress in treatment and control from 1990 to 2019: a pooled analysis of 1201 population-representative studies with 104 million participants. Lancet. 2021;398(10304):957–80. doi: 10.1016/S0140-6736(21)01330-1. PubMed: 34450083.
- Forouzanfar MH, Afshin A, Alexander LT, Anderson HR, Bhutta ZA, Biryukov S, Brauer M, Burnett R, Cercy K, Charlson FJ, et al. Global, regional, and national comparative risk assessment of 79 behavioural, environmental and occupational, and metabolic risks or clusters of risks, 1990–2015: a systematic analysis for the global burden of disease study 2015. Lancet. 2016:388(10053);1659–724. 10.1016/S0140-6736(16)31679-8. PubMed: 27733284.
- Oparil S, Acelajado MC, Bakris GL, Berlowitz DR, Cífková R, Dominiczak AF, Grassi G, Jordan J, Poulter NR, Rodgers A, et al. Hypertension. Nat Rev Dis Primers. 2018;4(1):18014. doi:10.1038/nrdp.2018.14. PubMed: 29565029.
- Chowdhury M, Naeem I, Quan H, Leung AA, Sikdar KC, O’Beirne M, Turin TC. Prediction of hypertension using traditional regression and machine learning models: a systematic review and meta-analysis. PLoS One. 2022;17(4):e0266334. doi: 10.1371/journal.pone.0266334. PubMed: 35390039.
- da Silva AA, Do Carmo JM, Li X, Wang Z, Mouton AJ, Hall JE. Role of hyperinsulinemia and insulin resistance in hypertension: metabolic syndrome revisited. Can J Cardiol. 2020;36(5):671–82. doi: 10.1016/j.cjca.2020.02.066. PubMed: 32389340.
- Li M, Chi X, Wang Y, Setrerrahmane S, Xie W, Xu H. Trends in insulin resistance: insights into mechanisms and therapeutic strategy. Signal Transduct Target Ther. 2022;7(1):216. doi: 10.1038/s41392-022-01073-0. PubMed: 35794109.
- Minh HV, Tien HA, Sinh CT, Thang DC, Chen C-H, Tay JC, Siddique S, Wang T-D, Sogunuru GP, Chia Y-C, et al. Assessment of preferred methods to measure insulin resistance in Asian patients with hypertension. J Clin Hypertens. 2021;23(3):529–37. doi:10.1111/jch.14155. PubMed: 33415834.
- Khan SH, Sobia F, Niazi NK, Manzoor SM, Fazal N, Ahmad F. Metabolic clustering of risk factors: evaluation of Triglyceride-glucose index (TyG index) for evaluation of insulin resistance. Diabetol Metab Syndr. 2018;10(1):74. doi: 10.1186/s13098-018-0376-8. PubMed: 30323862.
- Guerrero-Romero F, Simental-Mendía LE, González-Ortiz M, Martínez-Abundis E, Ramos-Zavala MG, Hernández-González SO, Jacques-Camarena O, Rodriíguez-Morán M. The product of triglycerides and glucose, a simple measure of insulin sensitivity. Comparison with the euglycemic-hyperinsulinemic clamp. J Clin Endocrinol Metab. 2010;95(7):3347–51. doi: 10.1210/jc.2010-0288. PubMed: 20484475.
- Ding X, Wang X, Wu J, Zhang M, Cui M. Triglyceride–glucose index and the incidence of atherosclerotic cardiovascular diseases: a meta-analysis of cohort studies. Cardiovasc Diabetol. 2021;20(1):76. doi: 10.1186/s12933-021-01268-9. PubMed: 33812373.
- Wang Y, Yang W, Jiang X. Association between triglyceride-glucose index and hypertension: a meta-analysis. Front Cardiovasc Med. 2021;8:644035. doi:10.3389/fcvm.2021.644035. PubMed: 34136539.
- Gao Q, Lin Y, Xu R, Luo F, Chen R, Li P, Zhang Y, Liu J, Deng Z, Li Y, et al. Positive association of triglyceride-glucose index with new-onset hypertension among adults: a national cohort study in China. Cardiovasc Diabetol. 2023;22(1):58. doi:10.1186/s12933-023-01795-7. PubMed: 36927705.
- Sánchez-Íñigo L, Navarro-González D, Pastrana-Delgado J, Fernández-Montero A, Martínez JA. Association of triglycerides and new lipid markers with the incidence of hypertension in a Spanish cohort. J Hypertens. 2016;34(7):1257–65. doi: 10.1097/HJH.0000000000000941. PubMed: 27136314.
- Zhang J, Wang R, Liu Q, Song G, Tang X. Association of triglyceride-glucose index with incident hypertension among non-overweight healthy adults: a cohort study in China. Nutr Metab Cardiovasc Dis. 2023;33(5):1057–65. doi: 10.1016/j.numecd.2023.02.014. PubMed: 36948935.
- Zhao Y, Yang X, Wu Y, Huang H, Hu F, Zhang M, Sun L, Hu D. Association of triglyceride–glucose index and its 6-year change with risk of hypertension: a prospective cohort study. Nutr Metab Cardiovasc Dis. 2023;33(3):568–76. doi: 10.1016/j.numecd.2022.12.001. PubMed: 36642606.
- Zheng R, Mao Y. Triglyceride and glucose (TyG) index as a predictor of incident hypertension: a 9-year longitudinal population-based study. Lipids Health Dis. 2017;16(1):175. doi: 10.1186/s12944-017-0562-y. PubMed: 28903774.
- Liu T, Xuan H, Yin J, Wang L, Wang C, Xu X, Chen J, Li D, Xu T. Triglyceride glucose index increases significantly risk of hypertension development in Chinese individuals aged ≥45 years old: analysis from the China health and retirement longitudinal study. J Multidiscip Healthc. 2023;16:63–73. doi:10.2147/JMDH.S391905. PubMed: 36660037.
- Khoo JK, Low S, Irwan B, Tang J, Sum CF, Subramaniam T, Lim SC. The role of triglyceride-glucose index in the prediction of the development of hypertension - findings from a community cohort in singapore. J ASEAN Fed Endocr Soc. 2023;38(1):62–67. doi: 10.15605/jafes.038.01.09. PubMed: 37252412.
- Moher D, Liberati A, Tetzlaff J, Altman DG. Preferred reporting items for systematic reviews and meta-analyses: the PRISMA statement. PLoS Med. 2009;6(7):e1000097. doi: 10.1371/journal.pmed.1000097. PubMed: 19621072.
- Stang A. Critical evaluation of the Newcastle-Ottawa scale for the assessment of the quality of nonrandomized studies in meta-analyses. Eur J Epidemiol. 2010;25(9):603–05. doi: 10.1007/s10654-010-9491-z. PubMed: 20652370.
- Higgins JP, Thompson SG, Deeks JJ, Altman DG. Measuring inconsistency in meta-analyses. BMJ. 2003;327(7414):557–60. doi: 10.1136/bmj.327.7414.557. PubMed: 12958120.
- Duval S, Tweedie R. Trim and fill: a simple funnel-plot–based method of testing and adjusting for publication bias in meta-analysis. Biometrics. 2000;56(2):455–63. doi: 10.1111/j.0006-341X.2000.00455.x. PubMed: 10877304.
- Serné EH, Ijzerman RG, de Jongh RT, Stehouwer CD. Blood pressure and insulin resistance: role for microvascular function?. Cardiovasc Res. 2002;55(2):418–19. doi: 10.1016/S0008-6363(02)00436-4. disscusion 420-1 PubMed: 12123783.
- Hill MA, Yang Y, Zhang L, Sun Z, Jia G, Parrish AR, Sowers JR. Insulin resistance, cardiovascular stiffening and cardiovascular disease. Metabolism. 2021;119:154766. doi:10.1016/j.metabol.2021.154766. PubMed: 33766485.
- Boutouyrie P, Chowienczyk P, Humphrey JD, Mitchell GF. Arterial stiffness and cardiovascular risk in hypertension. Circ Res. 2021;128(7):864–86. doi: 10.1161/CIRCRESAHA.121.318061. PubMed: 33793325.
- Jia G, Sowers JR. Hypertension in diabetes: an update of basic mechanisms and clinical disease. Hypertension. 2021;78(5):1197–205. doi: 10.1161/HYPERTENSIONAHA.121.17981. PubMed: 34601960.
- Wu S, Xu L, Wu M, Chen S, Wang Y, Tian Y. Association between triglyceride-glucose index and risk of arterial stiffness: a cohort study. Cardiovasc Diabetol. 2021;20(1):146. doi: 10.1186/s12933-021-01342-2. PubMed: 34271940.
- Safar ME. Arterial stiffness as a risk factor for clinical hypertension. Nat Rev Cardiol. 2018;15(2):97–105. doi: 10.1038/nrcardio.2017.155. PubMed: 29022570.