
 ?Mathematical formulae have been encoded as MathML and are displayed in this HTML version using MathJax in order to improve their display. Uncheck the box to turn MathJax off. This feature requires Javascript. Click on a formula to zoom.
ABSTRACT
We elucidate here the temperature and strain rate sensitivity of a duplex stainless steel through the development of deformation maps and by studying the flow behaviour during hot compression tests in the temperature range of 1223–1473 K and at strain rates between 0.01 and 30 s−1. The flow curves exhibited softening after attaining a peak condition and the flow stress increased with the decrease of temperature and increase of strain rate. The observed change in the activation energy is attributed to strain partitioning between the two constituent phases and the deformation maps were characterised by two regions of flow instability. On the other hand, the microstructural evolution indicated that the strain rate and deformation temperature had a significant impact on the flow behaviour. In the flow stability region, the continuous dynamic recrystallisation (DRX) of ferrite was strongly activated, while in the flow instability region, both the continuous dynamic recrystallisation in ferrite and discontinuous DRX in austenite were weak.
Introduction
Duplex stainless steels (DSSs) have stress corrosion resistance, excellent mechanical properties and good weldability are being considered as alternative to ferritic or austenitic single phase stainless steels [Citation1–3]. Generally, the hot deformation mechanisms of ferrite and austenite are significantly different. In the care of ferrite, the high stacking fault energy (SFE) is responsible for dislocation cross slip or climb, which enhances the hot workability of alloys. In contrast, the austenite undergoes limited dynamic recovery (DRV) due to lower SFE and dynamic recrystallisation (DRX) will not occur until reaching a critical strain [Citation4–8]. When a duplex microstructure is deformed, the coexistence of two phases generally induces strain partitioning during hot deformation, such that the strain is largely considered by the soft ferrite phase at the beginning of hot deformation [Citation9]. As the hot deformation continues, the stress is gradually transferred to austenite, resulting in increase in work hardening and dislocation density of the alloy. But, the difference in flow response mechanism and thermal expansion coefficient between austenite and ferrite reduces the hot workability of the alloys and produces defects on the surface [Citation10].
According to recent studies [Citation11,Citation12], the softening mechanism of each phase in the duplex microstructure during hot deformation is different from single phase stainless steels. DRV and continuous dynamic recrystallisation (CDRX) in DSSs contributed the softness of the ferrite [Citation11]. While austenite was softened by limited DRV, and the DRX of austenite was inhibited by the occurrence of soft ferrite phase [Citation12]. Currently, there is strong focus on the flow behaviour of each constituent phase in DSSs. However, studies on the relationship between process parameters and hot workability under varying conditions of strain rate and deformation temperature are rare and unclear.
The development of processing maps are an important approach to determine safe regions for hot processing and avoid the occurrence of flow instability. For example, processing maps of Ni-based superalloy and proposed optimum parameters of hot processing for the alloy in terms of strain rate and deformation temperature was obtained [Citation13]. Similarly, the effect of strain rate on the processing map of 20.0Cr-1.5Nb-1.0Al-2.5Ti-Ni superalloy and predicted strain rate and deformation temperature conditions to obtain fine homogeneous microstructure was studied [Citation14]. As regards, DSSs, there is lack of fundamental studies on the hot workability of DSS2205 and the relationship between deformation parameters and microstructural evolution and constitute the objective of the present study.
Experimental procedure
The chemical composition of DSS2205 is presented in . The ingots were hot forged into rods in the temperature range of 1323–1423 K and annealed at 1323 K for 300 s followed by quenching using water.
Table 1. Chemical composition (wt.%) of the DSS2205 steel.
Cylindrical specimens were cut to fixed size: diameter is 10 mm and length is 15 mm. Gleeble-3500 was used to carry out hot compression tests. The specimens were heated to 1525 K, held for 350 s, and then cooled at a cooling rate of 5 K/s to the preset temperature. The aim of high temperature was to homogenise the chemical constituent distribution and the microstructure of the original material. Prior to compression tests, each cylindrical sample was held at the preset temperature for 15 s to avoid radial the gradient of temperature. A thermocouple was welded in the middle of the specimens to monitor the actual temperature during the test.
Compression tests were conducted in these conditions: strain rate is from 0.01 to 30s−1, temperature is from 1223 to 1473 K and true strain of 0.4 and 0.8, finally quenched by water. Deformed specimens were sectioned parallel to the deformation axis and electropolished using 90% ethanol and 10% perchloric for electron back-scattered diffraction (EBSD) studies, and electrolytically polished in 6% perchloric acid alcohol solution for optical microscopy observations. The software-Image Pro-Plus was carried out to represent the quantitative characterisation of microstructure.
Results and discussion
Behaviour of flow
The tests of hot compression were carried out. And the true stress-strain curves were obtained (as shown in ). It is clear that the stress of flow increases significantly with the decreasing temperature and increasing rate of strain. Meanwhile, all the curves of flow exhibit softening after a peak point, indicating that DRX may have occurred during hot deformation. However, these curves exhibit some different characteristics, for example, the flow curves indicate a more wavy behaviour at 1373 K/1–30 s−1, while a smooth behaviour with decreasing strain rate.
Figure 1. Flow curves for various deformation conditions. (a) = 0.01 s−1; (b) T ε = 1373 K.
The effect of strain rate and deformation temperature on the flow behaviour can be expressed by the parameter of Zener-Hollomon, Z [Citation15,Citation16]:
where is the strain rate (s−1), Qp (KJ mol−1) is the energy of activation in hot deformation which corresponds to the peak stress. From equation, the higher the rate of strain and the lower the temperature, the larger is the value of Z. The value of Q can be determined by equation of Arrhenius-type [Citation17]:
where α (material constant) is determined by the relationship between σp, lnσp and ln, respectively. Using EquationEquation (2)
(2)
(2) , the values of Q with increasing strain were calculated at different strain rates (as shown in ). For all the strain rates, because of the softening behaviour during compression, the value of Q decreases as compression progresses. At lower strain rate (0.01, 0.1 s−1), the curve decreases in the strain range of 0.1–0.75. However, as the strain rate increases from 1 to 10s−1 and from 10 to 30 s−1, respectively. The decrease in the value of Q is interrupted in the middle or intermediate deformation stage.
Figure 2. The variation of Q with increasing strain at different strain rate. (a) = 0.01 s−1; (b) = 0.1 s−1; (c) = 1 s−1; (d) = 10 s−1; (e) = 30 s−1.
Based on previous studies, an increasing rate of strain enhances the plastic deformation characteristics of austenite in DSSs [Citation12,Citation18]. In the case of duplex microstructure, the coexistence of soft ferrite phase and hard austenite phase during hot deformation often causes strain partitioning during early stages of deformation when strain is largely accommodated by the softer ferrite phase [Citation9]. With increase in strain, the strain is gradually transferred from ferrite phase to austenite phase, resulting in strain energy accumulation at a later stage. As presented in , in the middle or intermediate deformation stage, the Q curves are nearly unchanged by the combination of softening mechanism in ferrite and work hardening in austenite. However, if the deformation parameters used are beneficial to the DRV of ferrite (lower strain rate), the stress in ferrite always remains at a relatively low level, which leads to delay in the transfer of strain to austenite and the ferrite dominates the flow behaviour of the alloy. This causes a continuous decline in the value of Q with strain in the range of 0.1–0.75.
Microstructural evolution
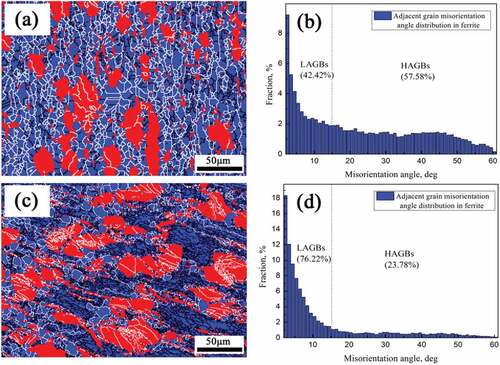
shows EBSD images and corresponding grain misorientation distribution maps of ferrite and austenite for different deformation parameters. The blue and red areas in the EBSD images represent ferrite and austenite phases, respectively. The black lines are low-angle boundaries of grain (θ ≤ 15°) abbreviated as LAGBs, and the white lines are high-angle boundaries of grain (θ ≥ 15°) abbreviated as HAGBs.
Figure 3. EBSD image and adjacent grain misorientation distribution of ferrite (Part I). (a)/(b) 0.01 s−1/1323 K, ε = 0.4; (c)/(d) 0.01 s−1/1323 K, ε = 0.8; (e)/(f) 30 s−1/1323 K, ε = 0.8.
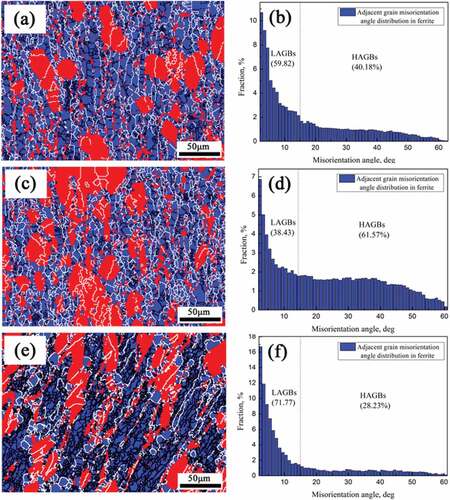
When compression is preformed at a relative low strain rate (0.01 s−1) at 1323 K, as shown in , after straining to 0.4, numerous LAGBs with misorientation angle less than 15° are observed in ferrite, indicating that DRV occurred during this deformation stage by annihilation and rearrangement of deformation induced dislocations. The austenite in the microstructure remains almost undeformed. As strain increases to 0.8 (), the proportion of HAGBs in ferrite is significantly enhanced from ~40% at a strain of 0.4 to ~62%. According to this observation, many dislocations were caused during deformation are constantly absorbed by LAGBs with increasing strain, which leads to variation in misorientation at a relative high temperature and subsequently LAGBs are gradually transformed to HAGBs [Citation19]. In summary, in ferrite, there are a large number of new equiaxed grains after compression there are nucleated by the interaction between deformation-induced dislocations and LAGBs. This phenomenon is commonly referred as CDRX [Citation20]. However, at higher strain rate (30 s−1), as discussed above, lower strain partitioning, CDRX accompanied by transformation form LAGBs to HAGBs in ferrite is weakened, as shown in . This is apparent on comparing with strain rate of 0.01 s−1. The proportion of HAGBs in ferrite after straining to 0.8 decreases to ~28%, representing a decline in the degree of CDRX in ferrite. As regards, austenite, there are still no DRX grains at the deformed grain boundaries.
Thus, it is inferred that at a given deformation temperature, the degree of dynamic softening in ferrite becomes weak with increase in rate of strain. Given that the strain is mainly regulated by soft ferrite phase during the early deformation stages, thus, as shown in the TEM image (), after straining to 0.4, in austenite, the dislocation density continues to be low. When the rate of strain increases, as shown in ), the dislocations in austenite are entangled and the density of dislocations is significantly enhanced. At higher strain rate, the lower strain partitioning in ferrite not only weakens the degree of CDRX, but increases work hardening of austenite to some extent. Undoubtedly, this is the main reason why the continuous decrease of Q was interrupted in the intermediate deformation stage, as shown in .
Figure 4. TEM micrographs of the alloy after straining to 0.4 at 1323 K. (a) = 0.01 s−1; (b) ε = 10 s−1.
At high strain rate (30 s−1), when the deformation temperature increases to 1423 K, and the strain is 0.8, the proportion of HAGBs in ferrite was increased to 35% which is significantly higher than at 1323 K, as shown in . In contrast, when the temperature decreases to 1223 K (the lowest deformation temperature), as shown in , the proportion of HAGBs in ferrite was rapidly decreased to 15%, which suggests that increasing the temperature is beneficial to CDRX of ferrite. Moreover, when the deformation temperature decreases in the range of 1473 ~ 1223 K, the proportion of austenite was increased from ~35% to ~50% as measured by Image Pro-Plus, consistent the previous studies [Citation12,Citation21]. It was shown that the phase fraction of austenite increases with the decrease of deformation temperature in the range of 1223–1473 K. Thus as shown in ), the higher phase fraction and increased strain energy at lower temperature [Citation18], a small number of DRX grains nucleate and grow at high-energy sites such as grain boundaries, which forms a necklace-type structure in austenite. This is referred as DRX which is discontinuous (DDRX) and often occurs in the low SFE materials including γ-Fe or copper [Citation22,Citation23]. Thus, it can be concluded that at a given rate of strain, the decreasing temperature reduces the CDRX in ferrite and induces DDRX in austenite in comparison to higher temperature.
Figure 5. EBSD image and grain misorientation distribution of ferrite (Part II). (a)/(b) 30 s−1/1423 K, ε = 0.8; (c)/(d) 30 s−1/1223 K, ε = 0.8.
Processing maps
Analysis of the theory
Generally during the hot deformation, strain rate and temperature of deformation are two major factors that influence hot workability and microstructural evolution of the material. Thus, selection of processing parameters is the most important aspect in hot working process. Processing maps based on dynamic materials modelling and dynamic modelling provide guidelines for the selection of parameters for hot processing of alloys.
Processing maps represent the applied deformation conditions of the material, which obtained based on the PDM (power dissipation map). Constitutive equations can characterise the response of material in terms of the effective flow stress. The following power-law equation is used [Citation24]:
where M relates to the workpiece processing history. K and m are constants. According to the materials dynamic modelling, during processing, the absorbed energy by the workpiece is mainly dissipated: through consumption during deformation and microstructure transformation [Citation24]. Thus, the absorbed energy is determined by:
where J is the energy consumed during structural transformation, G is the consumed energy during plastic deformation, and P is the total energy absorbed. Thus, the ratio of J and G can be determined by sensitivity (m) of strain rate:
Thus,
To determine the consumed energy during microstructural transformation process, the value of power dissipation can be described by the parameter η. This can be determined by:
In the power dissipation maps, a larger value of η corresponds to larger consumed energy during microstructural transformation, and the effect of softening is also activated. Thus, the optimum hot processing parameters is governed by the maximum value of η. However, the instability of flow can sometimes enhance the value of parameter η in the domain of instability. Accordingly, process instability maps are necessary. Moreover, the corresponding Prasad criterion [Citation25] can be expressed by:
In the formula, during hot processing, when the change in entropy is less than the rate of strain in the system, the ξ which is less than zero corresponding that the instability of flow will occur.
Power dissipation and LnZ relationship
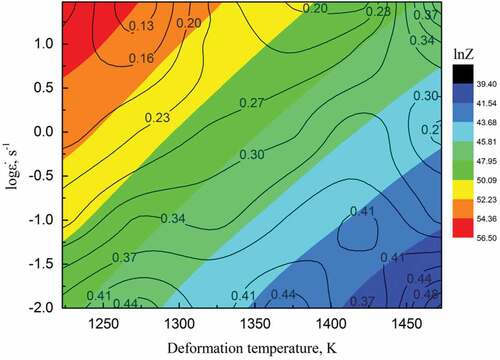
Based on the above discussion, first the power dissipation contour map with the strain of 0.5 overlapped by the LnZ map is presented in . The results showed that the dissipation of power changes with change of LnZ, and the value of dissipation (η) of power increases with decreasing LnZ. Accordingly, a decreasing Z replaces a lower rate of strain and higher deformation temperature, which enhances the migration of grain boundaries and dislocations and leads to activation of DRV/DRX of the alloy, especially ferrite. During this process, the stress concentration at the grain boundary is released, which leads to increase in the proportion of energy consumed by structural transformation [Citation26–28]. In contrast, when compression occurs with increasing Z, as shown in ), CDRX of ferrite is significantly suppressed, this introduces a high level of strain energy in the alloy and decreases the energy consumed by structural transformation.
Figure 6. The power dissipation contour map with strain of 0.5 overlapped with LnZ map.
Characteristics of processing map
presents the processing maps of DSS2205 plotted by the superposition of instability map and power dissipation map at strains of 0.2, 0.4, 0.5 and 0.8, respectively. As shown in , the regions with negative ξ values changes with increase of strain. ) shows that the regions of instability of flow appear at relative high rate of strain and has two regions. Accordingly, region 1 corresponds to the deformation temperature range of 1260–1300 K, and logarithm of strain rate varies from 0.75 to 1.47. The strain rate logarithm value range of 0.45 to 1.47 and range of deformation temperature is 1360–1440 K corresponds to region 2. However, as the increasing strain, the flow instability regions exhibit significant variation, as seen in . After strain of 0.8, the area of region 2 has gradually narrowed and nearly disappeared. In contrast, as presented in , the region 1 is increased and not reduced with increasing strain.
Figure 7. Processing maps plotted by the superposition of power dissipation map and instability map at varying true strain. (a) ε = 0.2; (b) ε = 0.4; (c) ε = 0.5; (d) ε = 0.8.
As discussed above, at the beginning of deformation, the strain is almost accommodated by soft ferrite phase [Citation17,Citation29–31]. At higher strain rate, dislocation annihilation is somewhat suppressed because of lack of sufficient response time in comparison to lower strain rate, which causes intense stress concentration at the grain boundaries, which makes the value of ξ relatively low. But as strain increases, a significant difference is noted with change of temperature. If compression is preformed at a relatively high temperature, which are presented in ) and (d), CDRX of ferrite is activated with increase of strain, which effectively releases the stress concentration in the alloy and improves the ductility of the material during the deformation. But, when the temperature decreases to 1323 K, as presented in , CDRX of ferrite is significantly weakened, which is unfavourable to the flow stability during processing.
However, when the temperature continues to decrease to the lowest point, the compression process is safe. As shown above, the effect of austenite on the flow behaviour is improved at relative low temperature and high strain rate because of increased phase proportion and strain partitioning. On straining to 0.8 at the lowest temperature ()), partial DDRX of the austenite is activated, which together with CDRX of ferrite avoids the presence of negtive ξ and successfully ensures hot processing.
Thus, it can be concluded that for DSS2205, the flow instability mainly occurs at high strain rate during the early deformation stages. At relatively high temperature, for example 1360–1440 K, ferrite phase mainly dominates the flow behaviour of DSS2205 because of high proportion and strain accommodation. But as strain increases, CDRX occurs in ferrite and gradually improves the flow stability of the alloy and increases the value of ξ. When the temperature starts to decrease and the strain rate is relatively high, the CDRX of ferrite is weakened even at the last stage of deformation. Thus, it can be seen from the processing maps that the area of region 1 is increased, and not reduced. shows microstructural characteristics of the microcrack obtained at 1323 K/10 s−1, which is consistent with the analysis of the processing map. It is shown, that the microcrack nucleated at the phase boundaries and propagated along the interface into the soft phase of ferrite.
Figure 8. Microcrack in the alloy deformed at 1323 K/10 s−1.
Conclusions
Hot compression tests were carried out on DSS2205 in the strain rate range of 0.01–30 s−1 and range of temperature is from 1223 to 1473 K. The corresponding processing maps and flow behaviour of alloy was studied. The primary conclusions are:
1. The flow stress of DSS2205 increased with increased strain rate and decrease of temperature. The flow curve exhibited softening after attaining a peak, and had a wavy shape at 1373 K/1-30 s−1, while it was smooth with decreasing strain rate.
2. The value of activation energy (Q) with strain rate followed Arrhenius-type equation. At lower strain rate, ferrite dominated the softening behaviour of the alloy, which caused a continuous decrease in the value of Q in the strain range of 0.1–0.75. In contrast, when the strain rate was increased, the degree of CDRX in ferrite was weakened. Meanwhile, the influence of austenite on the flow behaviour was improved, which led to work hardening of the microstructure and interrupted continuous decline in the value of Q when the strain was in the range of 0.3–0.6.
3. During compression, the value of power dissipation increased with decreasing LnZ because of the effect of strain rate and deformation temperature on the alloy flow behaviour. The processing maps indicated that at the beginning of deformation stage, flow instability had two kinds of regions. The first region: temperature range is from 1260 to 1300 K and in the strain rate logarithm range of 0.75 to 1.47. The second region: occurred in the temperature range of 1360 to 1440 K and in the strain rate logarithm range of 0.45 to 1.47. With the increases of strain, the area of first region was increased. In contrast, the second region area was gradually narrowed and nearly disappeared after straining to 0.8.
4. Microstructural characteristics indicated that when hot compression was carried out in the flow stability region, CDRX of ferrite was highly activated, Furthermore, when the deformation parameters corresponding to the flow instability were used, dynamic softening of the two phases was weakened and microcrack was observed. The microcrack nucleated at the interphase boundaries and propagated along the interface into the soft phase of ferrite.
Acknowledgments
This research was funded by the National Natural Science Foundation of China, grant number 52005304, National Natural Science Foundation of China (52175342), The Natural Science Foundation of Shandong (ZR2021ME129). The authors are grateful to R.D.K. Misra for continued collaboration and contribution to meaningful discussion.
Disclosure statement
No potential conflict of interest was reported by the author(s).
Data availability statement
The raw/processed data required to reproduce these findings cannot be shared at this time as the data also forms part of an ongoing study.
Correction Statement
This article has been corrected with minor changes. These changes do not impact the academic content of the article.
Additional information
Funding
References
- Lee S, Lee S, De Cooman B. Austenite stability of ultrafine-grained transformation-induced plasticity steel with Mn partitioning. Scr Mater. 2011;65(3):225–10.
- Shi J, Sun X, Wang M, et al. Enhanced work-hardening behaviors and mechanical properties in ultrafine-grained steels with large-fractioned metastable austenite. Scr Mater. 2010;63(8):815–818.
- Nakada N, Mizutani K, Tsuchiyama T, et al. Difference in transformation behavior between ferrite and austenite formations in medium manganese steel. Acta Mater. 2014;65:251–258.
- Lee S, Lee S, Kumar S, et al. Localized deformation in multiphase ultra-fine-grained 6 pct Mn transformation-induced plasticity steel. Metall. Mater Trans A. 2011;42A:3638–3651.
- Li Z, Misra RDK, Ding H, et al. The significant impact of pre-strain on the structure-mechanical properties relationship in cold-rolled medium manganese TRIP steel. Mater Sci Eng A. 2018;712:206–213.
- Cao R, Liang J, Li F, et al. Intercritical annealing processing and a new type of quenching and partitioning processing, actualized by combining intercritical quenching and tempering, for medium manganese lightweight steel. Steel Res Inter. 2019;1900335. 1–7.
- Yan N, Di H, Misra RDK, et al. Enhancing austenite stability in a new medium-Mn steel by combining deep cryogenic treatment and intercritical annealing: an experimental and theoretical study. Mater Sci Eng A. 2019;75:11–21.
- Tsuchiyama T, Inoue T, Tobata J, et al. Microstructure and mechanical properties of a medium manganese steel treated with interrupted quenching and intercritical annealing. Scr Mater. 2016;12:236–239.
- Li Z, Zhang X, Mou Y, et al. The impact of intercritical annealing in conjunction with warm deformation process on microstructure, mechanical properties and TRIP effect in medium-Mn TRIP steels. Mater Sci Eng A. 2019;746:363–371.
- Qi X, Du L, Hu J, et al. Effect of austenite stability on toughness, ductility, and work-hardening of medium-Mn steel. Mater Sci Technol. 2019;35(17):2134–2142.
- Su G, Gao X, Zhang D, et al. Impact of reversed austenite on the impact toughness of the high-strength steel of low carbon medium manganese. JOM. 2018;70(5):672–679.
- Yamanaka S, Iwamoto T, Sawa T. Study on capturing transformation thermomechanical behaviour of TRIP steel during impact compression. Mater Res Innov. 2011;15(sup1):131–134.
- Zhao K, Chang Y, Hu P, et al. Influence of rapid cooling pretreatment on microstructure and mechanical property of hot stamped AHSS part. J Mater Process Tech. 2016;228:68–75.
- Li X, Chang Y, Wang C, et al. Comparison of the hot-stamped boron-alloyed steel and the warm-stamped medium-Mn steel on microstructure and mechanical properties. Mater Sci Eng A. 2017;679:240–248.
- Wu Z, Tang Y, Chen W, et al. Exploring the influence of Al content on the hot deformation behavior of Fe-Mn-Al-C steels through 3D processing map. Vacuum. 2019;159:447–455.
- Liang Z, Li Y, Huang M. The respective hardening contributions of dislocations and twins to the flow stress of a twinning-induced plasticity steel. Scr Mater. 2016;112:28–31.
- Han J, Nam J, Lee Y. The mechanism of hydrogen embrittlement in intercritically annealed medium Mn TRIP steel. Acta Mater. 2016;113:1–10.
- Kamoutsi H, Gioti E, Ding H. Kinetics of solute partitioning during intercritical annealing of a medium-Mn steel. Mater Trans A. 2015;46A:4841–4846.
- Srivastava A, Bhattacharjee D, Jha, et al. Microstructural and mechanical characterization of C-Mn-Al-Si cold-rolled TRIP-aided steel. Mater Sci Eng A. 2007;445-446:549–557.
- Dijk N, Butt A, Zhao L, et al. Thermal stability of retained austenite in TRIP steels studied by synchrotron X-ray diffraction during cooling. Acta Mater. 2005;53(20):5439–5447.
- Challa V, Wan X, Somani M, et al. Significance of interplay between austenite stability and deformation mechanisms in governing three-stage work hardening behavior of phase-reversion induced nanograined/ultrafine-grained (NG/UFG) stainless steels with high strength-high ductility combination. Scr Mater. 2014;86:60–63.
- Li Z, Zhang X, Mou Y, et al. Design of an effective heat treatment involving intercritical hardening for high strength-high elongation of 0.2C-1.5Al-(6- 8.5)Mn-Fe TRIP steels: microstructural evolution and deformation behavior. Mater Sci Technol. 2020;36(4):500–510.
- Wei X, Fu R, Li L. Tensile deformation behavior of cold-rolled TRIP- aided steels over large range of strain rates. Mater Sci Eng A. 2007;465(1–2):260–266.
- Tian R, Li L, Wei X, et al. Effect of temperature and strain rate on dynamic properties of low silicon TRIP steel. J Iron steel Res. Inter. 2006;13(3):51–56.
- Kim M, Park T, Baik K, et al. Crucial microstructural feature to determine the impact toughness of intercritically annealed medium-Mn steel with triplex-phase microstructure. Acta Mater. 2019;164:122–134.
- Han J, Silva A, Ponge D, et al. The effects of prior austenite grain boundaries and microstructural morphology on the impact toughness of intercritically annealed medium Mn steel. Acta. Mater. 2017;122:199–206.
- Kuzmina M, Ponge D, Raabe D. Grain boundary segregation engineering and austenite reversion turn embrittlement into toughness: example of a 9 wt.% medium Mn steel. Acta. Mater. 2015;86:182–192.
- Lacroix G, Pardoen T, Jacques P. The fracture toughness of TRIP-assisted multiphase steels. Acta Mater. 2008;56(15):3900–3913.
- Neeraj T, Srinivasan R, Li J. Hydrogen embrittlement of ferritic steels: observations on deformation microstructure, nanoscale dimples and failure by nanovoiding. Acta Mater. 2012;60(13–14):5160–5171.
- Misra RDK, Challa VSA, Injeti VSY. Phase reversion-induced nanostructured austenitic alloys: an overview[J]. Mater Technol. 2022;37(7):2983–2994.
- Das A, Tarafder S. Geometry of dimples and its correlation with mechanical properties in austenitic stainless steel. Scr Mater. 2008;59(9):1014–1017.