
 ?Mathematical formulae have been encoded as MathML and are displayed in this HTML version using MathJax in order to improve their display. Uncheck the box to turn MathJax off. This feature requires Javascript. Click on a formula to zoom.
ABSTRACT
The paper describes high cycle rotational bending fatigue (HCF) performance and fracture characteristics of 718Plus alloy at 600°C and 700°C, where the relationship between maximum cyclic stress (S) and fatigue cycles (N) at 600°C and 700°C is explored. We drew S-N curves, and established mathematical model, with simulating S-N curve function. The crack initiation of smooth specimens focus on the surface or subsurface, where the stress concentration caused by inclusions, carbides and microstructure defects, leading to tearing, and inclusion is the main form of crack initiation. In addition, the high cycle fatigue life of 718Plus alloy is greatly affected by the microstructure defects. According to the analysis of high cycle fatigue fracture morphology, at 700°C, the alloy fatigue crack growth is faster, and the number of secondary cracks is more than 600°C. Thus, the growth behaviour is greatly affected by temperature.
Introduction
In recent years, with the rapid development of aviation industry, the structure and service conditions of turbines and compressors have become more and more complex [Citation1,Citation2]. Nickel-based superalloy not only has great strength and toughness in a high-temperature environment, but also has great fatigue property, crack resistance and high damage tolerance, which is widely used in the aviation field [Citation3–5]. Developed by Cao and Kennedy, the new turbine disc deformation superalloy material, called 718Plus superalloy, can withstand the complex interaction of fatigue, creep and oxidation at high temperatures ranging from 400°C to 700°C [Citation6]. Due to its good mechanical properties and low manufacturing cost, 718Plus alloy has effectively filled the temperature gap between IN718 and Waspaloy alloy for a long time, and has been gradually applied to the manufacturing of aeroengine parts.
Fatigue failure is a critical issue in the aerospace industry. According to statistics, 50 percent of major aircraft accidents are caused by fatigue failure of parts [Citation7]. Therefore, HCF properties at high temperature as an important index of aero-engine materials has attracted more and more attention [Citation8,Citation9]. Reasonable data analysis method is very important to predict the fatigue properties of superalloy. At present, many empirical equations have been developed to reveal the fatigue law of materials, the most important of which is the relationship between fatigue stress level and failure cycle times, is characterised by various S-N curves, which is the main tool for analysing and predicting the high-cycle fatigue life of alloys. As the high-temperature HCF test cycle times of 718Plus alloy is 105 ~ 107, it takes a long time. In addition, compared with the test environment at room temperature, additional heating and temperature control system should be considered in high-temperature fatigue test, which has high cost, the number of tests is usually small, and the detected data are discrete points. Therefore, the mathematical model is established and finally drawn into a continuous S-N curve, which is more reliable than the discrete data points. Compared the damage evolution curve of the alloy, the fatigue life of the alloy can be accurately predicted without adding other parameters and modifying S-N curve [Citation10]. Some studies showed that non-proportional cyclic loading and loading sequence conditions of superalloys have significant effects on fatigue properties and creep effects [Citation11]. Liu et al. [Citation12] introduced a new critical fatigue parameter, which considered the influence of phase difference and cyclic loading conditions of superalloy. This model has better prediction effect than Smith-Watson-Topper (SWT) and Fatemi-Socie (FS) models when predicting the fatigue life of GH4169 superalloy.
Under cyclic stress loading, the crack initiation of superalloy generally appears on the surface or sub-surface of the sample, and the crack initiation is usually accompanied by severe plastic deformation. Relevant studies have shown that inclusions, irregular carbides and precipitation γ and γ’ have a greater impact on crack growth and secondary cracks of materials [Citation13]. 718Plus superalloy contains more γ’ phase and less γ” phase than IN718 superalloy. The γ’ phase can achieve better microstructure stability at high temperature in the alloy [Citation14]. Zhang et al. [Citation15] studied the crack initiation of 718Plus alloy under high cyclic loading at 650°C, and the crack initiation was mainly at the inclusion. The influence of inclusions on fatigue life will be reduced if the cleanliness of superalloy melting is well controlled. The study of L. Viskari et al. [Citation16] showed that under cyclic loading conditions, the fracture surface of 718Plus alloy was mainly mixed and propagated across grain boundaries, and the secondary crack initiated and propagated along the interface between the component phase and the matrix. Creep effect exists in 718Plus alloy at high temperature. As the number of fatigue cycles increases, the fracture morphology is mostly characterised by intergranular fracture, and the crack propagates roughly along radial direction and towards centre of the circle [Citation17]. Nanostructured stainless steels processed by the novel concept of phase reversion exhibited fracture characteristics similar to fatigue striations in nickel-based superalloys [Citation18].
In this paper, the rotational bending fatigue (HCF) properties of 718Plus superalloy were tested at 600°C and 700°C. Combined with the fracture morphology, the initiation locations and modes of fracture initiations at different temperatures were studied. The crack propagation mechanism at different temperatures was meticulously observed, and the effects of crack initiations and crack propagation paths on the properties of HCF were discussed. The study of the high-cycle fatigue life properties at different temperatures, fracture forms and crack propagation mechanism is of great significance for the long-term and extensive application of 718Plus components, and it is of reference significance for the improvement of 718Plus alloy properties and material preparation technology.
Experimental materials and procedure
Materials
The experimental 718Plus alloy was prepared by vacuum induction melting (VIM-50) and vacuum are remelting (VAR,K-DHM-600, Jinzhou Tian Yu Electric Stove Co., LTD, Jinzhou, China). Then the 50 kg ingot was homogenised by heating and rolled into a bar with a diameter of 40 mm, which was cut from the bar after heat treatment and processed into a high-temperature spin bending fatigue specimen. The chemical composition of the researched alloys is shown in .
Table 1. Chemical composition of the 718Plus alloy used in the study (in wt%).
The bar samples were subjected to solution heat treatment at 954°C for 1 hour, air-cooled, then held at 788°C for 8 hours, followed by cooling at 56°C/h in the furnace to 704°C and held for 8 hours, and finally air-cooled to room temperature. The microstructures of the alloy samples were analysed by optical microscope (OM, XTL-16, Shanghai Zhuanlun Optical Instruments, Shanghai, China), scanning electron microscope (SEM, JSM-6700 F, Japan) and transmission electron microscope (TEM, JEM2100PLUS, Japan).
Rotational bending fatigue test
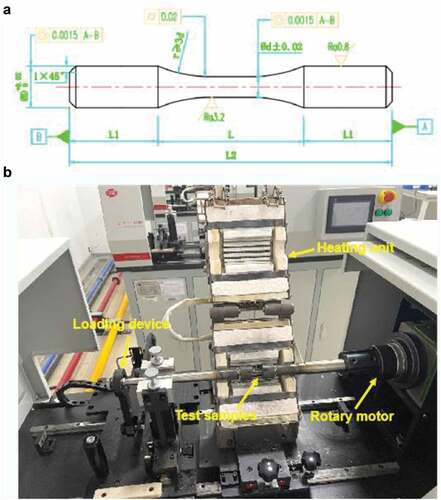
The samples were made into high-temperature rotary bending samples as shown in , and the bending fatigue (HCF) properties of 718Plus at 600°C and 700°C was measured by high temperature cantilever rotary bending fatigue testing machine (QBWP-10000), as shown in . The maximum load of the testing machine is 25 N, the minimum load unit is 0.01 N, the accuracy is ± 0.1%, each weight combination meets any loading requirements between 0.01 N and 25 N, the test temperature range is 300 ~ 1000°C, the accuracy is ±15°C. The loading mode is sinusoidal wave, and the loading frequency can be controlled from 1500 to 8000 r/min by adjusting the speed. The finite fatigue life and infinite fatigue life of the alloy were tested by the test machine, and the mathematical model was established to analyse the S and N data. The group method was used to test the finite fatigue life. The test conditions at 600°C and 700°C were the same except for the ambient temperature; that is, the rotation speed was 5000 r/min, and the stress ratio was R = −1. The up and down method is used to measure the data of infinite fatigue life range. 25 or 50 MPa is taken as a stress step, and the first sample is randomly selected. The estimated average fatigue strength is taken as the first stress to conduct the test at the given cycle number (107 cycles). Then a second sample is randomly selected for the test. If the previous sample passes, the stress level is increased by one stress level, and if the sample fails, the stress level is decreased by one stress level until all the samples are tested in this way.
Figure 1. (a) Test specimens for rotational bending fatigue tests at high temperature, (b) High-temperature cantilever rotating bending fatigue testing machine.
Transmission electron microscopy (TEM, JEM2100PLUS) was used to characterise the microstructure of 718Plus alloy samples. The samples were taken from the alloy samples that had been tested. Cut thin slices with a thickness of 0.5 mm with a WEDM, and then use a rubber to press the thin slices on 500 ~ 1000 mesh sandpaper and rub (coarse thinning). After rubbing to 50 ~ 150 μm, use a punching machine to punch the rubbed thin slices into regular thin slices with a diameter of 3 mm. Automatic Twin-Jet Electropolisher (TJ100-BE) was used to thin the sheet by electrolysis to make the surface of the sheet appear microholes. The electrolyte was a mixture of 20% perchloric acid and 80% ethanol, the voltage was 22 V, and the experimental temperature was −20°C. Liquid nitrogen was used to cool the electrolytic chamber. After thinning, the specimens were observed by transmission electron microscopy at an accelerated voltage of 200 kV.
Results
The microstructure of 718Plus superalloy
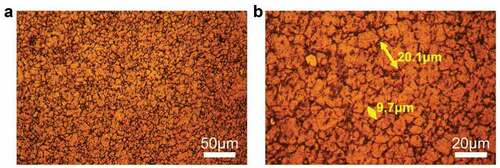
shows the microstructure images of 718Plus superalloy specimens under OM. It can be found from that after VIM+VAR treatment, the microstructure of 718Plus alloy is uniform with less inclusions. Through the measurement of grain size, it can be seen that the grain size of the superalloy prepared in this experiment is ~9.7–20.1 μm ().
Figure 2. The microstructure of 718Plus alloy was characterised by OM: (a) The overall morphology of the sample grains, (b) Observation diagram of sample grain size.
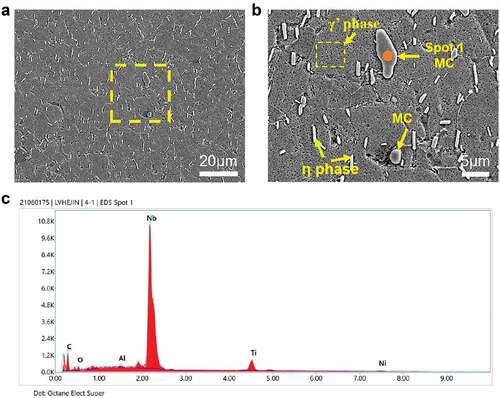
shows the microstructure picture of 718Plus superalloy under SEM. On the whole, after vacuum melting and electroslag remelting, the purity of the alloy is high, and no large inclusions are found in the limited field of view. A large number of γ ‘phase, η phase and less carbides are found in the alloy after solution and aging treatment, as shown in . is a local enlarged view. The carbides shown in arrows are elliptic and spherical. EDS test () shows that the carbides are MC type, mainly NbC and TiC. The precipitated γ’ phase is spherical, small and uniform, with the size less than 1 μm, and mainly distributed in the crystal interior. The η phase is rod-like or plate-like and mainly distributed along grain boundaries. Wang et al. [Citation19] showed that the precipitation of η phase was at the expense of γ’ strengthening phase; that is, η phase was transformed from γ’ phase, which could improve the plastic deformation ability of grain boundaries. At the same time, the precipitation of η phase at the grain boundary can block the grain boundary slip and inhibit the crack propagation, which is beneficial to relieve the stress concentration and improve the performance of alloy.
Figure 3. The microstructure of 718Plus alloy was characterised by SEM: (a) Diagram of composition and distribution of each phase of the sample, (b) Partial enlargement of panel A, and (c) EDS spectrum of Spot 1 in Figure B.
High-temperature bending fatigue properties of 718Plus superalloy
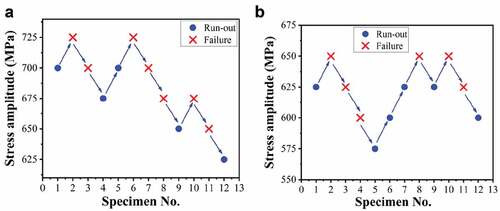
The processed alloy samples were clamped on the cantilever rotating bending fatigue test machine with high-temperature heating and holding furnace (). After clamping, the coaxiality of samples on test machine was measured. After meeting the coaxiality requirements, the heating device was installed to raise the temperature, and test parameters were set when temperature reached test requirements. Before the test, fatigue strength of alloy under 107 cycles was estimated according to the material composition and related technical indexes, and 3–5% of the estimated value was selected as the stress step of the lifting method test. Twelve samples were tested at 600°C, and the infinite fatigue strength range (i.e. the fatigue limit) of the superalloy was detected by the ‘up and down method’, as shown in . When 700 MPa stress was applied at 600°C and no fracture occurred after 107 cycles, the sample would have infinite life by default. After the last 12 samples were measured, the corresponding stress amplitudes were weighted to obtain the high cycle fatigue limit of the alloy at 600°C. Similarly, the weighted average stress amplitude of 700°C was calculated, as shown in . The results show that the fatigue limit of 600°C and 700°C samples for 107 cycles is ~683 MPa and ~621 MPa, respectively. In other words, when the temperature increases by 100°C, the high cycle fatigue limit decreases by ~62 MPa. The temperature has a significant effect on the HCF performance of 718Plus superalloy at 107 cycles. The effect of temperature on the HCF performance of 718Plus superalloy must be considered when it is in service.
Figure 4. Test the fatigue limit of superalloy by ‘up and down method’: (a) 600°C and (b) 700°C.
shows the test data collected from the rotational bending fatigue test of 718Plus superalloy at 600°C and 700°C, respectively, which are drawn into scatter plots, mathematical models are established and S-N curves are drawn, in which each point represents a fatigue sample. The red rectangle point data in the figure is the test of finite fatigue life, that is, the maximum stress test that fails within 107 cycles. It can also be seen from that S-N curve of 718Plus superalloy has a plateau at 600°C and 700°C, which is consistent with the general characteristics of high cycle fatigue of high-temperature alloys.
Figure 5. The rotating bending fatigue test data of 718Plus superalloy: (a) Finite and infinite fatigue life data statistics chart at 600°C, and (b) finite and infinite fatigue life data statistics chart at 700°C.
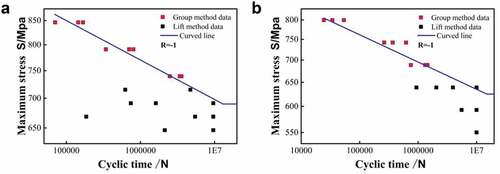
After the data is obtained, a mathematical model is established and an S-N curve is drawn to analyse the relationship between stress and fatigue life:
In the formula: ,
, a and b are constants, N: cycle times, S: stress level.
Estimation coefficient of S-N average curve:
In the formula: ,
,
,
.
where n is the number of all data points.
Logarithmic fatigue life standard deviation of the mean S-N curve :
In the formula: n-2 is the degree of freedom.
Standard deviation of fatigue strength:
After the above mathematical calculations, the S-N relationship formulas of 718Plus alloy at 600°C and 700°C are finally obtained:
T=600°C:LogN=13.5455–0.0134×S
T=700°C:LogN=16.6688–0.0150×S
According to the above fitting function, the fatigue curve of 718Plus alloy at different temperatures, LogN and the applied stress amplitude are in line with the linear function relationship, but the higher the fatigue loading temperature, the larger the intercept of linear function, and the smaller of slope.
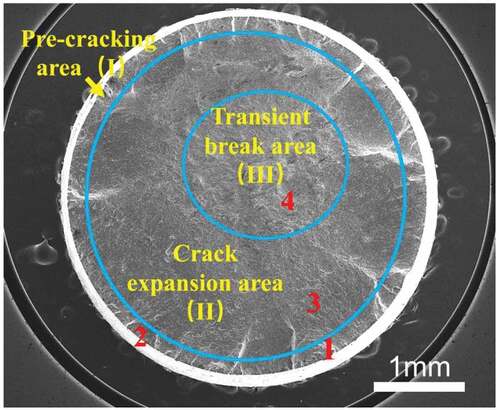
The microstructure of 718Plus superalloy after VIM+VAR and corresponding heat treatment is relatively uniform, and the crack initiation source of rotational bending fatigue fracture of the alloy is generally on the surface or sub-surface of the sample. The fracture principles of fatigue specimens at different temperatures are basically the same. shows the fracture morphology of a typical specimen with flexural fracture, which can be divided into three regions: crack pre-crack zone (region I), crack propagation zone (region II) and final transient fracture zone (region III). Positions 1 and 2 marked in correspond to the two initial positions of the pre-crack zone (region I), position 3 corresponds to the crack growth zone (region II) and position 4 corresponds to the transient fault zone (region III).
Figure 6. Fracture morphology of rotating bending fatigue specimens in 718Plus superalloy at high temperature.
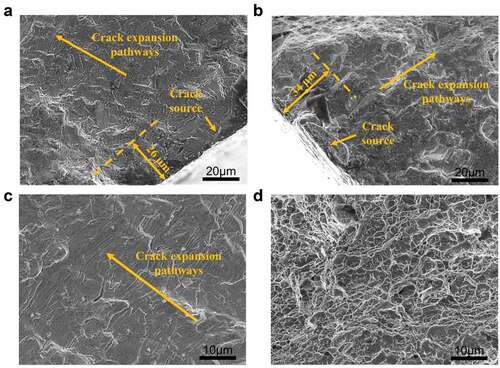
shows the local fracture morphology of 718Plus high-temperature fatigue fracture. According to , it can be observed that the pre-crack zone of this type of material is ~100 μm, and there may be multiple crack initiations. From , it can be found that severe plastic deformation can be observed in the crack initiation region, resulting in a new fracture surface. From , many parallel fatigue striation can be clearly observed. Since the normal direction of the striation is consistent with the local crack propagation direction, the local crack propagation direction can be marked according to the normal direction of fatigue striation. The directions of crack propagation point to the final transient region. shows the dimple morphology of the final transient fracture zone. By tracing the crack propagation paths of the same fracture at different fracture sources, it is shown that the crack initiation position of superalloy is generally not limited to a single position, and the crack propagation path extends from the edge pre-crack zone to the central instantaneous break zone.
Figure 7. The local fracture morphology of 718Plus high-temperature fatigue fracture, where a, b, c, d correspond to the positions 1, 2, 3, 4 in , respectively.
Discussion
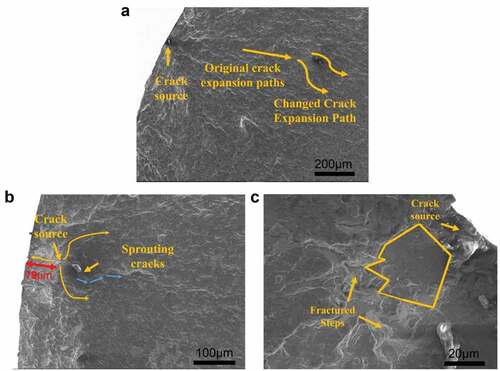
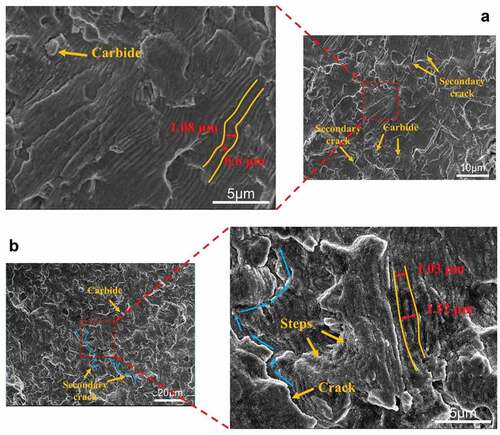
shows the initiation location and morphology of fatigue crack in the precrack zone (region I in ) of the high-temperature flexural fatigue test. shows the fracture morphology of the test rod with a stress amplitude of 750 MPa and a fatigue life of 2.796 × 10⁶ cycles at 600°C. The arrow shows the crack initiation, which is the stress concentration zone caused by inclusions. Under cyclic alternating loading, the superalloy is prone to crack and propagate along the interface between inclusion and matrix. The inclusions in the section can block the initial propagation path of the fatigue fringe and start a new crack propagation along the direction of the stress concentration caused by the inclusions, as shown in the arrow. shows the fracture morphology with a stress amplitude of 800 MPa and a fatigue life of 3.41 × 10⁴ cycles at 700°C. The crack initiation of this fracture is located at the subsurface ~79 μm away from the sample surface, and granular carbide exists at the crack initiation. Because of carbon and alloy matrix combined with the poor interface effect, rotating bending torque force is bigger, can cause stress concentration around carbide, the resulting can tear the shear stress of matrix, tearing cracks, and along the carbide and matrix interface extension, figure in the blue arrows indicate the direction along the interface crack, the crack initiation than fracture has obviously raised as a whole. shows the fracture morphology with a stress amplitude of 700 MPa and a fatigue life of 1.857 × 10⁶ cycles at 600°C. The initiation of the fracture is located on the surface, and the fracture notch is in the shape of a sheet (yellow coil area). A step-like fracture notch can be observed around the sheet tissue. The fracture may be caused by the stress concentration caused by the defect of the surface, which leads to the fracture of the specimen caused by the slip plane slice. Comparing HCF cycle time under the same test conditions, the fatigue cycle time with the above three fracture characteristics are all lower. According to the statistics, inclusions were found in most of the pre-crack zones (region I in ), so it was concluded that inclusions were the main cause of crack initiation. In addition, the comprehensive fracture form of stress concentration and slip plane caused by surface defects has a great influence on the fatigue life of the alloy. Two of the other three samples passed 107 cycles under the same test conditions, so the initiation mode and propagation path of the crack initiation have a great influence on the high-cycle fatigue properties of the alloy.
Figure 8. Fatigue fracture morphology of 718Plus superalloy: (a) surface crack initiation caused by inclusions, T = 600°C, S = 750 MPa, N = 2.796 × 10⁶, (b) initiation of subsurface crack initiation, T = 700°C, S = 800 MPa, N = 3.41 × 10⁴, (c) Crack initiation of surface defect initiation, T = 600°C, S = 700 MPa, N = 1.857 × 10⁶.
shows the fatigue striation often appearing at the fracture of HCF crack stage II (region II in ), and the fatigue striation are some parallel stripes. The morphology of the striation is not only the basis for judging the direction of crack propagation, but also an important characteristic for reflecting the properties of HCF alloy. shows the fatigue fracture at 600°C. The morphology of the fracture is a ring striation, which contains a strip of secondary cracks. The secondary cracks exist in the crack growth ‘step’, that is, the height difference between the fatigue striation, or in the junction of the two groups of fatigue striation with large differences in the growth direction (the normal direction of the fatigue bands). It can be seen from the figure that the secondary crack at 600°C is caused by the large gap in crack propagation direction, and the crack size is small and the expansion is poor. The local enlarged view of the red box in shows that carbide can break the original expansion path of the parallel fatigue striation and expand along the edge of the carbide, which is similar to the effect of carbide in the crack initiation. Three parallel fatigue strips were randomly selected and their width was measured to be ~0.8 μm. shows the fatigue fracture of 718Plus superalloy at 700°C, and the microstructure of the fracture changes greatly when the temperature increases. Judging from the brightness and darkness of the images in SEM, the height difference between each group of parallel strips is large, and the second crack increases, and the crack expands along the crack growth step at the edge of multiple groups of fatigue strips (as shown by the blue arrow). The expansion path of the secondary crack at the ‘step’ can be clearly observed from the local enlarged view in .Three parallel fatigue striations were randomly selected in the enlarged image, and their width was measured to be ~2 μm. With the increase of ambient temperature, the spacing of fatigue striations and the degree of secondary crack propagation increase obviously, and the spacing of fatigue striations and the degree of secondary crack growth promote each other to a certain extent, so the temperature has a great influence on the crack propagation characteristics of the 718Plus alloy.
Figure 9. Fatigue streaks and secondary cracks of 718Plus superalloy at different temperatures: (a) T = 600°C, S = 850 MPa, N = 1.91 × 10⁵, (b) T = 700°C, S = 800 MPa, N = 3.14 × 10⁴.
shows the comparison of the fatigue limit of 718Plus superalloy with other alloys at different temperatures. It can be seen from the figure that the fatigue limit (≥107 cycles) of 718Plus superalloy is significantly higher than that of other alloys at the same temperature. Why does 718Plus superalloy have such high fatigue strength at high temperature? This can be explained from two aspects: first, the grain size of 718Plus alloy is fine, as shown in , with the grain size ranging from 10 to 20 μm; Second, the second phase in the alloy hinders dislocation movement.
Figure 10. Comparison of fatigue limit of 718Plus superalloy with other alloys at different temperatures.
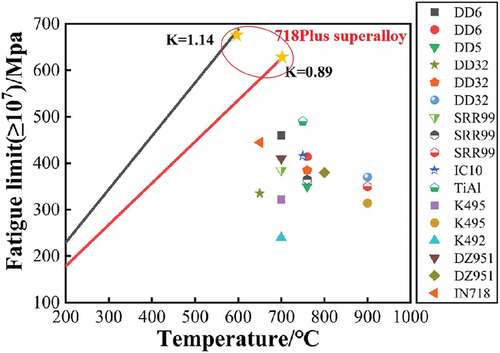
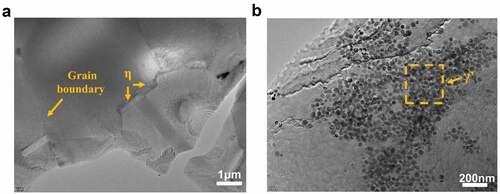
Due to the limited characterisation ability of SEM images corresponding to each phase, the size of γ’ phase is too small to observe, so TEM is used to characterise the alloy microstructure more finely. shows the morphological characteristics of phase η and γ’ under TEM. In , the η phase with a length of ~1 μm is in the shape of a short rod or lath, distributed along the grain boundary (the grain boundary is shown by the arrow), which can play a good role in pinning the grain boundary. The black spheroids in are γ’ phase with diameters ranging from 15 nm to 40 nm. Relevant studies have shown that η phase precipitates at the grain boundary, and several η phases can be generated to hinder the movement of dislocation, inhibit grain boundary slip and crack propagation, and significantly reduce the concentrated stress and notch sensitivity [Citation6]. Therefore, the fatigue ultimate strength of 718Plus superalloy over 107 cycles at the same temperature is higher than that of other superalloys.
Figure 11. TEM characterisation of η phase and γ’ phase (a) morphology and distribution of η phase, (b) morphology and distribution of γ’ phase.
Conclusion
In this paper, the high cycle fatigue properties of 718Plus alloy at 600°C and 700°C were systematically studied. The mathematical model was used to analyse the measured S-N data. The analysis and data statistics of multiple crack initiation initiations are carried out. Combined with the fracture morphology, the crack propagation characteristics at two different temperatures were compared, and the factors affecting the fatigue properties of the materials were discussed. The conclusions were as follows:
(1) After mathematical simulation calculation and analysis, the S-N relationship corresponding to 600°C and 700°C is and
, and the fatigue ultimate strength is ~683 MPa and ~621 MPa determined by the lifting method.
(2) The analysis of macroscopic fatigue fracture morphology shows that the crack initiation initiation is generally located on the surface or subsurface of smooth specimens, and the crack initiation is mainly near inclusions, structural defects and irregular carbides. Combined with the data statistics of multiple crack initiations, inclusion is the main type of crack initiation. In addition, cracks caused by structural defect have a great impact on the fatigue properties of 718Plus alloy.
(3) The analysis of the crack propagation path and characteristics of fatigue fracture at different temperatures shows that each group of parallel fatigue strips is annular at 600°C, the fatigue stripes are closely arranged, the spacing is small and the stripes are long, the secondary cracks are short, and the expansions are poor. At 700°C, the parallel fatigue strips show a large spacing of flaky parallel stripes, and the gap between each group of fatigue strips is large. The secondary cracks extend along the boundary of the gap between the fatigue strips, and the secondary cracks are longer and have good expansions.
Acknowledgments
The authors acknowledge College of Materials Science and Engineering of Qingdao University of Science and Technology. This study was funded by Shandong Natural Science Funds (ZR2020ME009). The authors are grateful to Professor R.D.K. Misra for valuable insights and meaningful discussion.
Disclosure statement
No potential conflict of interest was reported by the author(s).
Additional information
Funding
References
- Hu D, Yang Q, Liu H, et al. Crack closure effect and crack growth behavior in GH2036 superalloy plates under combined high and low cycle fatigue. Int J Fatigue. 2017;95:90–10.
- Jiang S, Zhang Y, Zhu X, et al. Physical mechanisms of nanocrystallization of a novel Ni-based alloy under uniaxial compression at cryogenic temperature. Mater Charact. 2016;116:18–23.
- Holländer D, Henkel D, Kulawinski D, et al. Investigation of isothermal and thermo-mechanical fatigue behavior of the nickel-base superalloy IN738LC using standardized and advanced test methods. Material Sci Engineer. 2016;670:314–324.
- Lin Y.C., Li, Ling, He, Daoguang, Chen, Mingsong, Liu, Guoqiang, et al. Effects of pre-treatments on mechanical properties and fracture mechanism of a nickel-based superalloy. Mat Sci Eng. 2017;679. doi:10.1016/j.msea.2016.10.058 .
- Zhang X, Wang X-C, Li H-C, et al. Fatigue behavior and bilinear Coffin-Manson plots of Ni-based GH4169 alloy with different volume fractions of delta phase. Mater Sci Eng. 2017;682:12–22.
- Wang M, Du J, Deng Q. The Influence of Oxygen Partial Pressure on the Crack Propagation of Superalloy under Fatigue-Creep-Environment Interaction. Mat Sci Eng. 2021;31:140903.
- Gustafsson D, Lundstroem E. High temperature fatigue crack growth behaviour of Inconel 718 under hold time and overload conditions. Int J Fatigue. 2013;52:157.
- Kunz L, Lukas P, Konecna R. High-cycle fatigue of Ni-base superalloy Inconel 713LC. Int J Fatigue. 2010;32:908–913.
- Shen Y, Zhang -C-C, Zhang P-Y, et al. Fatigue life prediction of nickel-based GH4169 alloy on the basis of a multi-scale crack propagation approach. Eng Fract Mech. 2018;199:29–40.
- Mikkelsen O, Siriwardane SC, Mikkelsen O, et al. A new nonlinear fatigue damage model based only on S-N curve parameters. Int J Fatigue. 2017;103:327.
- Yan C. Multiaxial fatigue behavior of Ni-based superalloy GH4169 at 650 °C. Mat Sci Eng. 2006;432:312–338.
- Liu J, Zhang Z, Li B, Lang S, et al. Multiaxial Fatigue Life Prediction of GH4169 Alloy Based on the Critical Plane Method. Metals - Open Access Metallurgy J. 2019;9(2):255.
- Wang M, et al. A Review on 718Plus, the New Superalloy: performance, Aerospace Application and Development Trend. Rapid Prototyp J. 2017;28:1509.
- Hosseini SA, Abbasi SM, Madar KZ, et al. The Effect of Boron and Zirconium on Wrought Structure and γ-γ′ Lattice Misfit characterization in Nickel-Based Superalloy ATI 718Plus. Mater Chem Phys. 2018;211:302–311.
- Zhang L, Wu XR, Huang XY, et al. Fractographical Investigation on High-Cycle Fatigue Behavior of Direct Aging GH4169 Superalloy. Mater Sci Forum. 2014;789:627–632.
- Viskari L, Cao Y, Norell M, et al. Grain boundary microstructure and fatigue crack growth in Allvac 718Plus superalloy. Mater Sci Eng. 2011;528(6):2570–2580.
- Wang JG, Wang H, Kang Y, et al. Multiaxial Fatigue Fracture Analysis of GH4169 Suppalloy at High Temperature. Res Explorat Lab. 2007;26:183
- Misra RDK, Challa VSA, Injeti VSY. Phase reversion-induced nanostructured austenitic alloys: an overview. Mater Technol. 2022;37(7):437–449.
- Alabbad B, Tin S. Effect of grain boundary misorientation on η phase precipitation in Ni-base superalloy 718Plus. Mater Charact. 2019;151:53–63.