
 ?Mathematical formulae have been encoded as MathML and are displayed in this HTML version using MathJax in order to improve their display. Uncheck the box to turn MathJax off. This feature requires Javascript. Click on a formula to zoom.
ABSTRACT
Microencapsulation technology has found widespread applications in current fields of food industries. In this study, by combining water-in-oil emulsion with drop-on-demand (DOD) technique, we successfully produced sodium alginate (SA) shell microcapsules containing peppermint oil (PO). Response surface methodology (RSM) was employed to optimize the surfactant used for nanoemulsification. A comprehensive investigation into the morphology, structure, and encapsulation efficiency of resulting microcapsules was conducted. The study revealed that various parameters, especially of Hydrophilic-Lipophilic Balance (HLB) values, can affect the physical properties of PO/SA nanoemulsion. The optimized formulation achieved emulsions with a mean droplet size of 46.60 nm. Microcapsules with different shell/core ratios (2, 1, and 0.5) were prepared by pulse duration of 20 ms, exhibiting varying antibacterial activities against Escherichia coli in subsequent tests. This work confirms the feasibility of nanoemulsion-DOD system, highlighting the potential of PO/SA microcapsules as a more environmentally friendly alternative to conventional antimicrobials.
Introduction
Microencapsulation is the process in which droplets or particles in the size of several or hundreds of micrometres are enclosed into a shell, mostly made of inert material [Citation1]. Its primary purpose is to shield these sensitive compounds from the physical and chemical factors in the environment, prevent any loss of volatile components and facilitate precise release of the encapsulated substances, such as plant-extracted essential oils, vitamins, pharmaceuticals, and dyes [Citation2–5]. On account of different microencapsulation methods prevailing in recent years (including solvent evaporation, polymerization, co-extrusion, spray drying, etc.) [Citation6–9], the shape of microcapsules varies, from commonly spherical/granular to lumpy/flaky [Citation10]. Drop-on-demand (DOD), which was initially considered an inkjet printing technique, has been adopted for the fabrication of microcapsules, 3D biomaterials and even cells [Citation11–13]. By virtue of rapid prototyping capability and uncomplicated apparatus, DOD has enabled the high-throughput and cost-effective production of microcapsules [Citation14].
Alginate is a popular chemical used for immobilizing or encapsulating a wide variety of compounds. In contrast to its sodium counterpart, which is water-soluble, alginate rapidly gels upon contact with bivalent ions like Ca2+ owing to ionic cross-linking reaction [Citation15]. Due to its exceptional biocompatibility, alginate gel has gradually emerged as a preferred material in the study of DOD system. Many researchers have reported its performance for DOD process, and the dependence of size and shape of the microcapsules on the alginate solution concentration, calcium chloride solution concentration, droplet dispensing velocity, and solution viscosity [Citation16–18].
Microencapsulation using alginate consists of two primary steps. Firstly, disperse alginate in the form of a solution among the capsule contents. Secondly, induce the gelation by the contact between the composite solution and cross-linking agent, such as calcium chloride, resulting in the core contents encapsulated within the alginate shell of which the molecular chain is formed like the structure of eggbox [Citation19]. Prior to the adoption of DOD for the production of microcapsules, the critical challenge lies in achieving homogeneous and stable mixing of core contents with alginate in liquid form. Peppermint oil (PO), one of the most well-known essential oils, has been extensively researched and elucidated regarding its antibacterial mechanism, thanks to the work of B. Pavlic et al. and J. Kang et al. [Citation20,Citation21]. Given the poor water solubility and high volatility, essential oils have few potential uses. Building an effective delivery method that maximizes the potential of PO is crucial for ensuring the effectiveness of essential oils and increasing the stability of volatile components [Citation22]. Surfactants can be used to facilitate the formation of a homogeneous and stable emulsion system composed of essential oils and alginate solutions, as a prerequisite for subsequent microencapsulation. Simultaneously, maximizing the emulsion stability duration and minimizing emulsion droplet size can greatly support pre-storage as well as enhance microencapsulation efficiency. The use of composite surfactants with suitable HLB values plays a pivotal role in improving the aforementioned properties and reducing energy input during emulsification [Citation23].
This study aims to prepare a homogeneous and stable peppermint oil/sodium alginate (PO/SA) emulsion system and utilize DOD technology to produce PO/SA microcapsules. During emulsion preparation, the investigation focused on the impact of variables such as the formula of composite emulsifiers (Tween80-Span80), surfactant-to-oil phase ratio, oil-to-water phase ratio, and emulsification temperature on the physical properties of the emulsion. Response surface methodology (RSM) techniques were employed to identify the optimal parameter combinations. By adjusting the pulse duration to control the droplet volume during the DOD process, microcapsule size, shape, and encapsulation efficiency were evaluated. Furthermore, the present work has explored the differential antimicrobial performance of microcapsules with different shell/core ratios.
Materials and methods
Materials
Peppermint oil (PO) was obtained from Jiangxi Cedar Natural Medicinal Oil Co., Ltd (Ji’an, China). The non-ionic surfactant polyoxyethylenesorbitan monooleate (Tween 80, 1.064 g/cm3, HLB value of 15) and sorbitan monooleate (Span 80, 0.99 g/cm3, HLB value of 4.3) were purchased from Sigma-Aldrich Pte. Ltd., Singapore. Alginic acid sodium salt from algae (marine) in powder form was purchased from Sigma-Aldrich Pte. Ltd., Singapore. Calcium chloride (anhydrous, powder, ≥ 97%) was purchased from Sigma-Aldrich Pte. Ltd., Singapore. Deionized water was produced by Heal Force® SNW Ultrapure Water System, and the resulting water resistivity was 18.2 MΩ-cm, with pH value of 7.
Preparation of peppermint oil/sodium alginate nanoemulsion and microcapsules
PO/SA nanoemulsion was prepared by high-speed shearing. The oil phase consists of PO, of which the mass fraction was 50 wt.%, and the mixture of Span80 and Tween80, as the composite surfactant used for promoting emulsification. Alginic acid sodium salt was dissolved in deionised water at ratios of 2:7, 1:8, 0.5:8.5 (w/w) to obtain the alginate solution as an aqueous phase. PO/alginate nanoemulsion was formed by dropping the alginate solution into the oil at the ratio of 9:1 (w/w) under the stirring (IKA® EuroStar 60 Digital Homogenizer equipped with IKA® ULTRA-TURRAX® Disperser Rotor). Keep 2000 rpm stirring for 15 min after the addition of alginate solution, and then the resulting nanoemulsion was further subjected to ultrasonication for 10 min to obtain the nanoemulsion with dispersed droplets. PO/SA microcapsules were prepared through DOD inkjet machine. 5 g fresh PO/SA nanoemulsion was extruded drop by drop at a rate of 600 drops/min into 40 mL 0.5 M calcium chloride cross-linking solution. The size of microcapsules was dependent on the volume of nanoemulsion passing through the valve, which is controlled by the duration of every pulse. Upon the droplets falling into the CaCl2 solution, spherical microcapsules form instantaneously.
Effect of surfactants
HLB value of the composite surfactant used has a significant effect on emulsion stability. The closer the HLB value of oil and surfactant, the more stable emulsion we can get. In this dual-surfactant situation, the HLB value of composite surfactant can be calculated by EquationEquation 1(1)
(1) :
By adjusting the ratio of Span 80 to Tween 80 from 0:10 to 5:5 (w/w), an optimal emulsion could be achieved, with the suitable size of oil droplets and sufficient duration of being stable for subsequent encapsulation. The mixing ratios and HLB values of composite surfactants are listed in .
Table 1. HLB values of composite surfactants prepared by various ratios of span/Tween.
Observation of appearance
Approximately 5 mL of each fresh PO/SA nanoemulsion was transferred to a glass sample vial, 6 hours later after preparation, which was then sealed at room temperature for 7 days. The transformation of appearance was monitored during this process.
Droplet size and polydispersity index measurements
A laser diffraction instrument (Zetasizer Nano ZS, Malvern Instruments Co., Ltd., England) was used to determine the mean oil droplet size (z-average diameter) and polydispersity index (PDI) by Dynamic light scattering (DLS). The instrument contains a 4 mW He-Ne laser operating at 633 nm wavelength. The nanoemulsions to be measured were diluted 1000 times with deionised water prior to the dynamic light scattering. The size of the droplet should not be significantly changed by the dilution process [104]. Final results of all groups were determined as the average from five replicates.
Effect of pulse duration
Pulse duration of the valve in DOD system determines the volume of every droplet, which is related to the size of microcapsules fabricated. In this study, the pulse duration was designed in the range of 10–100 ms, of which the effect on the appearance of PO/SA microcapsules was investigated.
Morphology of wet and dry microcapsules
Fresh microcapsules were examined using upright optical microscope (Olympus BX53, Japan) with a 10 times objective. Images at ten different random areas were taken and analysed using the built-in functions of ImageJ software. The centre of mass of each microcapsule was determined by CAXA software prior to the measurement of average diameter and aspect ratio. Six line segments (Di) were drawn through the centre of mass of each microcapsule at 30° intervals, and the average diameter (D) was calculated following the equation(2) below. For the aspect ratio (A) of the microcapsules, the shortest (Ds) and longest diameter (Dl) are drawn through the centre of mass within the microcapsule and the value of the aspect ratio is then calculated according to the equation(3). A total number of 50 microcapsules were measured in each sample group.
Surface topographies of PO/SA microcapsules at different core/shell ratios were characterized by FESEM (S-4300, Hitachi, Japan). The samples were dried at room temperature for 24 h, followed by sputter coating with gold at 10 mA for 30 s. Images of different magnifications were taken at a voltage of 11 kV.
Encapsulation efficiency measurement
The evaluation of the encapsulation efficiency of PO/SA microcapsules was carried out as follows: Absorbance of the nanoemulsion of 40 mL 0.5 M CaCl2 containing 0.5 g oil phase was measured by using UV-Vis spectrophotometer (Shimadzu UV-3600, Japan) from the wavelength of 260 nm to 400 nm, and the reference curve was obtained by imaging of pure 0.5 M CaCl2 solution. After determining the exact wavelength corresponding to the maximum absorbance, the PO nanoemulsion absorbance-concentration fit curve was obtained by measuring PO/CaCl2 nanoemulsion with different concentrations. The cross-linking solution, reacted with PO/SA nanoemulsion and centrifuged at 5000 rpm for 30 min, was measured at the specific wavelength and the absorbance was compared to the fit curve above to obtain the concentration of PO nanoemulsion contained at this time, which was then collected to calculate the encapsulation efficiency.
Evaluation of antimicrobial property
1 g PO/SA microcapsules were added to 5 ml sodium chloride-peptone buffer solution with bacterial (E. coli) concentration of 1 × 10⁶ cfu/ml, determined by using UV-Vis spectroscopy at a wavelength of 600 nm. The bacterial suspension was placed on a constant temperature shaker under 37°C at 200 r/min for 24 h. The obtained bacterial suspension was collected and diluted 1000-fold. Subsequently, 50 μl of each sample was evenly spread on the Mueller-Hinton agar culture medium. After incubating at 37°C for 24 hours, the distribution of bacterial colonies was observed to assess the antimicrobial activity of the samples.
Statistical analysis
Preparation condition for producing the PO/SA nanoemulsion was evaluated, modelled and optimized by using Box-Behnken design (BBD), one of the designs applied for quadratic response surface methodology in Software Design Expert 10.0.1. Testing results were presented as mean ± standard deviation (SD) of independent experiments. One-way analysis of variance (ANOVA) was used for group means-testing. In all cases, p < 0.05 was considered as a statistically significant difference.
Results and discussion
Optimization of PO/SA nanoemulsion
DLS testing was conducted for each of PO/SA nanoemulsion samples to investigate the effect of composite surfactants on the droplet size of nanoemulsions. This is so as to determine the surfactant composition that is most desirable, allowing for further investigation on the processing conditions targeted at microencapsulation. Lowering droplet size allows the fabrication of smaller PO microcapsules in the future. PDI is another important indicator that shows the width or spread of the particle size distribution, representing the heterogeneity of a nanoemulsion sample. Polydispersity can occur due to size distribution in a sample or agglomeration or aggregation of the sample during isolation or analysis. The PDI value may vary from 0 (monodisperse particles) to 1 (fully aggregation) [Citation24,Citation25]. In this test, the default parameters are surfactant HLB value = 13.93, emulsification temperature = 25°C, ratio = 0.5, oil phase/emulsion ratio = 0.10, which means the other three parameters are fixed at the above level when one parameter is under one-way analysis.
shows that when the HLB value dropped from 15 to 13.93, the mean droplet size dropped by 74.2%, from 218.7 nm to 56.5 nm, which is the minimum droplet size observed. This suggested that the interfacial tension was weakened between peppermint oil and sodium alginate solution during this process. The larger mean droplet size of peppermint oil was observed with the increasing HLB value from 13.93. PDI experienced a similar fluctuation with the adjusting of HLB value of composite surfactants. Variations in emulsification temperature exhibit an intriguing influence on the mean droplet size, with a minimal impact on the PDI. Specifically, a sharp reduction in the mean droplet size was observed as the temperature increased from 5°C to 25°C (). This may be due to the low temperature; the poor mobility of surfactants resulted in incomplete emulsification. In fact, in the process of dropping sodium alginate solution into peppermint oil phase, the mixture was bathed in cold water. Coagulation and agglomeration of SA/PO were observed in suspension during the phase transition. show the similar effects of the PO/oil phase ratio and the oil phase/emulsion ratio on the mean droplet size and PDI. These trends elucidate that when the surfactant concentration was reduced, the resulting peppermint oil droplets were incompletely covered, causing the incompact hydrophilic-hydrophobic interface between peppermint oil and sodium alginate solution; when the oil phase proportion was excessive, the steric effect provided by surfactant was diminished [Citation26].
Figure 1. DLS testing results of different PO/SA nanoemulsions illustrating the effects of (a) surfactant HLB value; (b) emulsification temperature; (c) PO/oil phase ratio; (d) oil phase/emulsion ratio on the mean droplet size and PDI.
Given the results of one-variable-at-a-time tests above, three significant factors were selected and taken into consideration with three levels respectively for BBD: HLB value of surfactant, PO/oil phase ratio, and oil phase/emulsion ratio (). 17 experiments were designed and then carried out to obtain the responses.
Table 2. Factors and levels of the response surface methodology.
The comprehensive model regression equation for peppermint oil droplet size depending on the factors such as H, P and O by Design Expert for BBD is given by EquationEquation 4(4)
(4) as:
As can be seen in , the model is highly significant as evidenced by the FModel = 270.68 and a very low probability value PModel < 0.0001. Both PH and PH2 are lower than 0.0001 indicating that model term H and H2 have the significant influence on the response value of droplet size, whilst the other model terms such as HP, HO, and PO with relatively high P value implies there is no obvious interaction among HLB value, PO/oil phase ratio and oil phase/emulsion ratio. FH = 209.16, FP = 14.21, FO = 13.55, the influence of three factors on the oil droplet size of nanoemulsion is in the following order: HLB value of surfactant (H)>PO/oil phase ratio (P)≈oil phase/emulsion ratio (O).
Table 3. Analysis of variance for regression model.
The high value of regression coefficient (R2 = 0.9971) indicates that the correlation is best suited to predicting the values for the oil droplet size and the predicted values are closer to experimental results. The predicted R2 of 0.9621 is in reasonable agreement with the adjusted R2 of 0.9935. ‘Adequate Precision’ measures the signal-to-noise ratio. A value greater than 4 is desirable. The adequate precision of 44.330 indicated an adequate signal, so this model can be used to navigate the design space (). According to the obtained results, the optimal conditions to achieve smallest oil droplet diameter (47.46 nm) were with HLB value of 13.886, PO/oil phase ratio of 0.407 (w/w), and oil phase/emulsion ratio of 0.085 (w/w).
Table 4. Model fit summary for quadratic model statistics.
An additional experiment was carried out with the predicted factors. Results showed that the oil droplet size of 46.60 nm was in good agreement with the predicted value of 47.46 nm with an error of 1.81%.
Appearance and stability of PO/SA nanoemulsion
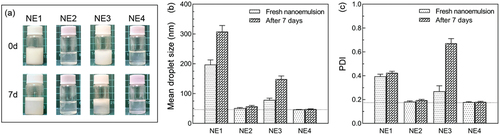
Four groups of fresh PO/SA nanoemulsion (NE1, NE2, NE3, NE4) were set () to observe the appearance after fresh preparation and storage for 7 days.
Table 5. Groups of PO/SA nanoemulsion set for appearance and stability check.
The optical appearance, as shown in , varies a lot among the groups, with opaque NE1 and NE3, and transparent NE2 and NE4, which can be attributed to the difference of droplet size. The relatively small droplet size compared to the wavelength of light means that they only scatter light waves weakly, resulting in transparent appearance. In comparison to NE1 and NE3, the other two groups were not layered significantly after 7-day storage. As described by Stokes’ law, reducing the size of the droplets increases the emulsion stability to gravitational separation [Citation27]. This is consistent with similar performance observed in . Large fluctuation existed in the mean drop size and PDI of NE1 and NE3 after 7 days, while NE2 and NE4 remained stable during the 7-day storage. Finally, it is worth mentioning that the nanoemulsion with the formula optimized by response surface methodology had an outstanding performance in this test and met the optimization expectation of stability.
Figure 2. (a) appearance of four groups of PO/SA nanoemulsions, (b) mean droplet size of different nanoemulsions at day0 (6h) and day7 (174h), and (c) PDI of different nanoemulsions at day0 (6h) and day7 (174h).
Morphology of PO/SA microcapsules
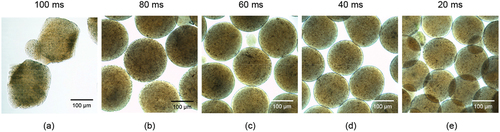
Microcapsules with minimized size and spherical shape are necessary. Hence, pulse durations of 20, 40, 60, 80 and 100 ms were set for five sample groups to investigate the effect on the size and shape of PO/SA microcapsules. This is so as to determine the settings of DOD system that are most suitable for further applications such as drug delivery and incorporation into packaging films. To facilitate the preparation, PO/SA nanoemulsion was with the following combination: composite surfactant (Span80 and Tween80) of HLB 13.93, PO/oil phase ratio of 0.5 (w/w), oil phase/emulsion ratio of 0.1 (w/w). In addition, by adjusting the concentration of sodium alginate, microcapsules with different shell/core ratios were also fabricated by using 20 ms pulse duration and then investigated.
PO/SA microcapsules fabricated with pulse duration of 100 ms have an irregular shape, part of which have the ‘long tails’ attached at the end (). With the decrease of the pulse duration, the production of PO/SA microcapsules became stable, either on the view of size or shape. This is because the larger droplets were imposed with higher level of aerodynamic and gravitational forces, which act as a counterbalance to the stabilizing impact of surface tension and cause the distortion [Citation28]. Moreover, the larger the droplet that is extruded from the tip of DOD device, the less of an effect capillary pressure has on stabilizing the droplet and the more of an effect hydrostatic pressure has on destabilizing the droplet.
Figure 3. Optical microscopy images of PO/SA microcapsules prepared by different pulse durations of (a)100, (b) 80, (c) 60, (d) 40, and (e) 20 ms.
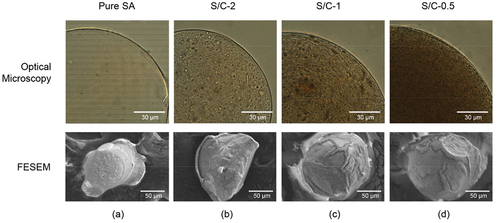
By adjusting the shell/core ratio of PO/SA microcapsules through variations in sodium alginate solution concentration, we observed that microcapsules with different shell/core ratios exhibited similar sizes and shapes, differing primarily in the depth of colour (indicative of varying peppermint oil content). Furthermore, microscopy images revealed the internal structure of these microcapsules: a multinuclear structure, where peppermint oil was dispersed into numerous small droplets encapsulated within sodium alginate (). After the drying process of PO/SA microcapsules, their surfaces appeared rough and wrinkled, and the shape and size underwent changes becoming non-spherical and slightly shrinking. This transformation was attributed to the reduction in moisture content, leading to the contraction of sodium alginate shell. There were no significant morphological differences among microcapsules with different shell/core ratios.
Figure 4. Optical microscopy and FESEM images of pure sodium alginate microcapsules (a) and PO/SA microcapsules with different shell/core ratios of (b) 2 (S/C-2), (c) 1 (S/C-1), and (d) 0.5 (S/C-0.5).
To analyse the effect of pulse duration and shell/core ratio on the appearance of microcapsules statistically, ImageJ and CAXA were used to measure the average diameter and aspect ratio of different groups of microcapsules. As shown in , with a long pulse duration, the size of PO/SA microcapsules remained at the range of 350–200 μm, and the average diameter decreased to a minimum of 185 μm with the pulse duration shorter than 60 ms. Moreover, gradual decreasing value of standard deviation illustrates the narrower distribution of the size of PO/SA microcapsules, reflecting a more stable production of DOD system with shorter pulse duration. The aspect ratio is a measure of the regularity of microcapsules. The closer the value of the aspect ratio is to 1, the closer the shape of the microcapsules is to a sphere. As can be seen in , the aspect ratio of the resulting microcapsules became higher as the pulse duration decreased. This trend suggests that the smaller-sized microcapsules tend to have a shape closer to spherical, and a decrease in the standard deviation value signifies a higher level of shape uniformity among the smaller-sized microcapsules, aligning with the microscopy results mentioned earlier. Additionally, PO/SA microcapsules with different shell/core ratios exhibited negligible differences in appearance under the same fabrication condition.
Figure 5. (a) size and (b) shape distribution of PO/SA microcapsules fabricated with different pulse durations and shell/core ratios (***: p < 0.001, **: p < 0.05, *: p < 0.01).
Encapsulation efficiency of PO/SA microcapsules
The quantification of the mixture of PO and composite surfactant in microcapsules was performed to analyse the encapsulation efficiency of PO/SA microcapsules statistically by UV-Vis spectrophotometry method. The encapsulation percentage of PO-surfactant mixture loaded in microcapsules was calculated as the difference between the total amount of oil phase in the 5 g PO/SA nanoemulsion prepared and the free PO-surfactant mixture in the external aqueous phase, i.e. calcium chloride crosslinking solution.
The standard absorbance curve was determined by scanning PO/CaCl2 nanoemulsion of peppermint oil at 6.25 g/L over the range of 260–400 nm, of which the characteristic wavelength was at 275 nm (). Following Beer-Lambert law, ten PO/CaCl2 nanoemulsions with different concentrations of PO were examined to obtain the linear relationship between the absorbance and the concentration [Citation29]. According to the calibration curve of spectrophotometry, the equation was created as y (absorbance) = 0.01845*x (concentration of core contents) (r2 = 0.99319), as shown in .
Figure 6. The effect of PO contents on the UV-Vis absorbance: (a) the UV-Vis spectra of peppermint oil, (b) the relationship of UV-Vis absorbance with the concentration of core contents of PO/SA microcapsules in CaCl2, and (c) the encapsulation efficiency of PO/SA microcapsules fabricated with different parameters (***: p < 0.001, **: p < 0.05, *: p < 0.01).
showed the decreased pulse duration improved the encapsulation efficiency of PO/SA microcapsules from 65.87% (100 ms S/C-1) to 90.23% (20 ms S/C-1). The main reason for the low encapsulation efficiency of microcapsules fabricated with longer pulse duration is that the extension of reaction time is required for cross-linking between larger amounts of sodium alginate and calcium chloride, in comparison with smaller microcapsules. Besides, the irregular shape probably provided the surface area for peppermint oil to escape from the shell, under the action of the pressure coming from the density difference between oil phase and aqueous phase. It was notable that there was a slight drop when the shell/core ratio improved from 2 to 0.5, which indicated that even under favourable DOD settings, encapsulating a large quantity of peppermint oil with a small amount of sodium alginate still presented some challenges.
Antimicrobial properties of PO/SA microcapsules
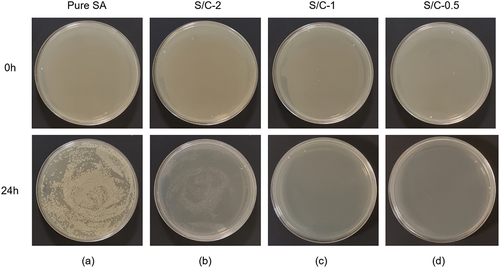
E. coli is widely present in contaminated water and food, making it a common bacteria for food antimicrobial studies. In this paper, E. coli was used as the bacteria for antimicrobial testing, demonstrating the significant potential value of the prepared PO/SA microcapsules in addressing microbial contamination. The results of the antimicrobial tests are shown in . represents the control group of pure SA microcapsules without added PO. After culturing on Mueller-Hinton (MH) agar medium in an incubator at 37°C for 24 hours, the bacterial colonies almost covered the entire petri dish. In comparison with the other three experimental groups, it can be inferred that the primary antimicrobial component within the microcapsules is PO. When microcapsules from the S/C-2 group were added to the liquid culture medium and cultured for 24 hours, a noticeable reduction in bacterial colonies on MH agar medium was observed. As for the two groups of PO/SA microcapsules from S/C-1 and S/C-0.5, their antimicrobial activity was even stronger. E. coli suspensions treated with these microcapsules showed no visible bacterial colonies after being cultured on MH agar medium for 24 hours. This can be attributed to their higher PO content or the weaker barrier effect of the sodium alginate shell with lower content on the release of internal antimicrobial substances.
Figure 7. Killing experiments on E. coli at 0h and 24h for (a) pure SA microcapsules, (b) S/C-2, (c) S/C-1, and (d)S/C-0.5 PO/SA microcapsules.
Conclusions
Here we investigated the feasibility of the PO/SA microcapsule fabrication, by using DOD technique combined with composite nanoemulsion. Using response surface methodology, we successfully optimized the PO/SA nanoemulsion to have a mean droplet size below 50 nm, while maintaining long-term stability. On this foundation, various sizes and shapes of PO/SA microcapsules were obtained by adjusting the pulse duration in the DOD system. Simultaneously, the influence of the shell/core ratio on the morphology of resulting microcapsules and microencapsulation efficiency was discussed. Finally, antimicrobial activity assessments were conducted on PO/SA microcapsules with different shell/core ratios, all with average particle sizes below 200 μm, under the condition of a pulse duration of 20 ms, yielding promising results of almost all bacteria being killed by S/C-1 and S/C 0.5 PO/SA microcapsules. In conclusion, the microencapsulation method presented in this paper was validated as valuable for rapid and large-scale production in industrial applications.
Disclosure statement
The authors declare that they have no known competing financial interests or personal relationships that could have appeared to influence the work reported in this paper.
Correction Statement
This article has been republished with minor changes. These changes do not impact the academic content of the article.
Additional information
Funding
References
- Ghosh SK. Chapter 1 - Functional Coatings and Microencapsulation: A General Perspective. In: Ghosh SK, editor. Functional Coatings: by polymer microencapsulation. United Kingdom: Wiley; 2006. p. 1–10.
- Mhetre RL, Hol VB, Chanshetti RR, et al. Optimisation of cilnidipine nanoparticles using box-behnken design: in-vitro, toxicity and bioavailability assessment. Mater Technol. 2022;37(11):1796–1807. doi: 10.1080/10667857.2021.1988038
- Huang YI, Cheng YH, Yu CC, et al. Microencapsulation of extract containing shikonin using gelatin-acacia coacervation method: a formaldehyde-free approach, colloid surf. B-Biointerfaces. 2007;58(2):290–297. doi: 10.1016/j.colsurfb.2007.04.013
- Budinčić JM, Petrović L, Đekić L, et al. Study of vitamin E microencapsulation and controlled release from chitosan/sodium lauryl ether sulfate microcapsules. Carbohydr Polym. 2021;251:116988. doi: 10.1016/j.carbpol.2020.116988
- Xu K, Luo YJC, Physicochemical SA, et al. Packaging ink microcapsules with high stability and biocompatibility based on natural dye gardenia blue, Colloids surfaces a. Physicochemical Engineering Aspects. 2023;658:130778. doi: 10.1016/j.colsurfa.2022.130778
- Ghorab MM, Zia H, Luzzi LA. Preparation of controlled release anticancer agents I: 5-fluorouracil-ethyl cellulose microspheres. J Microencapsul. 1990;7(4):447–454. doi: 10.3109/02652049009040466
- Chen W, Zhang J, Zhao Y, et al. Preparation of size controllable polymer fluorescent microspheres by self-stabilized precipitation polymerization. Mater Technol. 2022;37(12):2148–2157. doi: 10.1080/10667857.2022.2038532
- Liu WF, Guo ZX, Yu J. Preparation of crosslinked composite nanoparticles. J Appl Polym Sci. 2005;97(4):1538–1544. doi: 10.1002/app.21910
- Desai KGH, Park HJ. Preparation of cross-linked chitosan microspheres by spray drying: effect of cross-linking agent on the properties of spray dried microspheres. J Microencapsul. 2005;22(4):377–395. doi: 10.1080/02652040500100139
- Ju J, Xie YF, Guo YH, et al. Application of starch microcapsules containing essential oil in food preservation. Crit Rev Food Sci Nutr. 2020;60(17):2825–2836. doi: 10.1080/10408398.2018.1503590
- Shanmugam DK, Anitha SC, Souresh V, et al. Current advancements in the development of bionic organs using regenerative medicine and 3D tissue engineering. Mater Technol. 2023;38(1):2242732. doi: 10.1080/10667857.2023.2242732
- Duarte Campos DF, Rohde M, Ross M, et al. Corneal bioprinting utilizing collagen‐based bioinks and primary human keratocytes. J Biomed Mater Res Part A. 2019;107(9):1945–1953. doi: 10.1002/jbm.a.36702
- Wee CY, Yang Z, Thian ES. Past, present and future development of microspheres for bone tissue regeneration: a review. Mater Technol. 2021;36(6):364–374. doi: 10.1080/10667857.2020.1759953
- Wee CY, Lim JT, Koo J, et al. Investigating the degradation behaviour and characteristic changes of phase pure hydroxyapatite (HAp) microsphere scaffolds under static and dynamic conditions. Mater Technol. 2022;37(12):2242–2254. doi: 10.1080/10667857.2021.2023846
- Chan L, Jin Y, Heng P. Cross-linking mechanisms of calcium and zinc in production of alginate microspheres. Int J Pharmaceut. 2002;242(1–2):255–258. doi: 10.1016/S0378-5173(02)00169-2
- Naeimi M, Noohi N. Fabrication and characterisation of antibacterial porous alginate/aloe vera structures containing chitosan nanoparticles for wound dressing applications. Mater Technol. 2022;37(8):822–828. doi: 10.1080/10667857.2021.1898713
- Soni ML, Kumar M, Namdeo K. Sodium alginate microspheres for extending drug release: formulation and in vitro evaluation. Int J Drug Delivery. 2010;2(1):64–68. doi: 10.5138/ijdd.2010.0975.0215.02013
- Kaur N, Singh B, Sharma S. Hydrogels for potential food application: effect of sodium alginate and calcium chloride on physical and morphological properties. Pharma Innovation J. 2018;7(7):142–148.
- da Silvada Silva TL, Vidart JMM, da Silvada Silva MGC, et al. Chapter 4 - Alginate and sericin: environmental and pharmaceutical applications. In: Emad AS, editor. Biological Activities And Application Of Marine Polysaccharides. Croatia: InTech; 2017. p. 57–86.
- Pavlic B, Teslic N, Zengin G, et al. Antioxidant and enzyme-inhibitory activity of peppermint extracts and essential oils obtained by conventional and emerging extraction techniques. Food Chem. 2021;338:10. doi: 10.1016/j.foodchem.2020.127724
- Kang JM, Jin WY, Wang JF, et al. Antibacterial and anti-biofilm activities of peppermint essential oil against staphylococcus aureus, LWT-Food Sci. Technol. 2019;101:639–645. doi: 10.1016/j.lwt.2018.11.093
- Liu Q, Gao Y, Fu X, et al. Preparation of peppermint oil nanoemulsions: investigation of stability, antibacterial mechanism and apoptosis effects. Colloids Surf B Biointerfaces. 2021;201:111626. doi: 10.1016/j.colsurfb.2021.111626
- Hong IK, Kim SI, Lee SB. Effects of HLB value on oil-in-water emulsions: droplet size, rheological behavior, zeta-potential, and creaming index. J Ind Eng Chem. 2018;67:123–131. doi: 10.1016/j.jiec.2018.06.022
- Raval N, Maheshwari R, Kalyane D, et al. Chapter 10 - importance of Physicochemical characterization of nanoparticles in pharmaceutical product development. In: Tekade RK, editor. Basic Fundamentals of Drug Delivery. United States; 2019. p. 369–400.
- Mudalige T, Qu H, Van Haute D. Chapter 11 - characterization of nanomaterials: tools and challenges. In: López Rubio A, José Fabra Rovira MJ, Martínez Sanz M, et al., editors. Nanomaterials for food applications. United Kingdom: Elsevier; 2019. p. 313–353.
- Tran E, Richmond GL. Interfacial steric and molecular bonding effects contributing to the stability of neutrally charged nanoemulsions. Langmuir. 2021;37(43):12643–12653. doi: 10.1021/acs.langmuir.1c02020
- Travis PM. Colloids in industry. J Chem Educ. 1926;3(3):324. doi: 10.1021/ed003p324
- Opfer L, Roisman IV, Tropea C, Aerodynamic fragmentation of drops: dynamics of the liquid bag, Proceedings of the ICLASS 2012, 12th triennial international conference on liquid atomization and spray systems; Heidelberg, Germany; 2012. p. 1–8.
- Swinehart DF. The beer-lambert law. J Chem Educ. 1962;39(7):333. doi: 10.1021/ed039p333