
 ?Mathematical formulae have been encoded as MathML and are displayed in this HTML version using MathJax in order to improve their display. Uncheck the box to turn MathJax off. This feature requires Javascript. Click on a formula to zoom.
ABSTRACT
Carbon materials derived from biomass offer promising prospects for energy storage due to their eco-friendly nature, abundance, and distinctive porous structures. In this study, starch powder was used to synthesise activated biocarbon for supercapacitor electrodes. Spherical carbon particles with an average diameter of 250 nm were obtained using hydrothermal synthesis followed by chemical activation with KOH solution. Physical properties were analysed using scanning electron microscopy, X-ray diffraction, Raman spectroscopy, thermogravimetric analysis, and N2 adsorption/desorption analysis. Optimally activated biocarbon was achieved at an activation temperature of 900°C, exhibiting a specific surface area of 2730 m2 g−1 and an average pore size of 2.69 nm. The mesoporous structure facilitated ion movement, even at a high scan rate. The resultant symmetric supercapacitor exhibited an energy density of 60.16 Wh kg−1 (@140 W kg−1) and a power density of 24,590 W kg−1 (@51.24 Wh kg−1), surpassing commercial activated carbon.
Introduction
The growing use of fossil fuels and increasing environmental concerns have led to a rising interest in renewable-energy generation. Concurrently, the development of energy-storage devices that can efficiently store energy has gained heightened interest. However, renewable resources face challenges in supplying energy comparable to that of traditional fossil fuels owing to their dependence on weather conditions; thus, ensuring a reliable energy supply is difficult. For sustainable utilisation of these energy resources, efficient energy-storage systems are necessary. Electric double-layer capacitors (EDLCs) have recently attracted attention as sustainable energy-storage devices. EDLCs store charge electrostatically through the reversible adsorption of electrolyte ions onto electrochemically stable, high-surface-area carbon materials. This surface storage mechanism causes minimal volume change in the electrode during operation, resulting in a long cycle life (>106 charge-discharge cycles) and high power density [Citation1]. However, its energy density remains lower than that of other energy-storage devices; thus, the amount of energy stored must be increased.
The characteristics of EDLCs are determined by the morphology, structure, and electrochemical properties of the electrode material owing to the charge-storage mechanism of EDLCs. Therefore, an electrode material with an appropriate structure and excellent electrochemical performance is crucial for developing high-energy-density supercapacitors. In the case of EDLC, various carbon materials such as graphene and carbon nanotube are utilised as electrode materials [Citation2,Citation3]. However, their high costs pose a challenge to their commercialisation. Hence, there is a need to develop porous carbon materials that are cost-effective and exhibit high specific surface areas and excellent electrochemical properties as electrode materials. Activated carbon (AC) is commonly used as an electrode material in EDLCs because of its high specific surface area, porosity, chemical stability, and electrical conductivity. These properties depend on the raw material, precursor synthesis method, and activation method, leading to ongoing research in this area [Citation4].
Recently, the preparation of AC using biomass, including peanut shells [Citation5], olive pits [Citation6], and almond shells [Citation7], has gained increasing interest. The use of biomass to produce AC offers several advantages, including cost-effectiveness and the abundance of precursor materials. Additionally, it involves the reuse of discarded resources, resulting in lower prices. Furthermore, as a sustainable alternative to waste and by-products that contribute to environmental issues, it is an eco-friendly solution [Citation8]. In addition, the natural and interconnected structure of biomass improves the porous nature of AC [Citation9]. In the synthesis process, the activation process that follows the selection of the appropriate biomass is crucial for increasing the surface area and forming pores in the electrode material. Two methods may be used to activate carbon: physical and chemical activation processes. Compared to physical activation, chemical activation with KOH offers the advantages of achieving a high specific surface area, uniform pore size, and higher yield at a lower activation temperature. Consequently, the commonly used KOH activation method is employed in commercial production to generate micropores and mesopores [Citation10].
If the carbon particles have a spherical shape before the activation process, more uniform pores are likely to be formed during activation, enhancing the overall pore structure. Yao and Zhang reported the formation of uniform spherical carbon particles via hydrothermal synthesis [Citation11,Citation12]. Furthermore, the pore structure and specific surface area of AC depend upon the activation temperature. This study aims to utilise commercial starch as a starting material and employs hydrothermal synthesis and chemical-activation processes to produce mesoporous ACs. Subsequently, the electrochemical performance of the produced ACs was evaluated to determine its optimal activation temperature and assess its suitability as a supercapacitor electrode.
Materials and methods
Preparation of biomass-derived AC
illustrates the process of synthesising AC from starch. Spherical carbon particles were synthesised by mixing commercial starch powder (30 g, soluble, Sigma-Aldrich, U.S.A.) with deionised water (1500 mL). The resulting mixture was then subjected to a 12 h heating process at 195°C in a hydrothermal reactor. After the completion of the reaction, the pH of the mixture was in the mildly acidic range of 5–6. The mixture was then filtered through a polyvinylidene fluoride (PVDF) membrane (0.45 μm pore size, Sterlitech, U.S.A.) with vacuum suction to obtain the synthesized precursor and washed with boiling water. Subsequently, the resulting material was dried under a vacuum at 100°C for 12 h. After drying, the carbon precursor powder (~7 g) was obtained.
Figure 1. Schematic of the preparation of activated biocarbon.
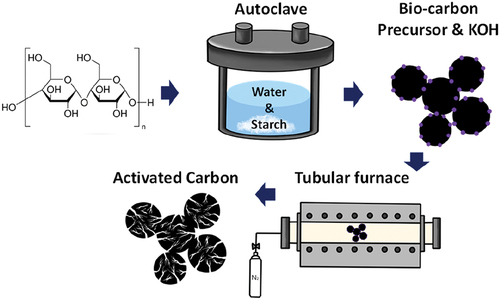
To activate the carbon precursor, a mixture of the carbon precursor (3 g) and KOH (13.5 g) was dissolved in 100 mL deionized water. The resulting mixture was stirred for 4 h and then vacuum impregnated for 20 h. The carbon precursor in the KOH solution, subjected to vacuum impregnation, was evaporated using a Rotary evaporator (IKA RV10, IKA Work, Inc., Germany) under vacuum conditions at a temperature of 75°C for 24 h, resulting in a powder. The KOH-coated biocarbons were activated at 700, 800, and 900°C for 1 h in an alumina tube furnace under a flow of nitrogen gas at a heating rate of 5°C min−1.
The chemical reactions during the KOH activation process can produce mesopores and micropores based on Equations (1)–(6) [Citation9,Citation13]:
As indicated by the equations, KOH undergoes dehydration to form K2O, which finally reacts with C and releases CO gas from the surface of the carbon powder [Citation14].
After the activation reaction was complete, the residual KOH in the KOH-AC was removed by repeated washes with boiling water. The AC was then filtered through a PVDF membrane filter with a pore size of 0.45 μm. The AC powder was obtained through vacuum drying at 100°C for 12 h.
Material characterization
SEM (SU5000, Hitachi, Tokyo, Japan) was used to analyse the surface morphology of the AC powder using a 5 kV acceleration voltage and was complemented with energy dispersive spectroscopy (EDS) for elemental analysis. The crystal structure of the powder was determined via powder X-ray diffraction (PXRD) using a SmartLab instrument (Rigaku, Tokyo, Japan). The surface areas and porosities of the prepared samples were determined via the Brunauer – Emmett – Teller (BET) method using a BELSORP-Max instrument (MicrotracBEL, Osaka, Japan). The pore-size distributions were evaluated using nonlocalized density functional theory. The prepared samples underwent TGA (TGA 8000, PerkinElmer, U.S.A.) in the temperature range of 25–900°C at a ramp rate of 5°C min−1 in a N2 atmosphere.
Electrochemical measurements
For the electrodes, a slurry was prepared by mixing the active material, Super-P (ERACHEM Comilog, U.S.A.), carboxymethyl cellulose (Koje, South Korea), and styrene – butadiene rubber (ZEON Co., Japan) at a weight ratio of 85:7:3:5 in deionized water. An aluminium-foil current collector was coated with the slurry and dried in a vacuum oven at 100°C for 12 h. The electrochemical characteristics of the activated biocarbons were assessed using a two-electrode configuration in a CR-2032 coin cell. A symmetric two-electrode coin cell was assembled using the prepared activated biocarbon electrodes and an organic electrolyte (KKE-20MSX, Carlit Co., Ltd., Japan), which comprised 59 wt% sulfolane and 7 wt% dimethyl sulphone mixed with 34 wt% spiro-(1,1’)-bipyrrolidinium tetrafluoroborate (SBP+BF4−).
Cyclic voltammetry (CV), galvanostatic charge-discharge (GCD), and AC impedance measurements were performed using a potentiostat (VSP, BioLogic, France) to investigate the electrochemical characteristics of the activated biocarbon electrodes. The CV data for the assembled symmetric coin-cells were measured in the voltage range of 0–3 V at a scan rate of 1–200 mV s−1, and GCD measurements were conducted in a current density of 0.5–5 A g−1. Electrochemical impedance spectroscopy (EIS) measurements were performed at an amplitude of 10 mV over a frequency range of 10 mHz to 100 kHz.
Results and discussion
Morphological and structural properties
A SEM image of the carbon precursor produced using hydrothermal synthesis at 195°C for 12 h is presented in . The carbon precursor synthesised through the hydrothermal synthesis of starch is denoted as HT, where X in HT-X represents the activation temperature. The hydrothermal synthesis confirmed that spherical carbon with a smooth surface and an average size of approximately 250 nm was manufactured. The spherical carbon particles were observed to be interconnected rather than independent.
Figure 2. SEM images of biocarbons (a) synthesized by a hydrothermal reaction for 12 h (before activation) and (b – d) after activation at (b) 700, (c) 800, and (d) 900 °C. (e) N2 sorption isotherms and (f) pore-size distributions of activated biocarbons.
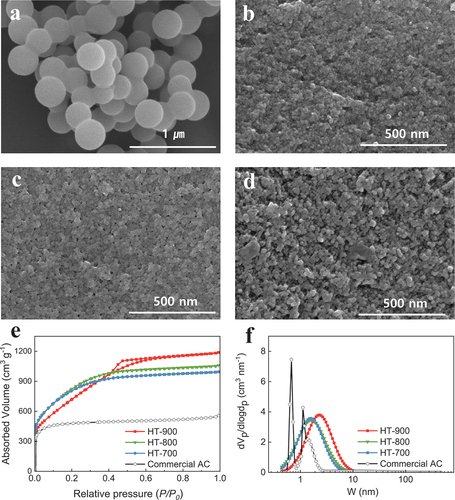
The surfaces of the activated biocarbons, produced by varying the temperature from 700°C to 900°C, are presented in . HT-700 appeared to have insufficient surface-porosity development, and as the activation temperature increased, the surface of the AC became more porous. As the activation temperature increased, the development of pores extended from the surface to the inside of the particles owing to the reaction of KOH adsorbed on the surface.
To further understand the pore evolution caused by increasing the activation temperature, the activated biocarbons were subjected to BET analysis. The N2 adsorption/desorption isotherms and pore-size distribution curves are shown in , respectively, and the results are summarised in Table S1. shows typical Type I behaviour in HT-700, HT-800, and Commercial AC (YP50F, Kuraray Chemical, Japan); however, a Type IV pattern was observed in HT-900, characterised by a hysteresis loop. The presence of a hysteresis loop in the N2 adsorption/desorption isotherm curve for HT-900 indicates the development of mesopores and micropores. As the activation temperature increases from 700°C to 900°C, the isotherm plots become more distinctly Type Ⅳ. This suggests that a higher activation temperature is not beneficial for the development of micropores; instead, it promotes mesopore growth. The formation of larger pores at higher temperatures indicated that the inner carbon, that is, the carbon wall separating each pore, was destroyed under severe conditions [Citation14]; Muniandy et al. [Citation15] reported similar results. According to their study, increasing the activation temperature results in the widening of the micropores to mesopores. The volume of the micropores relative to the total pore volume decreased with increasing activation temperature. The micropore volume ratios of HT-700, HT-800, and HT-900 were 0.5622, 0.4917, and 0.2400, respectively. The pore-size distribution in HT-900 was mainly in the range 0.5–10 nm, revealing abundant mesopores in the product. Particularly in HT-900, the average pore size was 2.69 nm, surpassing those of HT-700, HT-800, and commercial AC, which were 2.09, 2.15, and 1.88 nm, respectively. The BET surface areas of HT-700, HT-800, HT-900, and commercial AC were 2939, 3041, 2730, and 1829 m2 g−1, respectively. The specific surface areas of the synthesised activated biocarbons are approximately 1.5 times greater than that of commercial AC, indicating that activated biocarbons have more electrochemical active sites for charge storage. From the surface-area analysis, the BET surface area decreased at an activation temperature of 900°C. This is because a high activation temperature induced a gasification reaction, resulting in the destruction of the pore wall of micropores and consequently lowering the surface area of the activated biocarbons [Citation16].
The crystallinity of the carbon was confirmed using PXRD and Raman spectroscopy. The XRD patterns of the carbon precursor and activated biocarbons, shown in , did not exhibit sharp peaks, indicating a predominantly amorphous structure. For HT, the peak centred at 23° corresponded to the (002) plane, indicating an amorphous structure of the incompletely carbonised precursor. The XRD patterns of the activated biocarbons exhibited broad peaks at 23° and 44°, which could be attributed to reflections from the (002) and (100) planes, respectively. Some degree of microcrystallinity with a turbostratic graphite structure can be justified in the activated biocarbons [Citation17]. For HT-700 and HT-800, the characteristic peaks centred at 23° of the activated biocarbons were similar in intensity. In contrast, the peak intensity of HT-900 was marginally higher, indicating an increase in graphitic crystallinity. The KOH reaction was mostly terminated below 900°C, with a minor rearrangement of the graphite structure occurring at 900°C [Citation13]. These conclusions were supported by the Raman spectroscopic measurements (). Raman spectroscopy is useful for determining the structures, defects, and disorder characteristics of carbon materials. The two characteristic peaks corresponded to the disorder-induced (D band, ~1350 cm−1) and graphite bands (G bands, ~1590 cm−1) of carbon, respectively. The D band reflected the defects and disorder in the samples, whereas the G band represented an ordered sp2 carbon plane. The intensity ratio of the D band to the G band (ID/IG) is a measure of the degree of disorder and graphitisation in carbon materials [Citation18]. The ID/IG ratios of the HT-700, HT-800, and HT-900 samples were 0.951, 0.948, and 0.937, respectively, indicating that the graphitisation degree increased at the activation temperature of 900°C.
Figure 3. (a) X-ray diffraction patterns, (b) Raman spectroscopy, and (c) thermogravimetric profiles of non-activated biocarbon (HT) and activated biocarbons (HT-700, HT-800, HT-900).
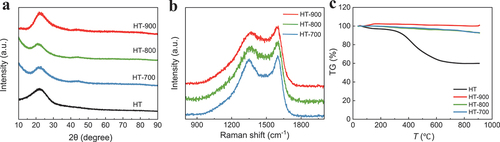
The TGA results are shown in . HT underwent substantial mass reduction with increasing temperature, confirming that the HT precursor obtained from the hydrothermal synthesis was insufficiently carbonised. However, for activated biocarbons, minimal mass loss was observed up to a temperature of 900°C.
Electrochemical properties
The electrochemical performances of all prepared activated biocarbons and commercial AC were analysed using two electrodes assembled in a symmetric coin cell. The CV curves at different scan rates of 1–200 mV s−1 are shown in . The synthesised activated biocarbons exhibited typical rectangular CV curves at most scan rates, regardless of the activation temperature, indicating excellent reversible capacitive behaviour. In particular, the HT-800 and HT-900 electrodes maintained a rectangular-shaped CV curve even at a scan rate of 200 mV s−1 (). The variation in specific capacitance with respect to the scan rate from 1 to 200 mV s−1 for activated biocarbon with different activation temperatures and commercial AC electrodes is shown in . The specific capacitance () at each scan rate was calculated by applying the following equation to the CV data.
Figure 4. CV curves for activated biocarbon electrodes of HT-700, HT-800, and HT-900 at different scan rates: (a) 1, (b) 50, and (c) 200 mV s−1. (d) Variation in specific capacitance from the CV curves (a – c). (e) AC impedance and (f) cyclic stability of HT-900 at 200 mV s−1.
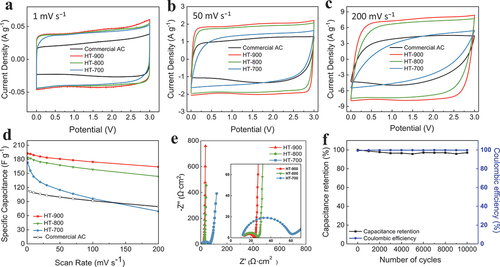
where Csp is the specific capacitance (F g−1), s is the scan rate (V s−1), m is the average active material mass of the two electrodes (g), ΔV is the potential difference (V), i is the current (A), V1 is the lower voltage limit (V), and V2 is upper voltage limit (V) [Citation19]. As the activation temperature increased, the specific capacitance increased. The specific capacitance of HT-700, HT-800, and HT-900 were 172, 183, and 192 F g−1 at 1 mV s−1, respectively. For the HT-900 electrode, the specific capacitance values were 192 and 163 F g−1 at 1 and 200 mV s−1, respectively, corresponding to a capacitance retention of 85%. These results surpassed those of HT-700 and HT-800, which exhibited capacitance retentions of 40% and 78%, respectively. HT-900 exhibited the highest specific capacitance and rate capability among the activated biocarbons. This can be attributed to the influence of pore distribution in the material. To effectively acquire electric double-layer capacitance, the diameter of the pores should be at least a few times larger than the ion diameter [Citation13]. The positive ion (SBP+) was 9.009 Å in length, 6.405 Å in width, and 6.194 Å in height. The negative ion (BF4−) was 4.678 Å in length, 4.678 Å in width, and 4.630 Å in height [Citation20]. Therefore, the micropores were unsuitable for the SBP+ and BF4− ions to form an electric double layer. As shown in , HT-700 and HT-800 were composed of micropores, whereas HT-900 included micropores as well as mesopores and had the largest pore volume among the three types of activated biocarbons and commercial AC. Furthermore, the increase in mesopores facilitated the movement, adsorption, and desorption of ions into the pores, even at high scan rates, contributing to the maintenance of capacitance. shows the Nyquist plot of the activated biocarbon electrodes obtained from EIS in the frequency range of 10 mHz to 100 kHz with the inset showing a magnification of the high-frequency region. The intercept of the Nyquist plot with the x-axis is typically used to estimate the equivalent series resistance (ESR), which includes the resistances of electrolyte and electrode [Citation21,Citation22]. The ESR values were similar, in the range of 12–13 Ω cm2. The diameter of the semicircle in the middle-frequency region indicated the charge-transfer resistance owing to the interface resistance between the electrode and electrolyte. A comparison of the diameters in , inset) clearly shows that HT-900 had the smallest semicircle, indicating the lowest charge-transfer resistance. In the low-frequency region, the straight-line part of HT-900 leaned more towards the imaginary axis than those of the other carbon materials. This indicated that the movement of ions into the pores of HT-900 was more facile than those of HT-700 and HT-800 because HT-900 had a more appropriate pore size and higher electrical conductivity than the other two electrodes [Citation13,Citation18]. The cycling test shown in illustrates that the electrode was able to retain ~ 97% of its initial capacitance after 10,000 cycles at a high scan rate of 200 mV s−1, showing excellent cycling stability.
Galvanostatic charge and discharge tests were performed to further investigate electrochemical performance (). The specific capacitances () were calculated from the GCD curves using EquationEquation (8)
(8)
(8) :
Figure 5. Galvanostatic charge and discharge curves for the activated biocarbon electrodes of HT-700, HT-800, HT-900, and commercial AC at different current densities of (a) 0.5 and (b) 5 A g−1. (c) Variation in specific capacitance from the GCD curves.
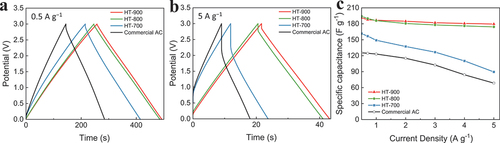
where is the specific capacitance (F g−1),
is the discharge current (A),
is the discharge time (s), m is the average active material mass of the two electrodes (g), and
is the potential window (V) [Citation23].
present the GCD curves of activated biocarbon electrodes and the commercial AC electrode. At the low current density of 0.5 A g−1, all plots exhibited linear voltage profiles without obvious voltage drops. However, at the high current density of 5 A g−1, the characteristics of the charge-discharge curves changed significantly, which was confirmed by the internal resistance (IR) drops and the differences in the shapes observed in the plots. HT-900 showed both a longer discharge time and smaller voltage drop than those of other biocarbons and commercial AC. Furthermore, HT-900 still showed a symmetric and typical triangle-shaped charge-discharge profile at a current density of 5 A g−1, indicating the excellent electrochemical reversibility, electrical conductivity, and capacitive behaviour of the material [Citation24,Citation25].
At a current density of 5 A g−1, the specific capacitance of HT-900 remained as high as 179 F g−1, corresponding to a capacitance retention of 93%, with an increase in the current density from 0.5 to 5 A g−1. This indicated the excellent rate capability of HT-900 (). However, HT-700 showed a specific capacitance of 161 and 89 F g−1 at current densities of 0.5 and 5 A g−1, respectively, corresponding to a capacitance retention of 55%. The faster decrease in the capacitance of HT-700 and commercial AC was due to the larger IR drops and smaller pore size compared with HT-900.
The energy density (EM, Wh kg−1) and power density (PM, W kg−1) were calculated from the CV curves as follows:
where E (Wh) is the total energy, C (F) is the capacitance, V (V) is the potential window, M (kg) is the total mass of the active materials, P (W) is the total power, and I (A) is the average current [Citation13]. The performance of the commercial supercapacitors was calculated assuming that the active material ratio in the electrode material is 90 wt%. The results of the electrochemical measurement for commercial supercapacitors are depicted in Figure S1, with additional device information provided in Table S2. The Ragone plot presented in shows that HT-900 electrodes produced a high energy density of 60.16 Wh kg−1 at a power density of 140 W kg−1 and a high power density of 24,590 W kg−1 at an energy density of 51.24 Wh kg−1, surpassing both commercial AC and the other biomass-derived ACs.
Figure 6. Ragone plot of the specific energy density versus specific power density for activated biocarbons compared with the values for other ACs [Citation24,Citation26–28].
![Figure 6. Ragone plot of the specific energy density versus specific power density for activated biocarbons compared with the values for other ACs [Citation24,Citation26–28].](/cms/asset/597fc603-6f45-4fa3-b9bc-684f6a475755/ymte_a_2338628_f0006_oc.jpg)
Conclusions
In this study, we employed commercial starch powder to synthesise AC with well-developed mesopores for use as an electrode in EDLCs. Uniform spherical carbon particles with a diameter of 250 nm were obtained through hydrothermal synthesis, and chemical activation was carried out using KOH solution by varying the activation temperature from 700 to 900°C in increments of 100°C. Compared to HT-700 and HT-800, which are composed of micropores, HT-900 developed mesopores as the walls between the pores combusted at high temperatures. Notably, the average pore size for HT-900 measured 2.69 nm, surpassing the values of 2.09 nm and 2.15 nm observed in HT-700 and HT-800, respectively. The obtained HT-900 exhibited a specific surface area of 2730 m2 g−1, pore-size distribution of 0.5–10 nm, and increased graphitic crystallinity compared with HT-700 and HT-800. The superior electrochemical performance of HT-900 as an electrode for EDLCs can be attributed to the pore structure, which was appropriate for the SBP+ and BF4− ions to form an electric double layer. HT-900, having developed mesopores, facilitated the efficient adsorption/desorption of electrolyte ions into the pores, even at a high scan rate of 200 mV s−1 and high current density of 5 A g−1. These results show that mesoporous activated biocarbon is a promising material for applications in energy-storage devices.
Supplementary material_.docx
Download MS Word (273.9 KB)Disclosure statement
No potential conflict of interest was reported by the author(s).
Supplementary material
Supplemental data for this article can be accessed online at https://doi.org/10.1080/10667857.2024.2338628
Additional information
Funding
References
- Simon P, Gogotsi Y. Perspectives for electrochemical capacitors and related devices. Nat Mater. 2020;19(11):1151–8. doi: 10.1038/s41563-020-0747-z
- Bazan-Aguilar A, Ponce-Vargas M, Caycho CL, et al. Highly porous reduced graphene oxide-coated carbonized cotton fibers as supercapacitor electrodes. ACS Omega. 2020;5(50):32149–32159. doi: 10.1021/acsomega.0c02370
- De Silva T, Damery C, Alkhaldi R, et al. Carbon nanotube based robust and flexible solid-state supercapacitor. ACS Appl Mater Interfaces. 2021;13(47):56004–56013. doi: 10.1021/acsami.1c12551
- Merin P, Jimmy Joy P, Muralidharan MN, et al. Biomass-derived activated carbon for high-performance supercapacitor electrode applications. Chem Eng Technol. 2021;44(5):844–851. doi: 10.1002/ceat.202000450
- Purkait T, Singh G, Singh M, et al. Large area few-layer graphene with scalable preparation from waste biomass for high-performance supercapacitor. Sci Rep. 2017;7(1):15239. doi: 10.1038/s41598-017-15463-w
- Redondo E, Carretero-González J, Goikolea E, et al. Effect of pore texture on performance of activated carbon supercapacitor electrodes derived from olive pits. Electrochim Acta. 2015;160:178–184. doi: 10.1016/j.electacta.2015.02.006
- Marcilla A, García-García S, Asensio M, et al. Influence of thermal treatment regime on the density and reactivity of activated carbons from almond shells. Carbon. 2000;38(3):429–440. doi: 10.1016/S0008-6223(99)00123-2
- Unknown S, Chand P, Joshi A. Biomass derived carbon for supercapacitor applications: review. J Energy Storage. 2021;39(April):102646. doi: 10.1016/j.est.2021.102646
- Zhang Y, Yu S, Lou G, et al. Review of macroporous materials as electrochemical supercapacitor electrodes. J Mater Sci. 2017;52(19):11201–11228. doi: 10.1007/s10853-017-0955-3
- Ioannidou O, Zabaniotou A. Agricultural residues as precursors for activated carbon production-A review. Renewable Sustainable Energy Rev. 2007;11(9):1966–2005. doi: 10.1016/j.rser.2006.03.013
- Yao C, Shin Y, Wang L, et al. Hydrothermal dehydration of aqueous fructose solutions in a closed system. J Phys Chem C. 2007;111(42):15141–15145. doi: 10.1021/jp074188l
- Zhang M, Yang H, Liu Y, et al. First identification of primary nanoparticles in the aggregation of HMF. Nanoscale Res Lett. 2012;7(1):38. doi: 10.1186/1556-276X-7-38
- Il Kim Y, Lee YJ, Yoo J, et al. High-capacitance activated bio-carbons with controlled pore size distribution for sustainable energy storage. J Power Sources. 2019;438(August):226969. doi: 10.1016/j.jpowsour.2019.226969
- Otowa T, Tanibata R, Itoh M. Production and adsorption characteristics of MAXSORB: high-surface-area active carbon. Gas Sep Purif. 1993;7(4):241–245. doi: 10.1016/0950-4214(93)80024-Q
- Muniandy L, Adam F, Mohamed AR, et al. The synthesis and characterization of high purity mixed microporous/mesoporous activated carbon from rice husk using chemical activation with NaOH and KOH. Micropor Mesopor Mater. 2014;197:316–323. doi: 10.1016/j.micromeso.2014.06.020
- Yun CH, Park YH, Park CR. Effects of pre-carbonization on porosity development of activated carbons from rice straw. Carbon N Y. 2001;39(4):559–567. doi: 10.1016/S0008-6223(00)00163-9
- Yb T, Liu Q, Fy C. Preparation and characterization of activated carbon from waste ramulus mori. Chem Eng J. 2012;203:19–24. doi: 10.1016/j.cej.2012.07.007
- Zhang G, Chen Y, Chen Y, et al. Activated biomass carbon made from bamboo as electrode material for supercapacitors. Mater Res Bull. 2018;102(June):391–398. 2017. doi: 10.1016/j.materresbull.2018.03.006
- Oh YJ, Yoo JJ, Kim YI, et al. Oxygen functional groups and electrochemical capacitive behavior of incompletely reduced graphene oxides as a thin-film electrode of supercapacitor. Electrochim Acta. 2014;116:118–128. doi: 10.1016/j.electacta.2013.11.040
- Zhang F, Xiao X, Gandla D, et al. Bio-derived carbon with tailored hierarchical pore structures and ultra-high specific surface area for superior and advanced supercapacitors. Nanomaterials (Basel). 2021;12(1):27. doi: 10.3390/nano12010027
- Phiri J, Dou J, Vuorinen T, et al. Highly porous willow wood-derived activated carbon for high-performance supercapacitor electrodes. ACS Omega. 2019;4(19):18108–18117. doi: 10.1021/acsomega.9b01977
- Taberna PL, Simon P, Fauvarque JF. Electrochemical characteristics and impedance spectroscopy studies of carbon-carbon supercapacitors. J Electrochem Soc. 2003;150(3):A292. doi: 10.1149/1.1543948
- Sahoo MK, Rao GR. A high energy flexible symmetric supercapacitor fabricated using N-doped activated carbon derived from palm flowers. Nanoscale Adv. 2021;3(18):5417–5429. doi: 10.1039/D1NA00261A
- Zou Z, Liu T, Jiang C. Highly mesoporous carbon flakes derived from a tubular biomass for high power electrochemical energy storage in organic electrolyte. Mater Chem Phys. 2018;223:16–23. doi: 10.1016/j.matchemphys.2018.10.036
- Fahim M, Shah A, Bilal S. Highly stable and efficient performance of binder-free symmetric supercapacitor fabricated with electroactive polymer synthesized via interfacial polymerization. Materials. 2019;12(10):1626. doi: 10.3390/ma12101626
- Wang H, Li Z, Tak JK, et al. Supercapacitors based on carbons with tuned porosity derived from paper pulp mill sludge biowaste. Carbon. 2013;57(Y):317–328. doi: 10.1016/j.carbon.2013.01.079
- Tang Y, Lu Y, Zang X, et al. Tailored properties of carbon for supercapacitors by blending lignin and cellulose to mimic biomass as carbonaceous precursor. ChemSuschem. 2023;16(17):1–9. doi: 10.1002/cssc.202300357
- Apparla N, Manickavasakam K, Sharma CS. Augmenting the supercapacitive performance of candle soot-derived activated carbon electrodes in aqueous and non-aqueous electrolytes. J Energy Storage. 2023;73(PD):109162. doi: 10.1016/j.est.2023.109162