
Abstract
Reactive oxygen species induce neuronal cell death. However, the detailed mechanisms of cell death have not yet been elucidated. Previously, we reported neurite degeneration before the induction of cell death. Here, we attempted to elucidate the mechanisms of neurite degeneration before the induction of cell death using the neuroblastoma N1E-115 cell line and a time-lapse live cell imaging system. Treatment with the calcium ionophore ionomycin induced cell death and neurite degeneration in a concentration- and time-dependent manner. Treatment with a low concentration of ionomycin immediately produced a significant calcium influx into the intracellular region in N1E-115 cells. After 1-h incubation with ionomycin, the fluorescence emission of MitoSOXTM increased significantly compared to the control. Finally, analysis using a new mitochondrial specific fluorescence dye, MitoPeDPP, indicated that treatment with ionomycin significantly increased the mitochondrial lipid hydroperoxide production in N1E-115 cells. The fluorescence emissions of Fluo-4 AM and MitoPeDPP were detected in the cell soma and neurite regions in ionomycin-treated N1E-115 cells. However, the emissions of neurites were much lower than those of the cell soma. TBARS values of ionomycin-treated cells significantly increased compared to the control. These results indicate that ionomycin induces calcium influx into the intracellular region and reactive oxygen species production in N1E-115 cells. Lipid hydroperoxide production was induced in ionomycin-treated N1E-115 cells. Calcium influx into the intracellular region is a possible activator of neurite degeneration.
Keywords:
Introduction
Reactive oxygen species (ROS) can attack living organs and induce severe diseases [Citation1,Citation2]. The brain is especially vulnerable to ROS-induced damage [Citation3]. Although the brain to body weight ratio is less than 10%, its consumption of oxygen is about 20% [Citation4]. Furthermore, the ratio of polyunsaturated fatty acids (PUFAs), including docosahexaenoic acid (DHA) and eicosapentaenoic acid (EPA), in the brain is higher than in other tissues [Citation5,Citation6]. These phospholipids are easily oxidized by hydroxyl and lipid peroxide radicals [Citation7]. In addition, the levels of antioxidant enzyme activities, such as glutathione peroxidase, catalase, and super-oxide dismutase (SOD), are relatively low compared to other tissues [Citation8], and the oxidation of metal ions, such as iron and copper, occurs in the brain [Citation3]. The above examples illustrate how the brain is exposed to a variety of risks from ROS.
The mitochondria represent a major source of ROS production [Citation9,Citation10]. It is well known that free electrons leakage from the mitochondrial electron transport system bind to singlet oxygen and induce superoxide radicals [Citation9]. Although superoxide has a high reactivity, it is detoxified rapidly by the antioxidant enzyme SOD under normal conditions. However, through disruption in the balance of ROS production and antioxidant detoxification, our bodies gradually shift to an oxidative condition [Citation11]. As antioxidant enzyme activities decrease during senescence, ROS might be one reason for the acceleration of aging. This hypothesis is known as the free radical theory of aging [Citation12].
Recently, the relationship between oxidative damage and the development of neurodegenerative disorders, such as Alzheimer’s [Citation1,Citation13] and Parkinson’s diseases [Citation2,Citation14,Citation15], has been highlighted. As treatment with hydrogen peroxide induces neuronal cell death in a dose-dependent manner, hydrogen peroxide is used as an oxidative stress model in many in vitro studies [Citation16–18]. Previously, we also examined cell death in hydrogen peroxide-treated primary neurons [Citation19] and cell lines [Citation20]. Furthermore, we found apoptosis and β-amyloid-positive deposits in hippocampal slices of young rats exposed to high concentrations of oxygen [Citation21]. Accumulation of ROS-derived oxidative damage, as evidenced by our previous data, is related to neuronal dysfunction, and accelerates the risk of development and progression of neurodegenerative disorders [Citation6,Citation22].
In order to prevent ROS-derived neuronal cell death, it is important to identify key events prior the induction of cell death. We have been focusing on axonal functions, and found that treatment with a low concentration of hydrogen peroxide induced neurite degeneration [Citation19,Citation20]. The number of dendrites was decreased significantly, and the morphology of axons showed fragmentation and bead formation in a low concentration hydrogen peroxide-treated neuro2a [Citation20] and primary granule cells [Citation19]. Axonal beading is a hallmark of axonal degeneration [Citation23,Citation24]. In order to clarify the mechanism of axonal degeneration prior to the induction of cell death, we treated neuroblastoma cells with 2,2′-azobis(2-methylpropionamidine) dihydrochloride (AAPH), a well-known ROS generator, and assessed axonal conditions. The results showed that treatment with a low concentration of AAPH induced axonal beading in neuro2a cells [Citation25]. These results indicate that membrane oxidation is one of the mechanisms of axonal degeneration prior to the induction of cell death. However, the detailed pathway or mechanism of ROS-induced axonal degeneration remains to be clarified.
Various receptors are present on the surface of cell membranes [Citation26,Citation27]. If cell membranes are oxidized by ROS, these receptors may be also oxidized and altered. Receptors play a crucial role in neuronal function, in which information is transmitted from extracellular to intracellular spaces [Citation27]. This process involves the influx and efflux of various ions such as potassium, chloride, and sodium. It is well known that the maintenance of calcium concentrations is very important to cells [Citation27,Citation28]. Notably, imbalanced calcium concentrations are related to cell death. In Huntington’s disease, the leakage of calcium ions from the endoplasmic reticulum via alteration of ryanodine receptors has been reported [Citation29,Citation30]. Furthermore, calcium plays an important role in cell signaling. Ca2+/calmodulin-dependent protein kinase (CAM kinase) II and calpain are activated by calcium-dependent intracellular signaling pathways [Citation31] and play a crucial role in the maintenance of cytoskeletal protein function [Citation32]. If cell membranes harboring receptor proteins are attacked by ROS, this may trigger a large influx of calcium ions to intracellular regions. In this study, we employed ionomycin, which is a calcium ionophore, to induce calcium ion influx into the intracellular region of neuroblastoma cells, and focused on the role of cellular oxidation using a time-lapse fluorescence imaging technique.
Materials and methods
Cell culture and reagents
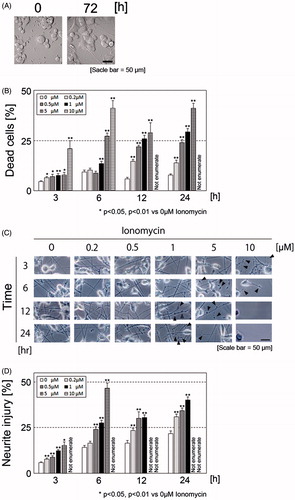
All animal experiments were performed with the approval of the Animal Protection and Ethics Committee of the Shibaura Institute of Technology (Tokyo, Japan). N1E-115 cells (ECACC #88112303), which are derived from a mouse neuroblastoma C1300 tumor, were originally obtained from DS Pharma Biomedical Co., Ltd. (Osaka, Japan). Cells were grown in Dulbecco’s minimum essential medium containing 10% heat-inactivated fetal calf serum (FCS) (Biological Industries, Beit Haemek, Israel), 2 mM glutamine, 50 U/ml penicillin, and 50 μg/ml streptomycin, and were plated on the wells and dishes of polyethyleneimine-coated plates (MP Biomedicals, LLC., Santa Ana, CA) and laminin-coated plates (laminin solution, derived from mouse Engelbreth-Holm-Swarm (EHS) sarcoma) at a density of 1.5 × 10⁵ cell/ml. In order to elicit neurite elongation, after confirming adhesion of the cells, the medium was changed to fresh medium containing 1% dimethyl sulfoxide (DMSO) solution. After 72 h, cells were used in experiments (). All other chemical agents were obtained from either Wako Pure Chemical Industries Ltd. (Osaka, Japan) or Sigma-Aldrich Corp. (St Louis, MO). All tissue culture plates and dishes were purchased from Becton Dickinson and Company (Franklin Lakes, NJ).
Figure 1. Morphology of N1E-115 cells before and after elongation of neurites (A). Ionomycin induces neurite degeneration and cell death in a concentration- and time-dependent manner (B). N1E-115 cells were plated at a density of 1.5 × 10⁵ cell/ml in double-coated 24-well plates. After treatment with each concentration of ionomycin, the number of dead cells was enumerated by trypan blue dye exclusion assay. Phase contrast images of neurites in N1E-115 cells in the presence or absence of ionomycin (C). Arrows indicate beading during degeneration of N1E-115 cells. Proportion of neurite degeneration in N1E-115 cells (D). Neurite degeneration was determined for each concentration and incubation time. A minimum of four wells were used per experiment. Each column represents the mean of at least three independent experiments. A large proportion of the cells became detached from the plates and neurites were lost; thus, some of the high concentration ionomycin-treated samples could not be enumerated (described as “Not enumerate”). Data were analyzed using a Student’s t-test, *indicates p < .05, and **indicates p < .01.
Determination of cell death
In order to clarify the effects of calcium influx on the cells, the calcium ionophore ionomycin was used in all experiments. Cell survival was assessed using the trypan blue dye exclusion assay. After confirming neurite elongation, the medium was changed to the recording medium (20 mM HEPES, 115 mM NaCl, 5.4 mM KCl, 0.8 mM MgCl2, 1.8 mM CaCl2, and 13.8 mM glucose). After treatment with various ionomycin concentrations (0, 0.2, 0.5, 1, 2, and 10 μM) and incubation times (3, 6, 12, and 24 h), 0.8% (w/v) trypan blue in phosphate-buffered saline (PBS) was added to each sample, and the plate was incubated for 20 min in a CO2 incubator at 37 °C. Cells were then washed with PBS at least three times. Photomicrographs of the cells were taken using an Olympus IX81 phase-contrast microscope (Olympus Corp., Tokyo, Japan) equipped with a DP71 digital camera (Olympus Corp.), after which the images were stored and processed on a personal computer. Photomicrographs used for analysis were selected randomly for each treatment and incubation condition. The number of dead cells per unit of area was counted, and the data were presented as a percentage of the total number of cells. At least four wells were analyzed for all experimental conditions, and each experiment was repeated three times.
Neurite degeneration
Neurite degeneration was evaluated by monitoring morphological hallmarks, such as bead formation and fragmentation, as described previously, with some modifications [Citation19]. After confirming neurite elongation in 24 wells, the medium was changed to the recording medium. After treatment with ionomycin under the same condition as the cell death experiment (see Section 2.2), cells were fixed with 4% (w/v) paraformaldehyde (PFA) in PBS for 15 min at 4 °C. Photomicrographs of the cells were taken by the same method as in the cell death experiment. At least 80 neurites were evaluated for neurite formation for each exposure and incubation time. The number of neurites altered per unit of area was counted, and the data were presented as the percentage of the total number of neurites. At least four wells were analyzed for all experimental conditions, and each experiment was repeated three times. Photomicrographs used for analysis were selected randomly for each treatment and incubation condition.
Localization of mitochondria in N1E-115 cells
N1E-115 cells were incubated with 100 nM MitoTracker® (Thermo Fisher Scientific Inc., Waltham, MA) for 15 min in a CO2 incubator, and were fixed with 4% PFA in PBS for 15 min in 4 °C. Fluorescence photomicrographs of N1E-115 cells were taken using a differential interference microscope (Olympus Corp.). Experiments were performed at least three times.
Continuous live imaging of N1E-115 cells using fluorescent dyes
All fluorescence photographs of N1E-115 cells were taken using a fluorescence incubator microscope (LCV110, Olympus Corp.). Cells at a density of 1.0 × 10⁵ cells/ml were plated on polyethyleneimine- and laminin-coated glass bottom dishes and treated with each fluorescent material.
Confirmation of Ca2+ influx into N1E-115 cells
After washing the cells, the medium was changed to an equal volume of the recording medium. Cells were treated with 2 μM Fluo-4 AM (Dojindo Laboratories, Kumamoto, Japan) and incubated for 1 h at 37 °C in a CO2 incubator. After incubation, the medium was changed to an equal volume of the recording medium and treated with ionomycin at a final concentration of 1 μM. Photomicrographs were taken every 2 min using a fluorescence incubator microscope for 3 h. Four different fields per well were set and recorded. In order to assess the effects of calcium ion influx, a control sample was recorded simultaneously for each experiment. Fluorescence was detected at a wavelength of 470 nm. The excitation and emission wavelengths of Fluo-4AM were 494 nm and 516 nm, respectively. Each experiment was repeated at least three times.
Determination of intracellular ROS production in ionomycin-treated N1E-115 cells
The medium was changed to an equal volume of the recording medium. Cells were treated with 2.5 μM MitoSOXTM (Thermo Fisher Scientific Inc.) in the presence or absence of 1 μM ionomycin. Photomicrographs were taken every 10 min using a fluorescence incubator microscope for 3 h. Two different fields per well were set and recorded. MitoSOXTM fluorescence detection was set at a wavelength of 530 nm. The excitation and emission wavelengths of MitoSOXTM were 510 nm and 580 nm, respectively. Each experiment was repeated at least four times.
Determination of mitochondrial-induced lipid peroxidation in ionomycin-treated N1E-115 cells
Half of the medium volume was changed to fresh culture medium containing 1% DMSO. Cells were treated with 0.2 μM 3-[4-(perylenylphenylphosphino)phenoxy]propyltriphenylphosphonium iodide (product name, MitoPeDPP) (Dojindo Laboratories) in the presence or absence of 1 μM ionomycin. Photomicrographs were taken every 10 min using a fluorescence incubator microscope for 24 h. Two different fields per well were set and recorded. The fluorescence detection wavelength of MitoPeDPP was set at 470 nm. The excitation and emission wavelengths of MitoPeDPP were 452 nm and 470 nm, respectively. Each experiment was repeated at least four times. In order to optimize the concentration of MitoPeDPP in N1E-115 cells, we evaluated different concentrations of MitoPeDPP and tert-butyl hydroperoxide (t-BHP). t-BHP was used as a positive control for MitoPeDPP.
Calculation of average luminance ratio
Average luminance ratio was calculated using the specific software MetaMorph® (Molecular Devices, LLC., Sunnyvale, CA). Two different fields in the dish were obtained using a fluorescence incubator microscope. Photographs of the Fluo-4 AM experiment were taken at 2-min intervals over 3 h. Photographs of the MitoSOXTM and MitoPeDPP experiments were taken at 10-min intervals over 24 h. After recording, we selected about 5 cells for each one field (about 10 cells per dish). Brightness per selected cell was determined at each time point. The luminance ratio of one selected cell at each time point was divided by the luminance score of the same cell before ionomycin treatment. Finally, cell scores were totaled and divided by the number of cells, and were expressed as the average luminance ratio of each time point.
Analysis of lipid peroxidation
In order to analyze the lipid oxidation, we measured thiobarbituric acid reactive substances (TBARS). Lipid peroxides were measured using Yagi’s method, as described previously with some modifications [Citation33]. After culturing N1E-115 cells for 72 h in the presence or absence of 1 μM ionomycin, cells were collected using a scraper and centrifuged at 15,000 rpm for 20 min at 4 °C. One hundred microliters of sample homogenates were mixed with 200 μL of 5 mM EDTA, 2 ml of 1% phosphate acid, and 1 ml of 0.7% thiobarbituric acid. The mixture was heated to 100 °C in a block heater for 45 min. After cooling on ice, the sample was incubated with 1 ml of butanol for 3 min. Following centrifugation at 3000 rpm for 10 min at 4 °C, the upper layer was isolated and absorbance at 535 nm was measured using a spectrophotometer (GeneQuant 100, GE Healthcare UK Ltd., Buckinghamshire, UK). This marker of oxidative stress was expressed per mg protein in the samples.
Statistical analysis
Data were plotted as means ± SE, and were analyzed by Student’s t-test, with p < .05 considered significant. Fluorescence microscopy data were analyzed by one-way factorial analysis of variance (one-way ANOVA), with p < .05 considered significant.
Results
Optimization of ionomycin concentration in N1E-115 cells
In order to optimize the ionomycin concentration and incubation time, cells were treated with various concentrations (0, 0.2, 0.5, 1, 2, and 10 μM) and incubation times (3, 6, 12, and 24 h) of ionomycin, and cell survival was determined using the trypan blue dye exclusion assay. As shown in , ionomycin treatment induced cell death in a concentration- and time-dependent manner. However, we were unable to enumerate the degree of cell death after 12- and 24-h incubation of 10 μM ionomycin-treated samples because a large proportion of the cells became detached from the bottom of the wells. The overall aim of this project was to clarify the mechanism of neurite degeneration prior to the induction of cell death. We assessed neurite morphology in ionomycin-treated N1E-115 cells. We enumerated the number of abnormal neurites exhibiting characteristics such as aggregation (known as bead formation), shrinkage, and fragmentation ()). We were unable to enumerate the ratio of neurite degeneration after 3-h incubation with 10 μM ionomycin. Although treatment with 5 μM of ionomycin did not strongly induce cell death, we were unable to enumerate the ratio of neurite degeneration after 12-h incubation because the majority of neurites were lost or retracted to the cell bodies. These results indicate that treatment with a low concentration of ionomycin induces neurite degeneration prior to the induction of cell death. In reference to this result, we established the ionomycin treatment concentration (1 μM) and incubation time (24 h) for all subsequent experiments.
Measurement of intracellular calcium influx in ionomycin-treated N1E-115 cells using Fluo-4 AM
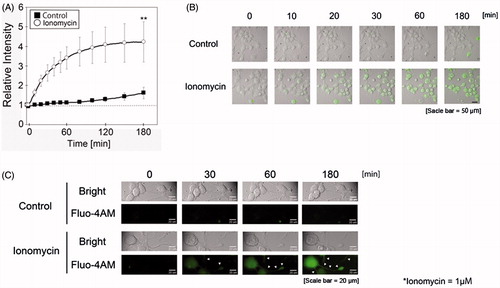
In order to clarify the mechanisms of neurite degeneration during treatment with a low concentration of ionomycin, intracellular calcium influx was measured using Fluo-4 AM with a time-lapse cell culture imaging system. As shown in , treatment with 1 μM ionomycin rapidly induced calcium-positive emission in N1E-115 cells. The relative intensity of Fluo-4 AM in ionomycin-treated N1E-115 cells significantly increased compared to the untreated group. Although weak, we detected Fluo-4 AM fluorescence emissions in the neurite regions of ionomycin-treated N1E-115 cells (). This result indicates that treatment with ionomycin induces calcium ion influx into N1E-115 cells within a short time.
Figure 2. Ionomycin induces calcium influx in N1E-115 cells. The relative intensity of Fluo-4 AM emissions is shown in the presence or absence of ionomycin (A). Black boxes and white circles indicate control and ionomycin-treated cells, respectively. Fluorescence emissions before the start of incubation in each cell were set to 1. Images were taken using a time-lapse live cell imaging system (B). Images in B are shown as merged fluorescence- and bright-field images. Images in C are shown as fluorescence- and bright-field images at high magnification. Arrows show fluorescence emissions of neurite regions. One experiment per dish was set to at least four different fields and recorded every 2 min over 3 h. Each column represents the mean of four independent experiments. Data were analyzed using one-way ANOVA, **indicates p < .01 compared with control.
Ionomycin induces ROS production in N1E-115 cells
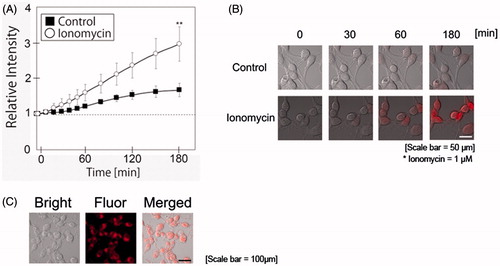
In order to clarify the relationship between calcium influx by ionomycin and oxidative stress, MitoSOXTM was employed as an indicator of intracellular ROS production in N1E-115 cells in the presence or absence of ionomycin. As shown in , ionomycin treatment significantly increased ROS production in N1E-115 cells. shows the localization of mitochondria in N1E-115 cells using MitoTracker®. The localization of mitochondria did not differ significantly between control and ionomycin-treated N1E-115 cells. Although we attempted to detect MitoTracker® fluorescence emissions in the neurite regions of ionomycin-treated N1E-115 cells, we were unsuccessful. Fluorescence emissions of MitoSOXTM were greater in nuclear region of ionomycin-treated N1E-115 cells. We were not able to take a correlation between mitochondria and MitoSOXTM fluorescence emissions in our experimental model. These results indicate that ionomycin treatment induces ROS production in intracellular region of N1E-115 cells.
Figure 3. Ionomycin induces ROS production in N1E-115 cells. Relative intensities of MitoSOXTM emissions are shown in the presence or absence of ionomycin (A). White circles and black boxes indicate ionomycin-treated cells and controls, respectively. Fluorescence emissions before the start of incubation in each cell were set to 1. Images were taken using a time-lapse live cell imaging system (B). Localization of mitochondria was determined using Mitotracker® (C). Images in B and C are shown as merged fluorescence- and bright-field images. One experiment per dish was set to at least four different fields and recorded every 10 min for 3 h. The figure shows up to 3-h incubation. Each column represents the mean of four independent experiments. Data were analyzed using a one-way ANOVA, **indicates p < .01 compared with control.
Ionomycin induces mitochondrial lipid peroxidation in N1E-115 cells
In order to clarify the oxidative damages of subcellular organelles by ionomycin, we assessed mitochondria-dependent lipid peroxidation using the fluorescent imaging dye MitoPeDPP.
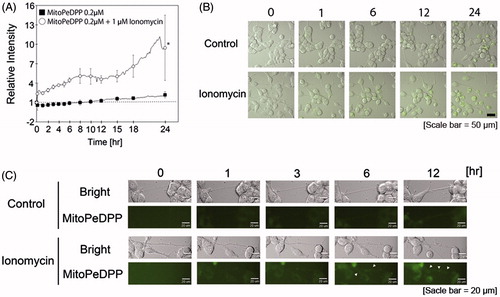
In accordance with our MitoPeDPP pre-experiment, ionomycin-treated N1E-115 cells were treated with 0.2 μM MitoPeDPP for 24 h. As shown in , the relative intensity of MitoPeDPP significantly increased in ionomycin-treated cells compared to the control. Specifically, after 18-h incubation, the relative intensity of MitoPeDPP increased markedly. The relative intensity was more than 5-fold that of the control at 24-h incubation. Although weak, we detected MitoPeDPP fluorescence emissions in the neurite regions of ionomycin-treated N1E 115 cells (). As live cells were used in this experiment, their neurite morphology was constantly changing, that is, elongation, shrinkage, and branching. Thus, we were unable to detect fluorescence emissions in the same neurite region for the entire 24-h duration.
Figure 4. Ionomycin induces mitochondrial lipid peroxidation in N1E-115 cells. One experiment per dish was set to at least four different fields and recorded every 2 min for 3 h. The relative intensities of MitoPeDPP emissions are shown in the presence or absence of ionomycin (A). White circles and black boxes show ionomycin-treated cells and controls, respectively. Fluorescence emissions before the start of incubation in each cell were set to 1. *indicates p < .001 compared with control. Images were taken using a time-lapse cell imaging system and are shown as merged fluorescence- and bright-field images (B). Fluorescence- and bright-field images are shown; arrows show the fluorescence emissions of neurite regions (C). One experiment per dish was set to at least four different fields and recorded every 10 min for 24 h. Each column represents the mean of four independent experiments. Data were analyzed using a one-way ANOVA.
Ionomycin induces lipid peroxidation in N1E-115 cells
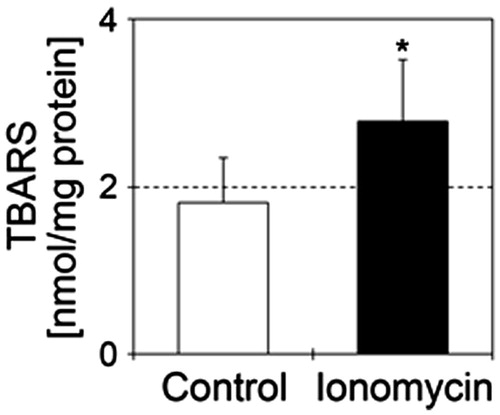
Finally, we measured lipid peroxidation products in N1E-115 cells treated with 1 μM ionomycin. Treatment of N1E-115 cells with 1 μM ionomycin significantly increased TBARS values compared to the control ().
Figure 5. Ionomycin induces lipid peroxidation in N1E-115 cells. TBARS values are shown in the presence or absence of 1 μM ionomycin. Details of sample preparation and experimental conditions are as described in the section “Materials and methods”. White and black bars show control (n = 5) and ionomycin-treated cells (n = 5), respectively. Seventy-two hours after culture for neurite elongation, cells were treated with 1 μM ionomycin for 24 h. Data were analyzed using a Student’s t-test, indicates *p < .05 and ***p < .001 compared with control.
Discussion
Ionomycin induces neurite degeneration prior to induction of cell death via calcium influx in N1E-115 cells
In the present study, ionomycin treatment induced cell death in a concentration- and time-dependent manner (). This result was similar to our previous study of hydrogen peroxide-treated models [Citation19,Citation20]. However, our ultimate aim in these studies was to determine important events that occur prior to the induction of cell death. In the case of neuronal cells, neurogenesis is difficult to induce in the normal healthy adult brain, except for one region of the hippocampus. Therefore, we focused on neurite conditions. Neurites play important roles in neurotransmission and are capable of expanding and contracting [Citation19,Citation32]. Previously, we reported neurite degeneration in hydrogen peroxide- [Citation19,Citation20] and AAPH-treated cells [Citation25]. Treatment with hydrogen peroxide and AAPH induced membrane oxidation before the induction of cell death. We reported that the level of lipid hydroperoxide was significantly increased in hydrogen peroxide-treated cells [Citation19]. In these cases, membrane dysfunction, including the alteration of receptors and ion channels will be induced by oxidation, and the influx of inorganic ions may occur. In order to determine the relationship between the influx of inorganic ions and neurite degeneration, we reproduced these conditions using ionomycin in this study. Ionomycin is a well-known calcium ionophore that is used to enhance intracellular calcium concentrations. Calcium ions play a crucial role in signaling pathways in many living cells [Citation34,Citation35]. However, elevation of the calcium concentration induces cell toxicity [Citation36,Citation37]. Hyperactivation of the N-methyl-D-aspartate receptor (NMDAR) induces calcium overload and cell death via hyperpolarization of the mitochondrial membrane potential [Citation38]. Tumor necrosis factor-α induces retinal ganglion cell death via calcium-permeable α-amino-3-hydroxy-5-methyl-4-isooxazolepropionic acid (AMPA) receptor activation [Citation39]. In this study, we observed neurite degeneration before the induction of cell death in ionomycin-treated N1E-115 cells (). Neurites showed fragmentation, beading, and shrinkage in ionomycin-treated cells. These morphological changes are similar to our previous results [Citation19,Citation20,Citation25]. In order to clarify the mechanism of the relationship between neurite degeneration and intracellular calcium influx, we assessed calcium influx with the fluorescence dye Fluo-4 AM using a time-lapse live cell imaging system ( and Supplemental movie file 1). Fluorescence emission was significantly and rapidly enhanced in ionomycin-treated cells compared to control cells. Fluo4-AM fluorescence was detected in the cell soma as well as the neurite regions in ionomycin-treated N1E-115 cells. However, the fluorescence of neurites was much lower than that of the cell soma. It is possible that an influx of calcium ions had also occurred in our previous AAPH- and hydrogen peroxide-treated models [Citation19,Citation20,Citation25]. These results suggest that the influx of calcium ions into cells is one reason for ionomycin-induced neurite degeneration and cell death. However, our results showed that the relative intensity of Fluo-4 AM continued to increase until 3 h after treatment with ionomycin in N1E-115 cells. Typically, an influx of calcium ions into cells is believed to occur immediately [Citation40,Citation41]. There is a possibility that the ionomycin-induced influx of calcium ions could induce calcium leakage from the mitochondria and endoplasmic reticulum. This process is known as calcium-induced calcium release [Citation42,Citation43]. Further investigation is needed to clarify the relationship between changes in intracellular calcium concentrations and induction of neurite degeneration in our cell model.
Ionomycin induces ROS production and oxidation in N1E-115 cells
In order to clarify the effects of ionomycin-induced calcium influx, we measured ROS production and lipid peroxidation levels using fluorescent dyes. First, MitoSOXTM was used to determine intracellular ROS production in the N1E-115 cells [Citation44,Citation45]. In this study, we recorded fluorescence emission by MitoSOXTM every 10 min for 24 h using a time-lapse live cell imaging system ( and Supplemental movie file 2). Within 3 h after ionomycin treatment, MitoSOXTM fluorescence emission was significantly increased compared to the control. The difference in MitoSOXTM fluorescence intensities between ionomycin-treated cells and the control increased gradually. Specifically, the difference in intensity appeared to increase after 1 h of ionomycin treatment. These results indicate that enhanced MitoSOXTM fluorescence emission is caused by the ionomycin-induced calcium influx. After binding to MitoSOXTM and ROS, the complex binds to the nucleic acids and becomes highly fluorescent (described in the product information of the manufacturer’s homepage, https://tools.thermofisher.com/content/sfs/manuals/mp36008.pdf). The nuclear region in ionomycin-treated cells appeared to increase in size. However, nuclear region in control cells showed no swelling. As a result, it is difficult to detect the fluorescence emission of MitoSOXTM in the neurite regions of ionomycin-treated N1E-115 cells. Notably, some papers have raised questions about MitoSOXTM reliability [Citation46]. We thus assessed cytoplasmic superoxide production using CellROX® fluorescent dye (Thermo Fisher Scientific Inc.). The result of CellROX® was similar to that of MitoSOXTM. However, the difference in fluorescence emissions between ionomycin-treated and control cells was smaller than that observed in the MitoSOXTM study (data not shown). After 24-h incubation, the difference in fluorescence emissions between ionomycin-treated cells and the control cells was less than 2-fold. These results indicate that treatment with ionomycin accelerates cellular oxidation in N1E-115 cells. Contrary to expectations, the fluorescence emission of control cells increased mildly (). Two reasons are proposed for this result. First, because the culture dishes are placed on a rotating platform, their rotation differs at each measurement point. The cells were possibly affected by this movement. The second reason is related to the medium. In this study, when we measured the fluorescence emissions, the medium was changed from the culture medium to the recording medium. Thus, the difference in medium composition may have affected the cells.
Next, we measured mitochondrial lipid peroxidation using the specific fluorescent dye MitoPeDPP, which contains a triphenylphosphonium moiety. Because mitochondria have a triphenylphosphonium moiety, this fluorescence dye can traverse the mitochondrial membrane, gradually accumulating in the inner mitochondrial membrane [Citation47]. Finally, MitoPeDPP reacts with lipid peroxidation products in the mitochondrial inner membranes, emitting light. In this study, we measured fluorescence emission every 10 min for 24 h using a time-lapse live cell imaging system. The fluorescence emission of MitoPeDPP was significantly increased in ionomycin-treated cells compared to the control ( and Supplemental movie file 3). The difference in fluorescence emissions between ionomycin-treated cells and control cells was more than 5-fold after 24-h incubation. Furthermore, the difference in MitoPeDPP fluorescence emission appeared to increase after 18-h treatment with ionomycin. Although very weak, we detected MitoPeDPP fluorescence emission in the neurite regions of ionomycin-treated N1E-115 cells (). In order to continuously record the same neurite morphology for the full 24-h period after ionomycin treatment, we recorded numerous areas in the culture dishes. Because the neurite morphology is constantly changing, we were unable to record fluorescence emission of MitoPeDPP in individual neurite regions for the complete 24-h duration. The technical challenges posed were very difficult. However, we detected the MitoPeDPP fluorescence emission in the neurite regions after 6- and 12-h treatment with ionomycin. The TBARS value was significantly higher in ionomycin-treated cells compared to the control (). We did not isolate mitochondria in this assay. This result indicates that ionomycin-induced calcium influx and ROS production gradually induced whole-cell oxidation.
Oxidation via ionomycin-mediated calcium influx induces neurite degeneration in N1E-115 cells
Several lines of evidence have been presented with respect to calcium-dependent neurite degeneration. In the presence of calcium in the culture media, ganglion cells showed axonal degeneration via alteration of collapsin response mediator protein-2 by activated calpain [Citation32]. In this study, calcium-free media did not induce neurite degeneration in calpain-treated cells. Calpain is a cysteine protease that is activated by calcium. One proposed mechanism of calcium-related neurite degeneration involves changes in mitochondrial permeability transition mediated by calpain [Citation48]. Villegas et al. [Citation49] reported that calcium release from the axonal endoplasmic reticulum in ganglion cells accelerated axonal degeneration via ryanodine receptor activation of mitochondria. Littlejohns et al. [Citation50] reported on the relationship between intracellular calcium concentration and ROS production in the cardiac mitochondria of a high-fat mouse model. Furthermore, isolated rat liver mitochondria were treated with calcium-induced ROS [Citation51]. These studies showed that changes in calcium concentrations affect mitochondrial function, and one possible reason for this may be related to ROS. Furthermore, the relationship between altered calcium homeostasis and neurodegenerative disorders has recently been highlighted [Citation52]. In our study, we detected the fluorescence emissions of Fluo4-AM and MitoPeDPP dyes in the neurite regions of ionomycin-treated N1E-115 cells. We found that a portion of mitochondria was localized in neurites in hydrogen peroxide-treated neuro2a cells [Citation53]. It is possible that treatment with ionomycin induces mitochondrial oxidation in neurite regions of N1E-115 cells. We are continuing to study the relationship between mitochondrial dysfunction via calcium influx into intracellular regions and neurite degeneration. Furthermore, the influx of calcium accelerates calcium leakage from the mitochondria and endoplasmic reticulum via membrane oxidation of the mitochondria and endoplasmic reticulum. We are currently isolating cytoskeletal proteins and investigating the ratio of acetylation and nitration (data not shown), as calcium-related proteins (including calpain) play a role in the maintenance of microtubule stabilization.
Conclusion
In the present study, we observed that treatment with ionomycin induces neurite degeneration before the induction of cell death. One possible mechanism of ionomycin-induced neurite degeneration is related to calcium influx into the intracellular region and cellular oxidation. We recorded the fluorescence emissions of intracellular ROS production and lipid peroxidation products using a time-lapse cell imaging model. ROS is related to many neurodegenerative disorders. We anticipate that the pathology observed in certain neurodegenerative disorders may be attributable to a similar mechanism. In the near future, we aim to clarify the detailed mechanisms of calcium-induced neurite degeneration in neuronal cells.
IFRA_1227074_-_Supplementary_file.zip
Download Zip (4.1 MB)Acknowledgements
The authors would like to thank Mr. Shinichi Endo (Dojin East, Tokyo, Japan) for his technical assistance.
Disclosure statement
The authors confirm that there are no conflicts of interest.
Funding
This work was supported by the Ministry of Education, Culture, Sports, Science, and Technology (MEXT)-Supported Program for the Strategic Research Foundation at Private Universities. This study was also supported by a grant-in-aid for Project Research from the Shibaura Institute of Technology (Tokyo, Japan).
References
- Butterfield DA. The 2013 SFRBM discovery award: selected discoveries from the butterfield laboratory of oxidative stress and its sequela in brain in cognitive disorders exemplified by Alzheimer disease and chemotherapy induced cognitive impairment. Free Radic Biol Med 2014;74:157–174.
- Seet RC, Lee CY, Lim EC, Tan JJ, Quek AM, Chong WL, et al. Oxidative damage in Parkinson disease: measurement using accurate biomarkers. Free Radic Biol Med 2010;48:560–566.
- Floyd RA, Hensley K. Oxidative stress in brain aging. Implications for therapeutics of neurodegenerative diseases. Neurobiol Aging 2002;23:795–807
- Reiter RJ, Oxidative damage in the central nervous system: protection by melatonin. Prog Neurobiol 1998;56:359–384.
- Watson SN, Nelson MA, Wildering WC. Redox agents modulate neuronal activity and reproduce physiological aspects of neuronal aging. Neurobiol Aging 2012;33:149–161.
- Sies H. Oxidative stress: oxidants and antioxidants. Exp Physiol 1997;82:291–295.
- Omoi NO, Arai M, Saito M, Takatsu H, Shibata A, Fukuzawa K, et al. Influence of oxidative stress on fusion of pre-synaptic plasma membranes of the rat brain with phosphatidyl choline liposomes, and protective effect of vitamin E. J Nutr Sci Vitaminol 2006;52:248–255.
- Urano S, Asai Y, Makabe S, Matsuo M, Izumiyama N, Ohtsubo K, Endo T. Oxidative injury of synapse and alteration of antioxidative defense systems in rats, and its prevention by vitamin E. Eur J Biochem 1997;245:64–70.
- Cadenas E, Davies KJ. Mitochondrial free radical generation, oxidative stress, and aging. Free Radic Biol Med 2000;29:222–230.
- Gredilla R, Sanz A, Lopez-Torres M, Barja G. Caloric restriction decreases mitochondrial free radical generation at complex 1 and lowers oxidative damage to mitochondrial DNA in the rat heart. FASEB J 2001;15:1589–1991.
- Niki E. Lipid peroxidation: physiological levels and dual biological effects. Free Radic Biol Med 2009;47:469–484.
- Harman D. Aging: a theory based on free radical and radiation chemistry. J Gerontol 1956;11:298–300.
- An FM, Chen S, Xu Z, Yin L, Wang Y, Liu AR, et al. Glucagon-like peptide-1 regulates mitochondrial biogenesis and tau phosphorylation against advanced glycation end products-induced neuronal insult: studies in vivo and in vitro. Neuroscience 2015;300:75–84.
- Masoud ST, Vecchio LM, Bergeron Y, Hossain MM, Nguyen LT, Bermejo MK, et al. Increased expression of the dopamine transporter leads to loss of dopamine neurons, oxidative stress and I-DOPA reversible motor deficits. Neurobiol Dis 2015;74:66–75.
- Gaki GS, Papavassiliou AG. Oxidative stress-induced signaling pathways implicated in the pathogenesis of Parkinson’s disease. Neuromolecular Med 2014;16:217–230.
- Zhang L, Bahety P, Ee PL. Wnt co-receptor LRP5/6 overexpression confers protection against hydrogen peroxide-induced neurotoxicity and reduces tau phosphorylation in SH-SY5Y cells. Neurochem Int 2015;87:13–21.
- Wang M, Li YJ, Ding Y, Zhang HN, Sun T, Zhang K, et al. Silibinin prevents autophagic cell death upon oxidative stress in cortical neurons and cerebral ischemia-reperfusion injury. Mol Neurobiol 2015;53:932–943.
- Jia J, Ma L, Wu M, Zhang L, Zhang X, Zhai Q, et al. Anandamide protects HT22 cells exposed to hydrogen peroxide by inhibiting CB1 receptor-mediated type 2 NADPH oxidase. Oxid Med Cell Longev 2014;2014:893516.
- Fukui K, Ushiki K, Takatsu H, Koike T, Urano S. Tocotrienols prevent hydrogen peroxide-induced axon and dendrite degeneration in cerebellar granule cells. Free Radic Res 2012;46:184–193.
- Fukui K, Takatsu H, Koike T, Urano S. Hydrogen peroxide induces neurite degeneration: prevention by tocotrienols. Free Radic Res 2011;45:681–691.
- Fukui K, Takatsu H, Shinkai T, Suzuki S, Abe K, Urano S. Appearance of amyloid beta-like substances and delayed-type apoptosis in rat hippocampus CA1 region through aging and oxidative stress. J Alzheimers Dis 2005;8:299–309.
- Hensley K, Harris-White ME. Redox regulation of autophagy in healthy brain and neurodegeneraion. Neurobiol Dis 2015;84:50–59.
- Kilinc D, Gallo G, Barbee KA. Mechanical membrane injury induces axonal beading through localized activation of calpain. Exp Neurol 2009;219:553–561.
- Kim JY, Shen S, Dietz K, He Y, Howell O, Reynold R, Casaccia P. HDAC1 nuclear export induced by pathological conditions is essential for the onset of axonal damage. Nat Neurosci 2010;13:180–189.
- Fukui K, Sekiguchi H, Takatsu H, Koike T, Koike T, Urano S. Tocotrienol prevents AAPH-induced neurite degeneration in neuro2a cells. Redox Rep 2013;18:238–244.
- Kantamneni S. Cross-talk and regulation between glutamate and GABAB receptors. Front Cell Neurosci 2015;9:135.
- Paula-Lima AC, Adasme T, Hidalgo C. Contribution of Ca2+ release channels to hippocampal synaptic plasticity and spatial memory: potential redox modulation. Antioxid Redox Signal 2014;21:892–914.
- Chakroborty S, Stutzmann GE. Calcium channelopathies and Alzheimer’s disease: insight into therapeutic success and failures. Eur J Pharmacol 2014;739:83–95.
- Suzuki M, Nagai Y, Wada K, Koike T. Calcium leak through ryanodine receptor is involved in neuronal death induced by mutant huntingtin. Biochem Biophys Res Commun 2012;429:18–23.
- Guerrero-Hernández A, Ávila G, Rueda A. Ryanodine receptors as leak channels. Eur J Pharmacol 2014;739:26–38.
- Kaneai N, Fukui K, Koike T, Urano S. Changes in the levels of CAM kinase II and synapsin I caused by oxidative stress in the rat brain, and its prevention by vitamin E. Adv Biosci Biotechnol 2011;3:1199–1205.
- Touma E, Kato S, Fukui K, Koike T. Calpain-mediated cleavage of collapsin response mediator protein (CRMP)-2 during neurite degeneration in mice. Eur J Neurosci 2007;12:3361–3381.
- Ohkawa H, Ohishi N, Yagi K. Assay for lipid peroxides in animal tissue by thiobarbituric acid reaction. Anal Biochem 1979;95:351–358.
- Quijada P, Hariharan N, Cubillo JD, Bala KM, Emathinger JM, Wang BJ, et al. Nuclear calcium/calmodulin-dependent protein kinase II signaling enhances cardiac progenitor cell survival and cardiac lineage commitment. J Biol Chem 2015;290:25411–25426.
- Bhosale G, Sharpe JA, Sundier SY, Duchen MR. Calcium signaling as a mediator of cell energy demand and a trigger to cell death. Ann N Y Acad Sci 2015;1350:107–116.
- Ma SH, Zhuang QX, Shen WX, Peng YP, Qiu YH. Interleukin-6 reduces NMDAR-mediated cytosolic Ca2+ overload and neuronal death via JAK/CaN signaling. Cell Calcium 2015;58:286–295.
- Fernandes HB, Baimbridge KG, Church J, Hayden MR, Raymond LA. Mitochondrial sensitivity and altered calcium handling underlie enhanced NMDA-induced apoptosis in YAC128 model of Huntington’s disease. J Neurosci 2007;27:13614–13623.
- Marshall J, Wong KY, Rupasinghe CN, Tiwari R, Zhao X, Berberoglu ED, et al. Inhibition of N-methyl-D-aspartate-induced retinal neuronal death by polyarginine peptides is linked to the attenuation of stress-induced hyperpolarization of the inner mitochondrial membrane potential. J Biol Chem 2015;290:22030–22048.
- Cueva Vargas JL, Osswald IK, Unsain N, Aurousseau MR, Barker PA, Bowie D, Di Polo A. Soluble tumor necrosis factor alpha promotes retinal ganglion cell death in glaucoma via calcium-permeable AMPA receptor activation. J Neurosci 2015;35:12088–12102.
- Back MJ, Lee HK, Lee JH, Fu Z, Son MW, Choi SZ, et al. P2X1 receptor-mediated Ca2+ influx triggered by DA-9801 potentiates nerve growth factor-induced neurite outgrowth. ACS Chem Neurosci. [Epub ahead of print]. doi:10.1021/acschemneuro.6b00082.
- Ogawa M, Kurokawa T, Fujiwara K, Polat OK, Badr H, Takahashi N, Mori Y. Functional and structural divergence in human TRPV1 channel subunits by oxidative cysteine modification. J Biol Chem 2016;291:4197–4210.
- Endo M. Calcium-induced calcium release in skeletal muscle. Physiol Rev 2009;89:1153–1176.
- Sandler VM, Barbara JG. Calcium-induced calcium release contributes to action potential-evoked calcium transients in hippocampal CA1 pyramidal neurons. J Neurosci 1999;19:4325–4336.
- Batandler C, Fontaine E, Kériel C, Leverve XM. Determination of mitochondrial reactive oxygen species: methodological aspects. J Cell Mol Med 2002;6:175–187.
- Kudin AP, Bimpong-Buta NY, Vielhaber S, Elger CE, Kunz WS. Characterization of superoxide-producing sites in isolated brain mitochondria. J Biol Chem 2004;279:4127–4135.
- Zielonka J, Kalyanaraman B. Hydroethidine- and MitoSOX-derived red fluorescence is not a reliable indicator of intracellular superoxide formation: another inconvenient truth. Free Radic Biol Med 2010;48:983–1001.
- Shioji K, Oyama Y, Okuma K, Nakagawa H. Synthesis and properties of fluorescence probe for detection of peroxides in mitochondria. Bioorg Med Chem Lett 2010;20:3911–3915.
- Ma M. Role of calpains in the injury-induced dysfunction and degeneration of the mammalian axon. Neurobiol Dis 2013;60:61–79.
- Villegas R, Martines NW, Lillo J, Pihan P, Hernandez D, Twiss JL, Court FA. Calcium release from intra-axonal endoplastic reticulum leads to axon degeneration through mitochondrial dysfunction. J Neorusci 2014;34:7179–7189.
- Littlejohns B, Pasdois P, Duggan S, Bond AR, Heesom K, Jackson CL, et al. Hearts from mice fed a non-obesogenic high-fat diet exhibit changes in their oxidative state, calcium and mitochondria in parallel with increased susceptibility to reperfusion injury. PLoS One 2014;9:e100579.
- Grancara S, Battaglia V, Martinis P, Viceconte N, Agostinelli E, Toninello A, Deana R. Mitochondrial oxidative stress induced by Ca2+ and monoamines: different behaviour of liver and brain mitochondria in undergoing permeability transition. Amino Acids 2012;42:751–759.
- Overk CR, Rockenstein E, Florio J, Cheng Q, Masliah E. Differential calcium alterations in animal models of neurodegenerative disease: reversal by FK506. Neuroscience 2015;310:549–560.
- Fukui K, Masuda A, Hosono A, Suwabe R, Yamashita K, Shinkai T, Urano S. Changes in microtubule-related proteins and autophagy in long-term vitamin E-deficient mice. Free Radic Res 2014;48:649–658.