
 ?Mathematical formulae have been encoded as MathML and are displayed in this HTML version using MathJax in order to improve their display. Uncheck the box to turn MathJax off. This feature requires Javascript. Click on a formula to zoom.
Abstract
This study aimed to develop a technique to accelerate fish growth without using genetic modification or genome editing. We have prepared a reactor with four pairs of opposed electrodes and a high-voltage power supply for the discharge. An arc discharge generates a plasma-treated gas in the reactor. Plasma-treated gas containing active species such as nitric oxide (NO) was generated via an arc discharge in the atmosphere and inserted into an aquarium containing Nile tilapia. No ozone was detected in the plasma-treated gas. Plasma treatment gas was supplied to the 20 L tank at a flow rate of 10 L per minute for varying supply times. The supply duration of plasma-treated air to the water tank was 0.5, 2, 5, and 15 min. Tanks were prepared for each of these four conditions, and gas was supplied daily at the same time. We observed that on supplying plasma-treated gas to tilapia from the 16th week of age for 5 min daily, the average length of the fish at 31 weeks of age was ∼1.5 times longer than that of the control fish. All other supply time conditions were also found to grow acceleration over the control. In the 15-minute supply time condition, individual differences in body length were more significant. A sample had more growth suppression than controls. In other words, the results suggest that an excess supply of active species can cause growth inhibition. These results suggest that an optimal supply of plasma-treated gas has a growth-promoting effect on fish.
The fish growth was accelerated by supplying plasma-treated air to the tank.
The amount of ozone in the plasma-treated air was below the detection limit, and a large amount of RNS, such as nitric oxide, was generated.
After an experimental period of 16 to 31 weeks, the average length of fish in the most significant growth condition was 1.5 times that of the control fish.
Key policy highlights
Introduction
Owing to the increasing global marine product consumption over the years, extensive utilization of aquaculture is imperative to establish a sustainable fishery industry. However, a significant drawback of aquaculture constitutes its high production costs. With regard to this, selective breeding is applied to beget fast-growing edible fish varieties, shorten the aquaculture period, and reduce costs. Nevertheless, conventional selective breeding methods are expensive and time-consuming. Additionally, recent techniques such as genetic modification and genome editing contribute to environmental pollution owing to the natural runoff of the new genome-edited varieties. Therefore, methods not relying on direct breeding have recently been developed to accelerate fish growth, such as irradiating fish with specific-wavelength light [Citation1,Citation2] and controlling water temperature [Citation3,Citation4]. However, although the abovementioned methods are effective, they require facilities with large amounts of light and heat sources to be adequately applied to aquaculture and fish tanks. The tanks used in land-based aquaculture are approximate ≥ 10 t, and if five 1 kW-class floodlights are used to illuminate the tank for 5,000 h annually, the amount of electricity required would be 25 MWh/year. In addition, the heater would need a boiler fueled by heavy oil to operate 24 h/day, rendering the running cost more than floodlights. Thus, although these technologies have a positive effect on growth acceleration, they are yet to be practically applied due to ineffectiveness in terms of cost.
In recent years, research into the application of atmospheric pressure plasma to the life sciences has been active. For example, studies have been reported on the anti-tumor effects of Plasma-activated Ringer’s lactate solution [Citation5], blood coagulation by direct plasma treatment [Citation6], wound healing [Citation7], and gene and molecule delivery into cells [Citation8]. It has also been reported that plasma treatment of plant seeds enhances germination [Citation9]. On the other hand, there have been several reports on the effects of plasma treatment on fish. Rajesh et al. [Citation10] reported that plasma treatment of zebrafish embryos resulted in a small but significant reduction in the hatched zebrafish fry length-to-width ratio. They also described the cause of the reduction as plasma-generated ROS. Nam et al. [Citation11] reported that zebrafish caudal fin cut with a surgical blade and treated with an argon plasma jet regenerated faster than untreated samples. Miao et al. [Citation12] reported that atmospheric pressure low-temperature plasma enhances the gelling properties of myofibrillar protein from Alaska pollock. Thus, although plasma treatment has been reported to have various effects on fish, there are no reported cases of changes in the growth rate of farmed fish due to plasma treatment.
The supply of chemically active species to water tanks has been studied as a method of growth acceleration that does not require large-scale facilities. For instance, Iizuka et al. [Citation13] reported that the length and weight of goldfish doubled and quadrupled, respectively, by supplying ozone generated by an ozonizer to an aquarium compared with individuals not supplied with ozone. However, the report did not delineate the action mechanism of ozone on the growth acceleration of goldfish. When an organism is subjected to oxidative stress, antioxidant defense mechanisms are activated to accelerate the repair and regeneration of the damage that has occurred [Citation14,Citation15]. Thus, in the experiment by Iizuka et al. [Citation13], the antioxidant defense mechanism in goldfish exposed to ozone-induced oxidative stress may have led to growth acceleration.
Conversely, Fukunaga et al. [Citation16] reported that ozone supplied to aquaculture tanks of white-spotted char (Salvelinus leucomaenis) caused abnormal red blood cells and death owing to acute toxicity. Generally, active species possessing strong oxidizing power have a considerable adverse effect on living organisms. In humans, there have been reports of ozone inhalation causing hyperkalemia [Citation17], development and acceleration of retinal disease [Citation18], and visual deterioration [Citation19]. Furthermore, ozone inhalation has been implicated in accelerated lung tumor development in hamsters [Citation20]. Owing to these dangers, ozone-based medical applications have been banned in the United States since 2016 [Citation21]. Thus, we concluded that the application of ozone to fish should be avoided.
An active candidate species other than ozone is nitric oxide (NO). NO has been reported to exhibit wound-healing effects [Citation22–28]. The wound-healing effect accelerates the formation of new blood vessels and granulation tissue. For example, Lee et al. [Citation29] observed an increase in NO synthase activity and NO concentration in wound fluid following skin wounds in rats and reported a relationship between NO produced by macrophages and wound healing. Conversely, Murata et al. [Citation30] reported an increase in blood NO concentration and a decrease in blood pressure in mice following exposure to a gas containing active species via the inhalation of a He plasma jet, indicating that even NO produced by plasma can be absorbed by blood via the respiratory system and affect the organism.
Therefore, we hypothesized that supplying plasma-generated active species containing NO to fish in an aquarium would accelerate the formation of new blood vessels and granulation tissue, thereby accelerating fish growth. However, high NO concentrations are harmful to the human body. Additionally, NO is usually compressed and stored in high-pressure gas cylinders, thus making storage and handling difficult. We proposed generating and supplying NO using atmospheric pressure plasma to address these NO supplementation issues. Herein, we verified the growth-accelerating effect of plasma-generated active species containing NO by supplying the gas generated via an arc discharge in the atmosphere to fish (Nile tilapia) and evaluating fish growth using NO concentration as an indicator.
Materials and methods
Reactor and gas supply system
shows the structure of a reactor that generates NO via arc discharge. The reactor is composed of polyoxymethylene (POM) resin. It is cylindrical, with an outer and inner diameter of 55 and 5 mm, respectively, and has four pairs of counter electrodes composed of round copper rods, 6 mm in diameter. The distance between the electrodes is 3 mm. presents a schematic diagram of the experimental setup, including the gas supply path, the reactor that produces the active species, and valves that control the circulation system. shows the relationship between the gas supply process and the open/close state of the valves. The specific experimental procedure was as follows: first, valves 3 and 4 were closed, valves 1 and 2 were open, and the gas generated by the arc discharge was circulated for 20 min. After 20 min, valve 2 was closed, and valves 1, 3, and 4 were opened to supply gas to the water tank through valve 3 (). The pump’s flow rate was 10 L/min, and the supply duration of plasma-treated gas to the water tank after opening valves 1, 3, and 4 was 0.5, 2, 5, and 15 min, based on the NO concentration measurement results. Tanks were prepared for each of these four conditions, and gas was supplied daily at the same time. Each tank housed five fish. For comparison, fish were simultaneously kept in a tank without plasma treatment as a control. The temperature of the tanks was maintained at a constant 20 °C via a heater having a temperature control function.
Figure 1. Schematic diagram of the reactor.
The reactor is made of POM and has a structure with four pairs of copper electrodes. The diameter of the gas flow tube is 5 mm.
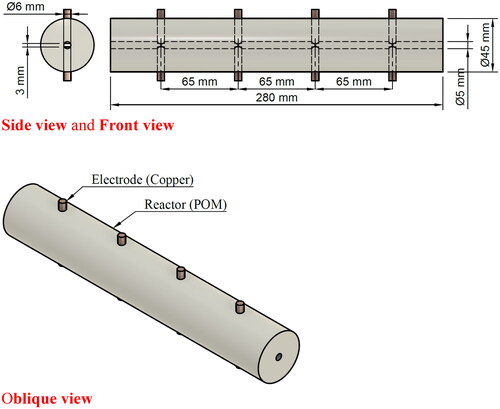
Figure 2. Schematic diagram of the arc discharge treatment and circulation device.
The volume of the circulation tank is about 10 L. During the 20 minutes that the reactor is discharging, the air inside circulates between the tank and the reactor, increasing the concentration of active species.
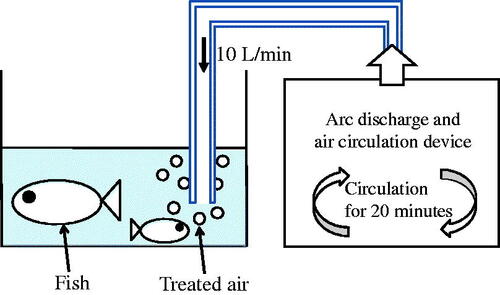
Table 1. Processing sequence and valve open/close status.
Electrical discharge treatment device
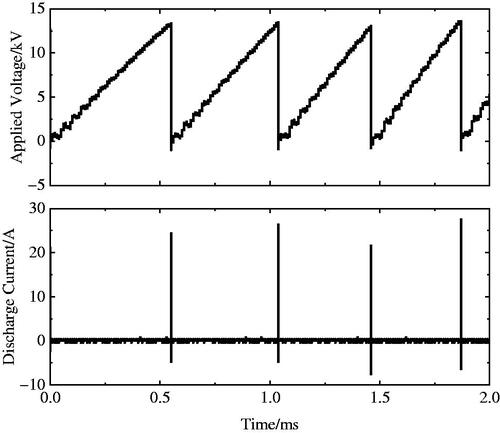
shows the discharge circuit. Applying a high voltage to the reactor produces an arc discharge. When a DC voltage is applied to the circuit, a charge occurs in the capacitor, and when the voltage reaches the discharge start voltage, a discharge occurs between the electrodes. The discharge subsequently decreases the charge in the capacitor, which falls below the discharge maintenance voltage and stops. Following the cessation of discharge, the capacitor voltage rises again owing to charging, and discharge occurs when the discharge start voltage is reached again. The discharge frequency is determined using 2 MΩ resistors and 1.1 nF capacitor in the circuit diagram and was measured to be ∼152.3 Hz. The starting discharge voltage was ∼7.2 kV. shows the discharge voltage and current waveforms. The discharge current could not be measured in this experiment due to noise. is the result of re-measuring almost the same voltage waveform and discharge current at a later time but not at the same frequency. This discharge frequency was measured to be ∼2.4 kHz.
Figure 3. Arc discharge generation circuit using RC circuit.
A capacitor is connected in series to drive the discharge in parallel with each electrode.
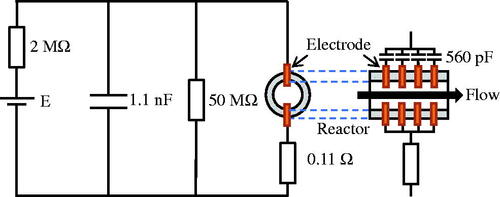
Figure 4. Waveforms of applied voltage and discharge current.
The arc discharge generated in the reactor is pulse-driven by the capacitor charging and discharging. The discharge frequency in the figure was measured to be ∼2.4 kHz, while the actual discharge frequency in the experiment was measured to be ∼152.3 Hz.
NO concentration measurement method
The NO concentration in the gas produced in the circulation process via arc discharge (hereafter referred to as “plasma-treated gas”) was measured using a gas detector (GASTEC: GV-100S), a gas detector tube for nitrogen oxide separation and determination (GASTEC: No. 10; measurement range for NO: 2.5 200 ppm and for NO2: 2.5 200 ppm), and an ozone measurement tool (GASTEC: No. 18; measurement range: 4400 ppm) were used. The above detectors measured the NO concentration at the end of the hose used to supply the plasma-treated gas to the water tank. The ozone concentration was below the detection limit under all experimental conditions.
The volume concentration of NO expressed in ppm, a, corresponds to a × 10−6 in 1 L plasma-treated gas. As the volume of 1 mol gas at 0 °C at 1 atm is 22.4 L, the mol concentration n of NO in 1 L plasma-treated gas at 25 °C at 1 atm can be expressed as follows:
(1)
(1)
As the mass of 1 mol NO is 30 × 103 mg, the mass M [mg/L] of NO in 1 L plasma-treated gas is expressed by the following equation:
(2)
(2)
As the flow rate of the plasma-treated gas in this experiment was 10 L/min, the NO supply rate v = f(a) [mg/min] supplied from the reactor is obtained using the following equation:
(3)
(3)
As the NO concentration changes over time with the initiation of plasma-treated gas supply to the tank, the NO supply rate v(t) can be expressed as v(t) = f(a(t)) when the time function a(t) is set. Therefore, the following equation calculates the cumulative NO supply Mtotal [mg] for the supply time T:
(4)
(4)
Methods for evaluating the growth rate of fish
We used the fish species Nile tilapia (Oreochromis niloticus). The Nile tilapia is native to larger parts of Africa, except Maghreb and almost all Southern Africa. Recently, there has been an increase in the production of Nile tilapia in Southeast Asia. Herein, five fish were kept in each 20-L tank. The fish growth was evaluated according to the change in their body lengths, measured from 15 to 31 weeks of age. During body length measurements, the fish were anesthetized using 0.1% 2-phenoxyethanol (99% pure), and their length was measured using calipers. The measurements were conducted once a week at a fixed date and time. The growth rate of the fish was determined from the length measurements, with the growth rate at the nth week of age being the slope of a regression line obtained by the least-squares method from three points: length of the fish at n weeks of age (Ln) and the number of days elapsed (dn), length of the fish the previous week (Ln-1) and the number of days elapsed (dn-1), and length of the fish the following week (Ln + 1) and number of days elapsed (dn + 1). This provided the fish’s growth rate from 16 to 30 weeks of age. The fish were fed commercial feed, and the feeding rate was 3 g/day (Nissin Marubeni Feed: Otohime).
Results
NO concentration
Reactor-produced NO was circulated through the device 20 min before feeding the arc discharge-generated gas to the water tank, thus allowing the NO concentration in the tank to be high immediately after starting the supply owing to the addition of NO stored in the tank to the NO produced by the reactor. Following the initiation of the NO supply, the NO in the tank decreases with time, finally settling on a constant value proportional to the NO produced by the reactor. shows the actual NO supply measured at the tip of the hose used to supply the tank. The supply rate of NO discharged from the reactor every minute was 2.45 mg/min at the start of supply according to Equationequation (3)(3)
(3) ; however, it decreased to 1.20 mg/min after 2 min and assumed a constant value of ∼0.55 mg/min after 4 min.
Figure 5. Supply time dependence of NO concentration and cumulative supply amount.
The NO concentration decreased in the first 4 minutes and remained unchanged and constant until 16 minutes.
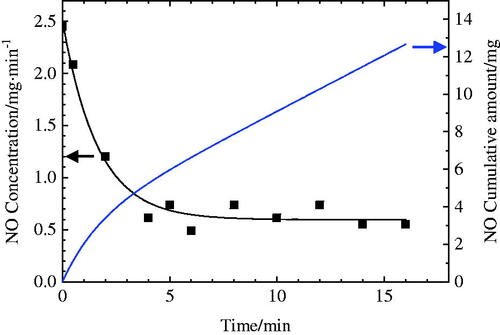
The solubility of NO in water at 20 °C was reported as 4.6% (4.6 ml/100 ml water)[Citation20]; thus, the maximum cumulative NO supply was considered 828 mL for an 18-L water tank. shows that the cumulative NO supply was 12 mg (8.96 mL) after a 15-min supply, which is sufficiently low. In addition, as the water in the tank was convected via aeration, the NO concentration dissolved in the tank was determined to be unsaturated as a whole or locally, even after a 15-min supply.
Accordingly, the cumulative NO supply rate was 1.5, 3, 6, and 12 mg, which is 1.5 × 2n−1 (n = 1, 2, 3, 4), based on 1.5 mg, and the NO supply times were 0.5, 2, 5, and 15 min. Therefore, the cumulative amount of NO supplied at each supply time was 1.1, 3.4, 6.0, and 12.1 mg, from the condition with the shortest supply time from . As the same feeding method was used in each condition, it can be safely assumed that the NO concentration ratio in the water is proportional to the feed rate, even when the total amount is not dissolved.
NO concentration
The gas produced via arc discharge also contains NO2. The produced NO2 dissolved in water and produced nitric acid through the following reaction:
As HNO3 is toxic to fish, we measured the pH of the aquarium tank using a pH meter following aeration to confirm that the water pH was maintained at a safe level for the fish by supplying plasma-treated gas. The tank water was agitated thrice, at 5, 10, and 15 min after supplying the plasma-treated gas to the tank, and then the pH was measured using a pH meter.
The results of the pH measurements are shown in . If a large amount of NO2 were produced, one would expect the pH to become acidic; however, there was no significant difference in the pH of the water tank before and after supplying the plasma-treated gas. Thus, we concluded that NO2 exhibits little effect on the pH of tank water.
Table 2. Relation between supply time and pH in the aquarium.
Relationship between body length and growth rate at different supply times of plasma-treated gas
shows the average body length of 16- to 32-week-old fish in four conditions at different plasma-treated gas supply times: 0 (control), 0.5, 2, 5, and 15 min. The error bars in the figure indicate the standard deviation. No data exist for the measurements at 26 and 27 weeks of age, as the experimental schedule did not allow such measurements. The figure shows that the slope of the control animals, which were not supplied with plasma-treated gas, became smaller with age (in weeks), especially after 21 weeks. As the slope represents the growth rate, the growth rate of the controls can be assumed to peak at ∼21 weeks of age, following which the growth rate tends to decrease. Conversely, fish supplied with plasma-treated gas showed a linear increase in body length. This different trend from that observed in the control specimens suggests that supplying plasma-treated gas suppresses the growth rate decline observed in the control group.
Figure 6. Relationship between age in weeks and body length according to the plasma-treated gas supply times.
The straight line in the figure is the least squares fit; the slope changes after 21 weeks of age. The higher the supply, the greater the slope after 21 weeks. However, the individual differences were more significant when feeding was 15 minutes.
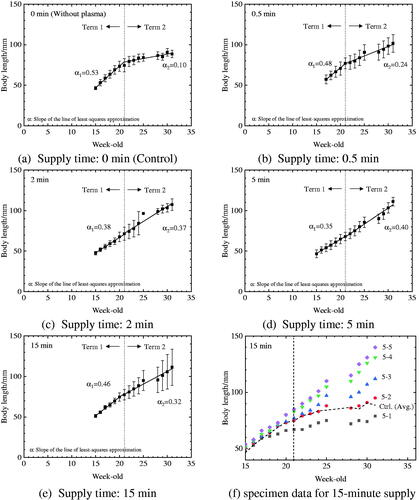
The average lengths of the 15- (control) and 31-week-old fish were 46.4 and 88.8 mm, respectively, and the average increase in body length was 42.2 mm. The average lengths of 15- and 31-week-olds at 5 min of feeding time were 51.4 and 111.4 mm, respectively, and the average increase in length was 60.0 mm, which was 1.5 times greater than that of the control, the most significant increase compared with the other conditions. For the group with a 15-min feeding period, the average body length at 15 and 31 weeks of age was 46.4 and 88.8 mm, respectively, and the average increase in body length was 60.0 mm. However, not all fish increased their body length after 21 weeks of age, resulting in a larger error bar than other feeding times. shows the body length data of each fish at the 15-min supply time and the average body length data of the control fish. As shown in the figure, the growth of fish 5–1 is more inhibited than the control, while fish 5–2 exhibits almost the same results as the control. The fish 5–3, 5–4, and 5–5 show accelerated growth compared with the control. For the 15-mi feeding period, growth is not enhanced for all fish, indicating that growth is suppressed on over-supply. The average lengths of the 15- and 31-week-olds were 47.6 and 107.4 mm, respectively, and the average increase in length was 59.8 mm at a feeding time of 2 min. The average lengths of 17- and 31-week-olds at 0.5 min feeding time were 57.2 and 101.6 mm, respectively, and the average length increase was 44.4 mm.
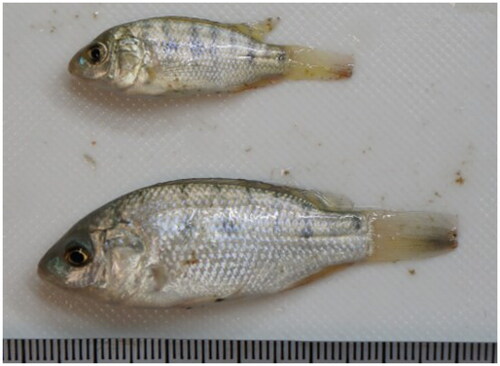
shows the relationship between average growth rate and age in weeks. The average growth rate of the control specimens was high before the age of 21 weeks when the specimens were young and had shorter body lengths. The growth of fish supplied with plasma-treated gas was suppressed. After 21 weeks of age, the average growth rate of the control fish continued to decrease, whereas the growth rate of the fish supplied with plasma-treated gas for 5 and 15 min increased. The average growth rate of the 31-week-old fish at the 5-min supply time was the largest among the growth rates evaluated in this study, reaching 1.1 mm/day. Conversely, the growth rates of the specimens at 0.5 and 2 min of plasma-treated gas supply were lower than those of the fish at 5 and 15 min, even after 21 weeks of age. shows the typical photo of Nile tilapia after the experiment. The top shows a sample from a control tank and the bottom shows a sample from a tank with active species. The sample from the tank with the active species grew about 1.5 times greater than the control.
Figure 7. Relationship between average growth rate and age in weeks at each supply time of the plasma-treated gas.
The highest growth rate was observed with 5 minutes, followed by 15 minutes.
At 31 weeks of age, the condition with the highest growth rate was 5 minutes of supply time. The condition with the next highest growth rate was 15 minutes of supply time; more or less than 5 minutes tended to decrease the growth rate, but more so than the control.
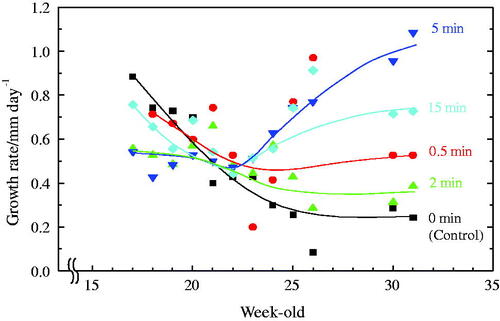
Figure 8. Typical photo of Nile tilapia after the experiment. Top: Sample in the control tank, Bottom: Sample in the tank with the active species.
These results suggest that the optimal amount of plasma-treated gas for growth promotion may depend on the age in weeks of the fish or on body length.
Discussion
Growth acceleration effect
The results revealed lower growth rates in fish from 16 to 20 weeks of age in the plasma-treated conditions than in the control. NO is known to promote blood flow [Citation31–33]. In humans, pediatric patients with pulmonary arterial hypertension in whom NO production is reduced owing to vascular endothelial damage were treated with a vasodilator, which is not a concern in adults. However, this treatment was discontinued for pediatric patients because of resulting hypotension [Citation34,Citation35]. Based on this case report, we can infer that in this study, excessive vasodilation due to NO may have caused hypotension in the younger fish when they still had shorter body lengths. The fact that the growth rate switched from suppressed to accelerated after 21 weeks of age suggests that growth was stopped due to functional impairment caused by hypotension in the younger fish, although it likely did not lead to severe disorders, such as ischemic symptoms.
The results also showed higher growth rates in fish in conditions wherein plasma-treated gases were supplied after 21 weeks of age than in control. The fact that NO, contained in the plasma-generated active species, promotes wound healing by forming new blood vessels and granulation tissue suggests that it promotes fish growth. However, the specific action mechanism, as with wound healing, remains to be elucidated, and it is necessary to clarify the effects of NO alone and the effects of plasma-generated active species other than NO on future fish growth.
Finally, variations in the body length measurements were noted during the study. Compared with the control at a supply time of 5 min, the variation of the specimens supplied with plasma-treated gas for 2 min was similar to that of the control. This is likely due to the fact that the appropriate amount of plasma-treated gas was supplied, resulting in stable growth promotion in all the specimens. For the 15-min supply, which was the most extended supply duration, the variation of the fish body length was more significant after 21 weeks of age. This may be because some specimens were supplied with too much plasma-treated gas, which suppressed growth, while others were supplied with the appropriate amount, resulting in accelerated growth.
Optimal NO supply
The fact that there was a clear change in the body length of fish at 21 weeks of age suggests that further growth promotion can be expected by adjusting the amount of plasma-treated gas supplied according to age and body length. For example, initiating the supply of plasma-treated gas after 21 weeks of age when the growth rate of the control begins to decline could avoid growth inhibition before 21 weeks of age. The cumulative effect of plasma-treated gas supply also warrants further verification.
Conclusion
Herein, plasma-treated gas generated via atmospheric pressure arc discharge was supplied to aquariums to evaluate its effect on the growth rate of fish (Nile tilapia). Five specimens were kept in each 20-L tank. Each tank was supplied with 10 L/min plasma-treated gas, and the supply times were 0.5, 2, 5, and 15 min based on the results of NO concentration measurements. The gas was supplied once daily for the above four conditions. As a result, the following results were obtained:
An increase in growth rate was observed for specimens supplied with plasma-treated gas after 21 weeks of age.
Before the age of 21 weeks, when the specimens had a shorter body length, the average growth rate of the plasma-untreated specimens (control) was high, while that of the specimens supplied with plasma-treated gas was suppressed.
The maximum increase in body length through 31 weeks of age occurred within 5 min of feeding time and a cumulative NO supply of 6.0 mg, increasing body length by 64.6 mm. This was >53% over the 42.2 mm increase in length of the control.
The average growth rate at 31 weeks of age at the 5 min supply time was the highest of the growth rates evaluated herein (1.1 mm/day).
Acknowledgments
This work was supported by Ehime University South Ehime Fisheries Research Center. This work was supported by Ehime University Research Unit.
Disclosure statement
No potential conflict of interest was reported by the author(s).
Additional information
Funding
References
- Boeuf G, Le Bail P-Y. Does light have an influence on fish growth? Aquaculture. 1999;177(1–4):129–152.
- Takahashi A, Mizusawa K, Furufuji S, et al. II-4. Application of particular wavelength of light in pisciculture. Nippon Suisan Gakkaishi. 2013;79(5):885. Japanese.
- Elliott JM. The energetics of feeding, metabolism and growth of brown trout (salmo trutta L.) in relation to body weight, water temperature and ration size. J Anim Ecol. 1976;45(3):923–948.
- Africa ADM, Aguilar JCCA, Lim CMS, et al. Automated aquaculture system that regulates Ph, temperature and ammonia, 017IEEE. 9th International Conference on Humanoid, Nanotechnology, Information Technology, Communication and Control, Environment and Management (HNICEM), IEEE: Manila, Philippines, 2017.
- Tanaka H, Mizuno M, Katsumata Y, et al. Oxidative stress-dependent and -independent death of glioblastoma cells induced by non-thermal plasma-exposed solution. J Clin Biochem Nutr. 2017;60(1):33–38.
- Sakakita H, Ikehara Y. Irradiation experiments on a mouse using a mild-plasma generator for medical applications. Plasma and Fusion Research. 2010;5: s2117.
- Bekeschus S, Schmidt A, Weltmann KD, et al. The plasma jet kINPen – a powerful tool for wound healing. Clin Plasma Med. 2016;4(1):19–28.
- Jinno M, Satoh S, Ikeda Y, et al. The new technology of molecular and gene introduction method using discharge plasma: plasma brings features of random genome integration-free and damage-free to cells, genomic-DNA and external introducing molecules. Jpn J Appl Phys. 2021;60(3):030502.
- Volin JC, Denes FS, Young RA, et al. Modification of seed germination performance through cold plasma chemistry technology. Crop Sci. 2000;40(6):1706–1718.
- Gandhirajan RK, Endlich N, Bekeschus S. Zebrafish larvae as a toxicity model in plasma medicine. Plasma Processes Polym. 2020;18(3).
- Nam MK, Kim GY, Yun SE, et al. Harmless effects of argon plasma on caudal fin regeneration and embryogenesis of zebrafish: novel biological approaches for safe medical applications of bioplasma. Exp Mol Med. 2017;49(7):e355.
- Miao W, Nyaisaba BM, Koddy JK, et al. Effect of cold atmospheric plasma on the physicochemical and functional properties of myofibrillar protein from Alaska pollock (theragra chalcogramma). Int J Food Sci Technol. 2022;55(22):517–525.
- Iizuka S. Japan Society for the Promotion of Science London. KAKENHI Grant Number 09878085, 1997.
- Sen CK. Oxidants and antioxidants in exercise. J Appl Physiol (1985). 1995;79(3):675–686.
- Halliwell B, Gutteridge JMC. Free radicals in biology and medicine. Oxford, UK: Oxford University Press; 1998.
- Fukunaga K, Suzuki T, Arita M, et al. Acute toxicity of ozone against morphology of gill and erythrocytes of Japanese charr (Salvelinus leucomaenis). Comp Biochem Physiol C Comp Pharmacol Toxicol. 1992;101(2):331–336.
- Tang WJ, Jiang L, Wang Y, et al. Ozone therapy induced sinus arrest in a hypertensive patient with chronic kidney disease: a case report. Medicine. 2017;96(50):e9265.
- Masuda T, Shimazawa M, Hara H. Retinal diseases associated with oxidative stress and the effects of a free radical scavenger (edaravone). Oxid Med Cell Longev. 2017;2017:9208489.
- Iwaki T, Sakata S, Urusitani M, et al. Hazards associated with ozone deodorization. J Jpn Vet Med Assoc. 2007;60(3):168–170. Japanese.
- Witschi H, Breider MA, Schuller HM. Failure of ozone and nitrogen dioxide to enhance lung tumor development in hamsters. Res Rep Health Eff Inst, Including a Commentary by the HEI Review Committee. 1993;(60):1–25. discussion 27–38.
- United States Food & Drug Administration. Code of Federal Regulations Title 21. 2019. 21CFR801.415.
- Tsutsui C, Hirata T, Komachi T, et al. Tissue and cell activation using micro-spot atmospheric pressure plasma source. Proceedings of the Institute of Electrostatics Japan. 2011;35(1):20–24.
- Tsutsui C, Hirata T, Yokoi Y, et al. Effect of neoangiogenesis using micro-spot plasma. Proceedings of the Institute of Electrostatics Japan. 2012;36(4):235–240.
- Hirata T, Kishimoto T, Tsutsui C, et al. Healing burns using atmospheric pressure plasma irradiation. Jpn J Appl Phys. 2014;53(1):010302.
- Tsutsui C, Lee M, Takahashi G, et al. Treatment of cardiac disease by inhalation of atmospheric pressure plasma. Jpn J Appl Phys. 2014;53(6):060309.
- Shekhter AB, Kabisov RK, Pekshev AV, et al. Experimental clinical substantiation of plasma dynamic therapy of wounds with nitric oxide. Biull Eksp Biol Med. 1998;126(8):210–215.
- Lee Y, Ricky S, Lim TH, et al. Wound healing effect of nonthermal atmospheric pressure plasma jet on a rat burn wound model: a preliminary study. J Burn Care Res. 2019;40(6):923–929.
- Kubinova S, Zaviskova K, Uherkova L, et al. Non-thermal air plasma promotes the healing of acute skin wounds in rats. Sci Rep. 2017;7:45183.
- Lee RH, Efron D, Tantry U, et al. Nitric oxide in the healing wound: a time-course study. J Surg Res. 2001;101(1):104–108.
- Murata S, Mori A, Watada M, et al. The effect of plasma inhalation for the cardiovascular system by rat. J Jpn Soc Appl Electromagn. 2013;21(2):260–265.
- Furchgott RF, Zawadzki JV. The obligatory role of endothelial cells in the relaxation of arterial smooth muscle by acetylcholine. Nature. 1980;288(5789):373–376.
- Ignarro LJ, Lippton H, Edwards JC, et al. Mechanism of vascular smooth muscle relaxation by organic nitrates, nitrites, nitroprusside and nitric oxide: evidence for the involvement of S-nitrosothiols as active intermediates. J Pharmacol Exp Ther. 1981;218(3):739–749.
- Inoue T, Matsuoka H, Higashi Y, et al. Flow-mediated vasodilation as a diagnostic modality for vascular failure. Hypertens Res. 2008;31(12):2105–2113.
- Green DJ, Dawson EA, Groenewoud HM, et al. Is flow-mediated dilation nitric oxide mediated?: a meta-analysis. Hypertension. 2014;63(2):376–382.
- Galiè N, Müller K, Scalise AV, et al. PATENT PLUS: a blinded, randomised and extension study of riociguat plus sildenafil in pulmonary arterial hypertension. Eur Respir J. 2015;45(5):1314–1322.