
Abstract
Iron is essential for all the lives and mitochondria integrate iron into heme and Fe-S clusters for diverse use as cofactors. Here, we screened mitochondrial proteins in KU812 human chronic myelogenous leukemia cells by glutathione S-transferase pulldown assay with PCBP2 to identify mitochondrial receptors for PCBP2, a major cytosolic Fe(II) chaperone. LC–MS analyses identified TOM20, sideroflexin-3 (SFXN3), SFXN1 and TOM70 in the affinity-score sequence. Stimulated emission depletion microscopy and proteinase-K digestion of mitochondria in HeLa cells revealed that TOM20 is located in the outer membrane of mitochondria whereas SFXN3 is located in the inner membrane. Although direct association was not observed between PCBP2 and SFXN3 with co-immunoprecipitation, proximity ligation assay demonstrated proximal localization of PCBP2 with TOM20 and there was a direct binding between TOM20 and SFXN3. Single knockdown either of PCBP2 and SFXN3 in K562 leukemia cells significantly decreased mitochondrial catalytic Fe(II) and mitochondrial maximal respiration. SFXN3 but not MFRN1 knockout (KO) in mouse embryonic fibroblasts decreased FBXL5 and heme oxygenase-1 (HO-1) but increased transferrin uptake and induced ferritin, indicating that mitochondrial iron entry through SFXN3 is distinct. MFRN1 KO revealed more intense mitochondrial Fe(II) deficiency than SFXN3 KO. Insufficient mitochondrial heme synthesis was evident under iron overload both with SFXN3 and MFRN KO, which was partially reversed by HO-1 inhibitor. Conversely, SFXN3 overexpression caused cytosolic iron deficiency with mitochondrial excess Fe(II), which further sensitized HeLa cells to RSL3-induced ferroptosis. In conclusion, we discovered a novel pathway of iron entry into mitochondria from cytosol through PCBP2-TOM20-SFXN3 axis.
Keywords:
Introduction
Iron is an essential element for all the lives on the earth from prokaryotes to humans. There are at least three major reasons for this. Iron is a transition metal with redox activity between Fe(II) and Fe(III), allowing steady electron flow inside cells [Citation1,Citation2]. An extreme excess would lead to the presence of catalytic Fe(II), thus Fenton reaction in vivo, generating hydroxyl radicals in the presence of H2O2, which is the most reactive chemical species in the biological system [Citation3]. Second, iron has been abundant on the earth’s crust as minerals [Citation4]. Furthermore, solubility of Fe(III) at pH 7.4 is almost nil and is regulated by chelators or chaperones whereas acidic pH results in significantly higher solubility [Citation5]. Thus, iron can be stored inside ferritin core or transported via transferrin within blood vessels safely as insoluble Fe(III) but is transferred through bio-membranes either into, inside or out of the cells as soluble Fe(II) by the use of various specific oxidoreductases [Citation6].
Important biological functions of iron are carried out as a co-factor for various biomolecules, including enzymes and oxygen-transporting proteins, either in the form of Fe(II), Fe-S cluster or heme. The latter two forms are synthesized only in mitochondria, which requires a large amount of iron entry [Citation7]. Starting from the 1990s, a variety of molecular mechanisms associated with iron transport and metabolism have been discovered [Citation8,Citation9]. Mitoferrin 1/2 (MFRN1/2) are identified as iron transporters from cytosol to mitochondria, and MFRN1 is required when mitochondrial iron demand is high, such as in erythroid cells [Citation10]. However, global knockout of ubiquitously expressed MFRN2 does not affect viability in mice but affects male fertility [Citation11], suggesting the presence of the other pathway(s) for mitochondrial iron supply. To make things more complicated, the status of iron in the cytosol has not been well elucidated yet. Cytosolic Fe(II) includes chelated form with phosphate compounds or glutathione (GSH). Recently we found that poly(rC)-binding protein-2 (PCBP2) is a major cytosolic Fe(II) chaperone protein [Citation12], which can receive Fe(II) from DMT1 (SLC11A2) [Citation13] and heme oxygenase [Citation14] as non-catalytic labile Fe(II), and alternatively can load Fe(II) to an iron exporter, ferroportin (SLC40A1) [Citation15].
In the present study, we undertook to identify mitochondrial iron receptor proteins for PCBP2, considering the flow of Fe(II) inside cytoplasm. We comprehensively identified PCBP2-binding mitochondrial proteins from KU812 human chronic myelogenous leukemia cells with erythroid-differentiation, which revealed that a combination of translocases of the outer mitochondrial protein-20 (TOM20) and sideroflexin-3 (SFXN3) is a novel pathway for mitochondrial iron entry through cytosolic PCBP2.
Materials and methods
Cells and cell culture
Human chronic myelogenous leukemia cell lines, KU812 and K562 cells (Riken BRC, Tsukuba, Japan), were cultured in RPMI1640 (189-02025, Wako, Osaka, Japan) supplemented with 10% FBS (Biowest, Nuaillé, France). Mouse embryonic fibroblasts (MEFs) were isolated from C57BL/6 mice at embryonic day 13.5 (E13.5) and immortalized with SV40 large T antigen as described (https://doi-org.kyoto-u.idm.oclc.org/10.1038/nature03029). Human cervical adenocarcinoma cells (HeLa; ATCC, Manassas, VA), human embryonic kidney cells (HEK293T; ATCC) and MEFs were cultured in DMEM (043-30085, FUJIFILM, Tokyo, Japan) supplemented with 10% FBS. All the cells were cultured in the 37 °C moist incubator containing 5% CO2.
Cloning and plasmid construction
pGEX-2T-PCBP2 was generated in a previous study [Citation14]. pMXs_FLAG-SFXN1 (Addgene #110634), pMXs_FLAG-SFXN2 (Addgene #110636), pMXs_FLAG-SFXN3 (Addgene #110637), pMXs_FLAG-SFXN4 (Addgene #110638) and pMXs_FLAG-SFXN5 (Addgene #110639) were purchased. These DNA constructs were amplified in competent DH5α E. coli and purified by alkaline lysis method. Finally, DNA concentration was checked by Nanodrop (Thermo Fisher Scientific).
Protein expression and purification of GST-fusion proteins
For the purification of the GST-fusion proteins, E. coli BL21 cells transformed with protein-expression plasmids by using CaCl2 transformation method were grown in LB broth with 100 μg/mL ampicillin at 37 °C to an OD600 of 0.6, and recombinant GST gene expression was then induced by the addition of 500 µM isopropyl β-D-1-thiogalactopyranoside (IPTG) (096-05143, FUJIFILM) for 6 h at room temperature (RT). Cells were pelleted, resuspended in P-lysis buffer (50 mM sodium phosphate pH 6.4, 0.1% NP-40, 60 mM NaCl, 1 mM DTT, 1× protease inhibitor cocktail (PI; cOmplete Mini, EDTA-free Cat#11836170001, Sigma Aldrich) and disrupted by sonication. Lysates were cleared by centrifugation at 21,600 × g for 10 min at 4 °C. GST and GST-PCBP2 were purified on glutathione-sepharose 4 Fast Flow beads (GE Healthcare LifeSciences #17-5132-01). The GST beads were washed with P-lysis buffer four times with incubation under rotation at RT for 2 h, which was followed by centrifugation at 500 × g for 5 min to recover GST–fusion proteins.
Mitochondrial isolation for screening
Mitochondrial preparation was performed using a differential centrifugation method described in a previous report [Citation16] with modifications. KU812 cells (2 × 10⁷ cells) were washed with cold PBS, resuspended in 220 µL of RSB Hypo buffer (10 mM NaCl, 1.5 mM MgCl2, 10 mM Tris pH 7.5) and incubated for 8 min on ice. Cells were homogenized in a tight-fitting Dounce homogenizer with 20 strokes and mixed with 2.5 × MS buffer (525 mM D-mannitol, 175 mM sucrose, 12.5 mM Tris pH 7.5, 2.5 mM EDTA). Cell debris and nuclei were removed by the low-speed centrifugation (1500 × g, 5 min, 4 °C), and mitochondria were collected by the high-speed centrifugation (7000 × g, 15 min, 4 °C), which was stocked at −80 °C for the following experiments.
Binding of GST-PCBP2 and mitochondrial protein
Isolated mitochondria from KU812 were lysed in P-lysis buffer and mixed with GST-PCBP2 bound to GSH beads at 4 °C overnight. The beads were then washed with P-lysis buffer for four times, and the bound proteins were eluted with 6 M guanidine hydrochloride (17318-82, Nacalai Tesque).
Silver staining
Each sample was separated on 12% SDS gel under reducing condition. Silver staining of the gels was performed according to the standard protocol. In brief, gels were fixed in fixation solution (25% methanol and 5% acetic acid), sensitized in 0.02% sodium thiosulfate, stained in 0.1% silver nitrite and developed in developing solution (38% formaldehyde and 2% sodium carbonate). Acetic acid was used to stop the staining once the desired intensity was obtained.
Protein identification by mass spectrometry
The proteins were digested with trypsin for 16 h at 37 °C after reduction and alkylation. The peptides were analyzed by LC − MS using an Orbitrap Fusion mass spectrometer (ThermoFisher Scientific Inc., Waltham, MA) coupled to an UltiMate3000 RSLCnano LC system (Dionex Co., Amsterdam, The Netherlands) using a nano HPLC capillary column, 150 mm × 75 µm i.d. (Nikkyo Technos Co., Tokyo, Japan) via a nanoelectrospray ion source. Reversed-phase chromatography was performed with a linear gradient (0 min, 5% B; 100 min, 40% B) of solvent A (2% acetonitrile with 0.1% formic acid) and solvent B (95% acetonitrile with 0.1% formic acid) at an estimated flow rate of 300 nL/min. A precursor ion scan was carried out using a 400–1600 mass to charge ratio (m/z) prior to MS/MS analysis. Tandem MS was performed by isolation at 0.8 Th with the quadrupole, HCD fragmentation with normalized collision energy of 30%, and rapid scan MS analysis in the ion trap. Only those precursors with charge state 2–6 were sampled for MS2. The dynamic exclusion duration was set to 15 s with a 10-ppm tolerance. The instrument was run in top speed mode with 3-s cycles. The raw data were processed using either Proteome Discoverer 1.4 (Thermo Fisher Scientific) in conjunction with MASCOT search engine, version 2.6.0 (Matrix Science Inc., Boston, MA) for protein identification. Peptides and proteins were identified against human protein database in UniProt (release 2020_02), with a precursor mass tolerance of 10 ppm, a fragment ion mass tolerance of 0.8 Da. Fixed modification was set to carbamidomethylation of cysteine, and variable modifications were set to oxidation of methionine. Two missed cleavages by trypsin were allowed.
Immunofluorescence assays by stimulated emission depletion (STED) microscopy and SpinSR10
For immunofluorescence assays, 50,000 HeLa cells were plated on a cover slip (φ12 mm, No. 1.5H) coated by 10% CellMatrix Type I-C (Lot No. 211110; Nitta Gelatin, Yao, Japan). After 16 h, the cells were transfected with 500 ng of FLAG-SFXN3 plasmids by Lipofectamine 3000 following the manufacturer’s protocols. After 48 h incubation, cells were washed with PBS and fixed with 3% paraformaldehyde and 0.1% glutaraldehyde in PBS for 10 min. The cells were then washed three times with PBS and permeabilized with 0.3% NP-40, 0.05% Triton X-100, 0.1% BSA in PBS for 3 min. Cells were blocked for 1 h in blocking buffer (0.05% NP-40, 0.05% Triton-X 100, 5% albumin [015-27053; FUJIFILM Wako, Osaka, Japan]). Cells were immunostained with the first antibodies diluted in blocking buffer (rabbit anti-TOM20, 1:500; rabbit anti-COX4, 1:500; mouse anti-FLAG, 1:100; all the antibodies used are summarized in the Table S1) for 1 h at RT followed by second antibodies diluted in blocking buffer (Alexa Fluor 488-conjugated goat anti-mouse IgG, 1:2000; Alexa Fluor 568-conjugated goat anti-rabbit IgG, 1:2000). For STED microscopy, the secondary antibody STAR ORANGE-conjugated goat anti-Mouse IgG and STAR RED-conjugated goat anti-Rabbit IgG were diluted as 1:100 in blocking buffer. The confocal imagines were acquired by Zeiss LSM880-ELYRA PS. 1 with a 100× oil objective lens. The STED imaging was carried out by STEDYCON (Abberior Instruments) and SpinSR10 (Olympus). Images were processed with Image J.
Gene knockdown
Cells were transfected using Lipofectamine 3000 transfection reagent according to the manufacturer’s protocol. The following siRNAs were used in this study: human SFXN3 siRNAs (Invitrogen, s37839 and s37841); human PCBP2 siRNA (Invitrogen, s10099); a negative control siRNA (Invitrogen, #4390843). After 48 h transfection, cells were collected.
Immunoblot analysis
The cells were lysed with RIPA (25 mM Tris pH 7.4, 150 mM NaCl, 1% NP-40, 1% sodium deoxycholate, 0.1% SDS, 1 × PI). The protein concentration was measured with Protein Assay Bicinchoniate kit (06385-00 Nacalai Tesque). The proteins were separated and analyzed by SDS-PAGE with the specific antibodies listed in Table S1.
Measurement of intracellular catalytic Fe(II) and heme
To measure intracellular catalytic Fe(II) or heme, the following probes were used in this study: FerroOrange (Goryo Chemical, GC904-01) for cytoplasmic catalytic Fe(II); Mito-FerroGreen (Dojindo, M489) for mitochondrial catalytic Fe(II) [Citation17]; H-FluNox for free heme [Citation18]. K562 cells were transfected with siRNAs for 48 h and incubated with Fe(II)/heme probe(s) following the manufacture’s protocols. Cell images were obtained with BZ-X800 (Keyence, Osaka, Japan), and the fluorescence intensity was measured with by Gallios Flow Cytometer Beckman Coulter. MEF and HeLa cells were placed on poly-L-lysine-coated glass-bottomed dishes (D11531H, Matsunami, Osaka, Japan) and incubated overnight. Cells were treated with 20 µg/mL ferric ammonium citrate (FAC) for 6 h and stained with Mito-FerroGreen and 1 µg/mL Hoechst 33342 (H1399, Thermo Fischer Science) following the manufacture’s protocols. MEF cells were treated with 50 µg/mL FAC or 50 µg/mL FAC/5 µM SnMP (SnM321, Frontier Scientific, Newark, DE) for 12 h and stained with H-FluNox following the reported protocols [Citation18]. Images were randomly obtained on FV1000 (Fluoview FV1000, Olympus, Tokyo, Japan). Mean green fluorescence intensity of 50 cells from >5 different fields was quantified using Fiji.
Mitochondrial functional assay
Cellular respiration Assay were performed by Seahorse XFe24 Analyzer (Agilent Technologies) coupled with BioTek Cytation 5 and Keyence BZ-X800. K562 cells were transfected with siRNAs and incubated for 48 h. These cells were seeded (1 × 10⁶/well) on a Seahorse Xfe 24 plate coated with 10% CellMatrix Type I-C and incubated for 30 min at RT. The cellular oxygen consumption rates (OCR) and extracellular acidification rate (ECAR) were measured by Mito stress test kit (103015, Agilent Technologies) in a non-CO2 incubator by using 1.5 µM oligomycin, 1 µM carbonyl cyanide p-(trifluoromethoxy)phenylhydrazone (FCCP) and 0.5 µM rotenone/antimycin A (Rot/AA). The results were evaluated with GraphPad Prism 8.
Cell viability assay
To analyze ferroptosis induction, HeLa cells were treated with 0.25 µM RSL3 (Selleck, Houston, TX) for 0, 2, 4, and 6 h [Citation19]. Dead cells were analyzed by the trypan blue exclusion assay. The number of dead cells was determined by counting 50 cells from each of the two fields of view.
Isolation of mitochondria and proteinase K treatment
Mitochondrial fractions were freshly prepared from HeLa cells plated at 80–90% confluence according to a previously established method [Citation20]. In brief, HeLa cells were manually homogenized in mitochondria isolation buffer (0.2 M mannitol, 0.07 M sucrose, 0.01 M HEPES pH 7.5, 1 mM EDTA, PI) by 30 passages through a 25-gauge needle. A post-nuclear supernatant was obtained by centrifugation of the samples at 1,000 × g for 10 min at 4 °C. The heavy membrane fraction containing crude mitochondria was pelleted by centrifugation at 10,000 × g for 20 min and washed once in the same buffer. The isolated mitochondria were incubated in a 1, 2 and 5 μg/ml proteinase K solution (diluted in mitochondria isolation buffer) on ice for 15 min, and the digestion was stopped by the addition of 2 mM phenylmethylsulfonylfluoride (PMSF). Equal amount of sample was analyzed by immunoblotting using appropriate antibodies.
Retroviral infections and generation of stable cell lines
Appropriate pMXs plasmids were transfected into GP2-293 packaging cells (Takara, Kusatsu, Japan) using Lipofectamine 2000 (Thermo Fisher Scientific). After 48 h, retrovirus in the culture medium was collected and passed through a 0.45 μm filter. HeLa cells were infected with retrovirus in the presence of 10 μg/ml polybrene (Millipore, Burlington, MA) for 16 h. The infected cells were selected using 10 µg/mL blasticidin (InvivoGen, San Diego, CA).
Generation of CRISPR/Cas9-mediated KO MEF cell lines
For the generation of mitoferrin 1-KO or SFXN3-KO MEFs, HEK293T cells were co-transfected with lentiCRISPRv2 puro encoding sgRNAs targeting MFRN1 or SFXN3, psPAX2, and pMD2.G using Lipofectamine 2000 (Thermo Fisher Scientific). The culture medium was collected 48 h after transfection and passed through a 0.45 μm filter. MEFs were transduced with lentivirus in the presence of 10 μg/ml polybrene for 16 h. The infected cells were selected with puromycin (InvivoGen), and bulk cells were used for the experiments.
Proximity ligation assay (PLA)
PLA was performed using Duolink In Situ-Fluorescence (DUO92101, Sigma–Aldrich) according to the manufacture’s protocol. Briefly, HeLa cells cultured on glass coverslips were incubated with 200 nM MitoTracker Deep Red (Thermo Fisher Scientific, M22426) for 30 min at 37 °C. Then, the cells were fixed with 3.7% PFA/PBS at RT for 20 min and permeabilized with 0.1% Triton-X 100/PBS for 5 min. The fixed cells were co-incubated with mixed antibodies derived from mouse or rabbit in diluent at RT for 2 h, followed by incubation with PLA probes (anti-Mouse PLUS and anti-Rabbit MINUS) at 37 °C for 1 h. After ligation and amplification using Detection Reagents GREEN, the cells were washed with Wash Buffer B, and then mounted with Duolink In Situ Mounting Medium with DAPI. Fluorescence images for PLA were randomly obtained on FV1000.
Hemoglobin assay
K562 cells were seeded in a 6-well plate, followed by treatment with siRNA. On the day 4, the cells were harvested and washed with PBS. Then the cells were lysed by 60-μl RIPA (25 mM Tris PH 7.4, 150 mM NaCl, 1% NP-40, 1% sodium deoxycholate, 0.1% SDS) and sonication. The supernatant was collected after centrifugation (21,600 × g, 10 min, 4 °C). The 50-μl cell lysates were used to measure the concentration of hemoglobin by using the Sigma hemoglobin assay kit (MAK115, Sigma) following the manufacturer’s protocol, and the 5-μl cell lysates were used to measure protein concentration by Protein Assay Bicinchoniate kit (06385-00 Nacalai Tesque) for normalization.
Transferrin (Tf)-uptake assay
MEF cells were plated on glass coverslips and incubated overnight. Cells were washed with pre-warmed PBS twice and incubated with 20 µg/mL of Alexa568-conjugated-Transferrin (T23365, Thermo Fischer Science) in serum-free DMEM at 37 °C for 5 or 20 min. Following incubation, cells were rinsed with ice-cold PBS, fixed with 3.7% PFA/PBS, rinsed with PBS, and mounted on coverslips using mounting medium (ProLong Diamond Antifade Mountant with DAPI, P36962, Thermo Fisher Scientific). Nine images were obtained by FV1000 microscope. Mean red fluorescence intensity of 50 cells from 9 different fields was quantified using Fiji.
Co-immunoprecipitation assay
Mitochondrial fractions were freshly prepared as described above from HeLa cells stably expressing FLAG or FLAG-SFXN3 and lysed in co-IP buffer (50 mM Tris pH8.0, 150 mM NaCl, 1% Triton X-100, 1 mM DTT, PI). Each 300 µg lysate was co-immunoprecipitated with anti-FLAG mAb-conjugated protein G beads, washed extensively with the lysis buffer and then analyzed by immunoblot using the appropriate antibodies via standard methods.
Statistical analysis
All the statistical analyses were carried out by Graph Pad Prism 8. Results were presented as means ± SD of at least three independent experiments. The significance was determined by unpaired two-tailed/one-sample t-test, and the results were considered statistically significant when p < .05.
Results
Cytosolic iron chaperone PCBP2 interacts with SFXN3 through TOM20/70
We used human chronic myelogenous leukemia KU812 cells for the screening of novel iron receptor for PCBP2 in mitochondria because KU812 cells require a high amount of iron to produce hemoglobin. Mitochondrial proteins of 234 distinct identifies to interact with PCBP2 were identified with LC–MS (, Table S2), which included many enzymes for TCA cycle, electron transfer chain or fatty acid synthesis used inside mitochondria. Final nine candidates are summarized in . SFXN family was originally identified as the sideroblastic anemia-associated protein family that was discovered in metazoans which comprises five groups of paralogous proteins present in mitochondria [Citation21,Citation22]. We omitted SFXN1 because it is identified as mitochondrial serine transporter [Citation23] and omitted SFXN4 because its knockdown influences iron metabolism via the cytosolic aconitase-IRP1 switch to redistribute iron from the cytosol to mitochondria, the opposite to our target molecule [Citation24]. The other three was omitted due to the low score, and thus TOM20, SFXN3 and TOM70 remained as candidates.
Figure 1. Screening of PCBP2-interacting proteins with mitochondrial lysates of KU812 leukemia cells with erythroid differentiation identifies SFXN3 and TOM20. (A) Silver staining after SDS-PAGE for LC-MS/MS identification of PCBP2-interacting mitochondrial proteins in KU812 cells. Arrow heads indicate specific bands detected in GST-PCBP2/mitochondrial lysate mixtures. Refer to text, and Table S2 for the identified proteins. (B) Mitochondrial fractions of HeLa cells were digested with 1, 2, 5 µg/mL Proteinase K. Proteins were detected by immunoblotting with mouse anti-PCBP2 mAb, rabbit anti-SFXN3 pAb, rabbit anti-TOM20 pAb and rabbit anti-COX4 pAb. (C-L) FLAG-SFXN3 expressing HeLa cells were co-stained with mouse anti-FLAG mAb/rabbit anti-COX4 pAb (C, D, E), mouse anti-FLAG mAb/rabbit anti-TOM20 pAb (F, G), mouse anti-FLAG mAb/mouse anti-PCBP2 mAb (H, I, J) and mouse anti-TOM70/mouse anti-PCBP2 mAb (K, L). Dashed lines in D, F, I and K show the analyzed plots of the fluorescence intensity profiles in E, G, J and L, respectively. Scale bars in C and H, 10 µm; scale bars in D, F, I and K, 1 µm.
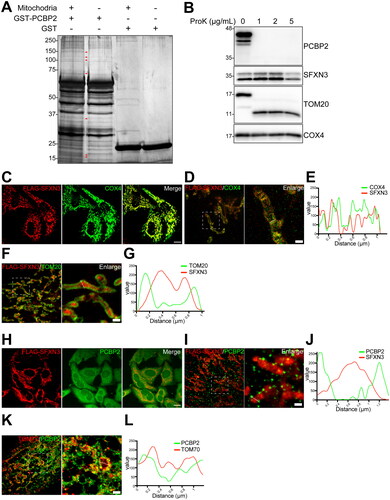
Table 1. Final nine candidates as a mitochondrial receptor for cytosolic PCBP2.
SFXN3 is located at the inner mitochondrial membrane and TOM20 at the outer membrane whereas PCBP2 is located outside of mitochondria
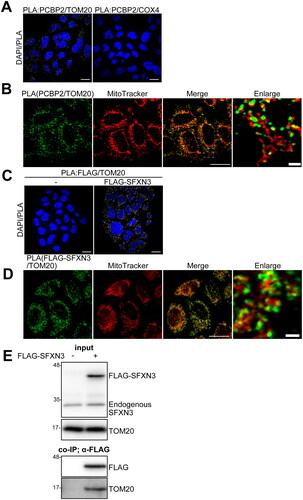
Since the mitochondria are bilayer organelles, cytoplasmic iron needs to pass through the outer and inner membranes before it is released into the matrix for use. We first performed partial digestion of mitochondria with proteinase K to remove mitochondrial outer surface proteins, where PCBP2 was completely digested, TOM20 was partially digested and SFXN3 and COX4 were not digested at all (). Then, we applied stimulated emission depletion (STED) microscopy to locate SFXN3, TOM20 and PCBP2. HeLa cells expressing FLAG-SFXN3 were used, and COX4 was employed as a standard mitochondrial matrix protein. The localization of COX4 and SFXN3 merged efficiently, suggesting that SFXN3 is located at the inner membrane (). Colocalization of TOM20 and SFXN3 was only at the mitochondrial outer membrane, confirming that TOM20 is localized at the outer membrane and intermembrane space (). PCBP2 and SFXN3 did not colocalize, suggesting that PCBP2 is outside of the mitochondria (). Colocalization of PCBP2 and TOM70 was only at the mitochondrial outer surface, confirming that TOM70 is protruded from the mitochondrial outer membrane (). Furthermore, PLA analyses demonstrated that both the combinations of PCBP2/TOM20 and SFXN3/TOM20 are at least partially colocalized ().
Figure 2. Analysis of molecular interactions of PCBP2 and mitochondrial molecules. (A) Molecular interaction between PCBP2/TOM20 (left) or PCBP2/COX4 (right) was analyzed by PLA in HeLa cells. (B) Hela cells were stained with MitoTracker and PCBP2/TOM20 interaction was analyzed by PLA. (C) Molecular interaction between FLAG-SFXN3/TOM20 was analyzed by PLA in FLAG (empty vector) (left) or in FLAG-SFXN3 stably expressing HeLa cells (right). (D) FLAG-SFXN3 stably expressing HeLa cells were stained with MitoTracker and PCBP2/TOM20 interaction was analyzed by PLA. Scale bars in A, B, C (Merge) and D (Merge), 10 µm; scale bars in B (Enlarge) and D (Enlarge), 1 µm. PLA, proximity ligation assay. (E) Molecular interaction between FLAG-SFXN3/TOM20 was analyzed by co-immunoprecipitation assay. Crude mitochondrial fractions were obtained from FLAG (empty vector) (left) or FLAG-SFXN3 stably expressing HeLa cells. Protein (5 μg) from mitochodrial lysates was applied to the gel and analyzed by immunoblotting using anti-SFXN3 pAb or anti-TOM20 mAb (input). Protein (300 μg) from each lysate of FLAG, or FLAG-SFXN3 was co-immunoprecipitated with anti-FLAG mAb-conjugated protein G beads and analyzed by immunoblotting using an anti-FLAG mAb or anti-TOM20 mAb.
Association of SFXN3 with TOM20 but not with PCBP2 is direct
To test whether the SFXN3 binds PCBP2 directly, we performed a binding assay with GST-PCBP2 and FLAG-SFXN3, which revealed no direct binding (data not shown). In contrast, there was a direct binding between FLAG-SFXN3 and TOM20 ().
Knockdown of SFXN3 and/or PCBP2 in K562 cells decreases cytoplasmic and mitochondrial catalytic Fe(II), and mitochondrial maximal respiration
Short interfering RNA knockdown of SFXN3 and/or PCBP2 was used to evaluate the effects on catalytic Fe(II) and mitochondrial respiratory function in K562 chronic leukemia cells. Both siSFXN3 and siPCBP2 significantly decreased cytoplasmic and mitochondrial catalytic Fe(II), confirming that this is a novel iron entry pathway to mitochondria (). However, the experimental condition of siPCBP2 only was the most effective, which suggested that mitochondrial iron deficiency initiates a feedback mechanism to redistribute iron. Regarding mitochondrial respiration, only maximal respiration was impaired in the case of SFXN3 and/or PCBP2 knockdown whereas basal respiration and ATP production were not affected, suggesting the association of impaired mitochondrial respiration with decreased mitochondrial Fe(II) ().
Figure 3. SFXN3 and/or PCBP2 knockdown decreases intracellular and mitochondrial catalytic Fe(II) and mitochondrial maximum respiration in K562 leukemia cells. (A) K562 cells were transfected with negative control siRNA, SFXN3 siRNAs and/or PCBP2 siRNA, and the effects were evaluated after 48 h with immunoblot analysis. (B–E) Intracellular catalytic Fe(II) (B), mitochondrial catalytic Fe(II) (C), free heme (D), and hemoglobin (E) were measured by FerroOrange, Mito-FeroGreen, H-FluNox and hemoglobin assay kit, respectively. Each data was normalized by control condition. Error bars represent SD from three independent experiments. (means ± SD; n.s., not significant; *, p < .05; **, p < .01; ***, p < .001; ****, p < .0001). (F, G) Mitochondrial respiration assay was performed in K562 cells depleted SFXN3 and/or PCBP2 by Seahorse XFe24 Analyzer. Error bars represent SD from six independent experiments. (means ± SD; **, p < .01).
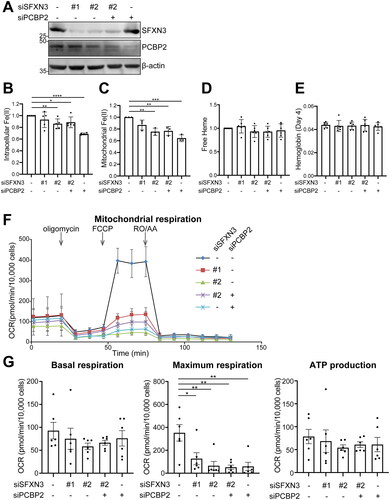
Knockdown of SFXN3 does not alter free heme and hemoglobin in K562 cells
siSFXN3 in the present experimental protocol changed neither the amounts of cytoplasmic and mitochondrial free heme nor the amounts of hemoglobin in K562 cells (), which are presumably due to the long half-life of these molecules.
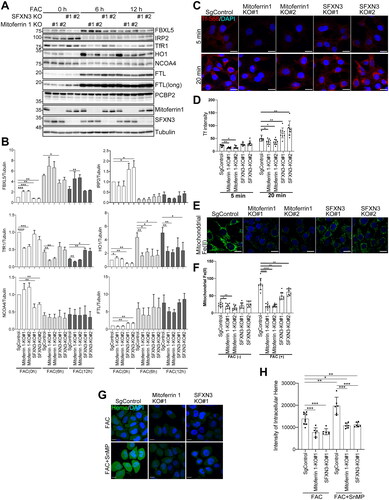
Knockout of SFXN3 and MFRN1 in MEF cells elicits distinct alterations in iron metabolism
Mitoferrin-1, localized in mitochondrial inner membrane, is an established mitochondrial iron importer. We have produced knockout MEF cells of SFXN3 and MFRN1 to compare iron metabolism under a permanent steady condition in non-erythropoietic cells. Prior to iron loading, FBXL5 ([2Fe-2S] protein) expression was lower and IRP2/FTL was higher in SFXN3 KO cells than in MFRN1 KO cells, suggesting that mitochondrial iron entry pathways through SFXN3 and MFRN1 are distinct with more dependence on SFXN3 (). TfR1 expression was always higher in SFXN3 KO cells than in MFRN1 KO cells. HO1 expression was lower prior to iron loading in SFXN3 KO cells in comparison to MFRN1 KO cells, suggesting the efficient blockade of mitochondrial iron entry especially for heme synthesis. Furthermore, HO1 expression was lower at 12 h in MFRN1 KO cells after iron overload (), suggesting a major role of SFXN3 in iron entry to mitochondria, considering that an increase in HO1 expression may result from cytosolic iron-induced stress [Citation25]. This was confirmed by the transferrin uptake study that transferrin uptake is significantly higher in SFXN3 KO cells than in MFRN1 KO cells under normal medium (). Of note, both MFRN1 and SFXN3 contributed to the maintenance of mitochondrial Fe(II). This was clearer under iron overload by FAC and the blockade of iron entry to mitochondria was more complete in MFRN1 KO cells than in SFXN3 KO cells (). Furthermore, this iron entry to mitochondria was proportionally associated with the amounts of intracellular heme (). Intracellular heme was significantly increased in the presence of a heme oxygenase inhibitor, SnMP.
Figure 4. Knockout study in MEF cells reveals that iron entry to mitochondria by SFXN3 is distinct from the role of MFRN1. (A) SgControl-MEF, MFRN1 KO-MEF, and SFXN3-KO-MEF were treated with 20 µg/mL FAC for 0, 6 and 12 h and protein expression was analyzed by immunoblotting. FTL (long) indicates a longer exposed version of FTL. (B) Quantitative analysis of the data shown in (A). p values were generated using a one-sample t-test. Error bars represent SD from three independent experiments. (means ± SD; *p < .05; **p < .01; ***p < .001; ****p < .0001). (C) MEF cells were treated with 20 µg/mL Alexa568 conjugated holo-Tf in DMEM w/o FBS for the indicated time. Cells were washed with cold PBS and fixed with 4% PFA/PBS. At least five images were obtained by FV1000 microscopy. (D) Quantitation of data shown in (C). Error bars represent SD from three independent experiments. (means ± SD; *p < .05; **p < .01). (E) Cells were treated with 20 µg/mL FAC for 0, 6 h and mitochondrial Fe(II) was measured by Mito-FerroGreen. Representative images from 6 h-FAC treatment were shown in E. (F) Quantitation of data shown in (E). Error bars represent SD from three independent experiments. (means ± SD; *p < .05; **p < .01; ****p < .0001). MEF, mouse embryonic fibroblast; FAC, ferric ammonium citrate. (G) MEF cells were treated with 50 µg/mL FAC or 50 µg/mL FAC/5 µM SnMP for 12 h and heme was measured with heme probe. (H) Quantitation of data shown in (G). Mean green fluorescence intensity of fifty cells from >5 different fields was quantified using Fiji. (means ± SD; *p < 005; **p < .01; ***p < .001).
SFXN3 overexpression overcomes iron excess to load Fe(II) to mitochondria
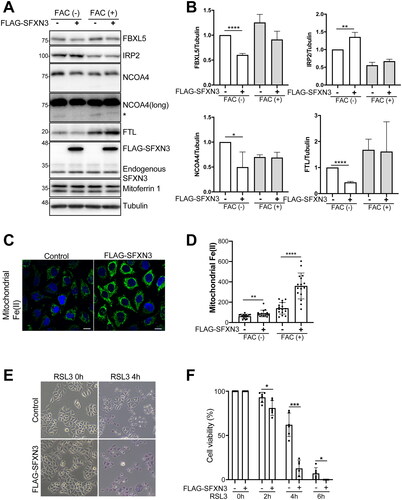
We then studied the effect of SFXN3 overexpression on mitochondrial iron entry in HeLa cells. Prior to iron overload, SFXN3 overexpression caused downregulation of FTL () in contrast to the upregulation in its KO cells (), suggesting the transfer of cytosolic Fe(II) to mitochondria. SFXN3 overexpression under iron overload promoted Fe(II) accumulation in mitochondria with higher ferritin expression and less NCOA4 degradation (), indicating that SFXN3 is a distinct iron entry route to mitochondria.
Figure 5. SFXN3 overexpression overcomes iron excess to load Fe(II) to mitochondria but induces ferroptosis sensitivity by RSL3. (A) HeLa or FLAG-SFXN3 stably expressing HeLa cells were treated with 20 µg/mL FAC for 0 or 6 h and protein expression was analyzed by immunoblotting. (B) Quantitative analysis of the data shown in (A). p values were generated using a one-sample t-test. Error bars represent SD from three independent experiments. (means ± SD; *p < .05; **p < .01; ****p < .0001). (C) FLAG-SFXN3 stably expressing HeLa cells were treated with 20 µg/mL FAC for 0, 6 h and mitochondrial Fe(II) was measured by Mito-FerroGreen. Representative images from 6 h-FAC treatment were shown in A. (D) Quantitation of data shown in (C). Error bars represent SD from three independent experiments. (means ± SD; **p < .01; ****p < .0001). (E) Cells were treated with 0.25 µM RSL3 for 0, 2, 4 or 6 h. Dead cells were stained with trypan blue. Representative images from 0 and 4 h-RSL3 treatment were shown in C. (F) Quantitation of data shown in C. Error bars represent SD from three independent experiments. (means ± SD; *p < .05; ***p < .001).
SFXN3 overexpression sensitizes ferroptosis by RSL3
Considering the complex function of mitochondria in ferroptosis [Citation26], we finally evaluated the role of SFXN3 in a classical model of ferroptosis by RSL3. SFXN3 overexpression sensitized Hela cells to ferroptosis induced by 0.25 µM RSL3 ().
Discussion
We started the present study, based on a hypothesis that there should be receptors for PCBP2, a major cytosolic Fe(II) chaperone [Citation12], on the mitochondrial surface. Here we identified a novel iron entry mechanism through TOM20 and SFXN3 to mitochondrial matrix, where Fe-S cluster and heme are synthesized. This was confirmed by knockdown or knockout experiments by evaluating mitochondrial catalytic Fe(II) and function.
We have chosen KU812 chronic myeloid leukemia cells for screening because they produce hemoglobin. This global screening strategy of PCBP2-interacting protein out of mitochondrial lysates sorted out TOM20, SFXN3, SFXN1 and TOM70 in the affinity-score sequence. We omitted SFXN1 because it is identified as mitochondrial serine transporter, required for one-carbon metabolism [Citation23], and SFXN1 loss provides a proliferative advantage under cystine depletion [Citation27]. Because TOM20 revealed 3-times higher score than TOM70, we decided to focus on TOM20 whereas TOM proteins often make a complex [Citation28]. Indeed, acquisition of SFXN3 was unexpected. Therefore, we first confirmed the mitochondrial localization of both the proteins with STED microscopy, which clearly showed that TOM20 is located at the outer membrane and SFXN3 at the inner membrane. We also observed a decrease in intracellular and mitochondrial Fe(II) by knockdown of SFXN3 and/or PCBP2 along with deterioration of mitochondrial function in K562 leukemia cells. Of note, PCBP2 did not bind to SFXN3 directly but appears to bind indirectly with SFXN3 in the presence of TOM20.
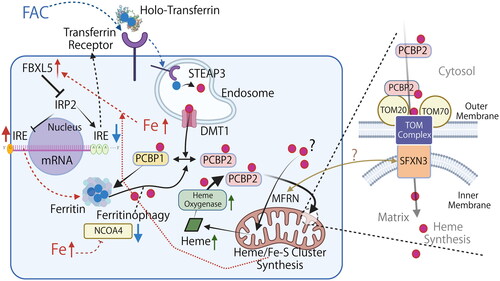
We are currently trying to understand the gap as follows (). TOM20 or its complex with other proteins are the receptor of PCBP2, and Fe(II) is transferred through PCBP2-TOM20-SFXN3 complex to mitochondrial matrix, where the pH is 7.7–8.2 [Citation29]. Weakly acidic pH 6.9 of the mitochondrial intermembrane space [Citation30] may help diffuse Fe(II) to be more soluble and finally contributing to the mitochondrial functions. We demonstrated the direct binding between TOM20 and SFXN3 (). Of note, knockout of SFXN3 but not of MFRN1 decreased FBXL5 (i.e. increased sensitivity to iron deficiency) [Citation31] and increased transferrin uptake, indicating that mitochondrial iron entry by SFXN3 is unique. Therefore, we believe that iron entry pathway to mitochondria via SFXN3 is essential for mitochondrial functions, including heme/Fe-S cluster synthesis.
Figure 6. Working model of cytosolic Fe(II) delivery to mitochondria via iron chaperone in the context of iron overload. Graphical representation of the working model in which cytosolic PCBP2 delivers Fe(II) to mitochondria. PCBP2 binds to TOM20 on the mitochondrial outer membrane and delivers Fe(II). SFXN3 is localized on the mitochondrial inner membrane and interacts with the TOM complex to transport Fe(II) into the matrix. Filled red circle, Fe(II); filled blue circle, Fe(III); DMT1, divalent metal transporter 1 (also as SLC11A2); FAC, Fe(III) ammonium citrate; FBXL5, F-box/LRR-repeat protein 5; FTL, ferritin light chain; IRE, iron-responsive element; IRP2, iron regulatory protein 2; NCOA4, nuclear receptor coactivator 4; STEAP3, six-transmembrane epithelial antigen of prostate 3. Note that only major pathways associated with this study is described and the diagram is simplified. Time course is also important for each reaction/signaling. The association of MFRN and SFXN3 is unelucidated. Refer to text for details.
Sideroflexin was named by Fleming et al. based on the fact that the phenotype of sideroblastic anemia (iron deposition in mitochondria of erythroid cells) and flexed tail is responsible from Sfxn1 mutation in mouse [Citation21]. Mouse Sfxn3 knockout (Sfxn3tm1b(KOMP)Wtsi) causes increased circulating insulin in both sexes but low serum iron level only in males (https://www.mousephenotype.org/). SFXN3 is an α-synuclein-dependent mitochondrial protein regulating synaptic morphology [Citation32], is a regulator of metastatic colonization of B16-F10 melanoma cells [Citation33,Citation34] and is associated with hearing loss [Citation35], mouse brain morphogenesis [Citation36] and neurodegeneration pathway in vivo [Citation37]. The human protein atlas (https://www.proteinatlas.org/) reveals that SFXN3 expression is almost ubiquitous (low tissue specificity) and is a poor prognostic factor for head and neck cancer and renal cancer. All of these suggest and are consistent with the association of SFXN3 with mitochondrial iron metabolism. Notably, SFXN3 overexpression sensitized a cancer cell line, HeLa, to ferroptosis [Citation19,Citation38] induced by RSL3, which is consistent with the association of ferroptosis and mitochondrial damage [Citation39]. SFXN3 can be a novel target for cancer drug discovery to induce ferroptosis [Citation40]. Further study is necessary to understand more precise mechanism.
Furthermore, our findings may open up an unexplored pathway of iron metabolism. SFXN3 KO and overexpression in MEF cells revealed an intriguing association between both the statuses and FTL expression concomitant with the alteration of IRE/IRP system. Namely, KO caused FTL upregulation with increased IRP2 leading to a higher sensitivity for iron deficiency () whereas overexpression caused FTL downregulation (). Accordingly, there may be other molecular mechanisms than IRP/IRE system to regulate cytoplasmic and mitochondrial iron, especially for heme synthesis.
In conclusion, we for the first time discovered a mechanism of mitochondrial iron entry via PCBP2-TOM20-SFXN3 axis. There are limitations and questions remaining. We have used only leukemia cells, HeLa cells and MEF cells in the present study, so different kinds of cells have to be evaluated. There is some ambiguity remaining regarding the complex formation and the sequential que among PCBP2, TOM 20 and SFXN3, which may require the other proteins. We now believe that there are two distinct pathways of iron entry to mitochondria from cytosol, namely MFRN1/2 [10] and PCBP2-TOM20-SFXN3. What kind of Fe(II) form, such as chelated or chaperoned at ∼ pH 7.4, is specific for each pathway and for mitochondrial function needs further investigation with the analyses of genetically engineered animals on Sfxn3 and Mfrn1/2 and of fine molecular structures.
Author contributions
DM, IY and ST conceived, wrote and organized the manuscript, prepared the figures and tables. DM, IY, HZ and YK obtained the experimental data. TH supplied the fluorescent probe for heme. DM, IY and ST contributed to the discussion.
| Abbreviations | ||
| BSA | = | bovine serum albumin |
| COX4 | = | cytochrome c oxidase subunit 4, mitochondrial |
| DMT1 | = | divalent metal transporter 1 (also as SLC11A2) |
| ECAR | = | extracellular acidification rate |
| FBS | = | fetal bovine serum |
| FBXL5 | = | F-box/LRR-repeat protein 5 |
| GST | = | glutathione S-transferase |
| HCD | = | higher energy collisional dissociation |
| IPTG | = | isopropyl β-D-1-thiogalactopyranoside |
| IRE | = | iron-responsive element |
| IRP2 | = | iron regulatory protein 2 |
| LC-MS | = | liquid chromatography-mass spectrometry |
| MEFs | = | mouse embryonic fibroblasts |
| MFRN(s) | = | mitoferrin(s) |
| NCOA4 | = | nuclear receptor coactivator 4 |
| OCR | = | oxygen consumption rates |
| PBS | = | phosphate-buffered saline |
| PCBP-2 | = | poly(rC)-binding protein-2 |
| PFA | = | paraformaldehyde |
| PI | = | protease inhibitor |
| PLA | = | proximity ligation assay |
| PMSF | = | phenylmethylsulfonylfluoride |
| RIPA | = | radioimmunoprecipitation assay |
| ROS | = | reactive oxygen species |
| RT | = | room temperature |
| SDS-PAGE | = | sodium dodecyl sulfate polyacrylamide gel electrophoresis |
| SFXN(s) | = | sideroflexin(s) |
| STEAP3 | = | six-transmembrane epithelial antigen of prostate 3 |
| STED | = | stimulated emission depletion |
| Tf | = | transferrin |
| TOM | = | translocase of the outer membrane |
Supplemental Material
Download PDF (127.8 KB)Acknowledgments
The author (YK) would like to take this opportunity to thank the “Interdisciplinary Frontier Next-Generation Researcher Program of the 10 Tokai Higher Education and Research System.” The authors thank Division for Medical Research Engineering, Nagoya University Graduate School of Medicine for technical assistance. BioRender was used for .
Disclosure statement
No potential conflict of interest was reported by the author(s).
Additional information
Funding
References
- Toyokuni S, Kong Y, Zheng H, et al. Iron as spirit of life to share under monopoly. J Clin Biochem Nutr. 2022;71(2):78–88. doi: 10.3164/jcbn.22-43.
- Toyokuni S, Zheng H, Kong Y, et al. Low-temperature plasma as magic wand to differentiate between the good and the evil. Free Radic Res. 2023;57(1):38–46. doi: 10.1080/10715762.2023.2190860.
- Toyokuni S, Yanatori I, Kong Y, et al. Ferroptosis at the crossroads of infection, aging and cancer. Cancer Sci. 2020;111(8):2665–2671. doi: 10.1111/cas.14496.
- Hsieh WP, Deschamps F, Okuchi T, et al. Effects of iron on the lattice thermal conductivity of earth’s deep mantle and implications for mantle dynamics. Proc Natl Acad Sci U S A. 2018;115(16):4099–4104. doi: 10.1073/pnas.1718557115.
- Koppenol WH, Hider RH. Iron and redox cycling. Do’s and don’ts. Free Radic Biol Med. 2019;133:3–10. doi: 10.1016/j.freeradbiomed.2018.09.022.
- Yanatori I, Kishi F. DMT1 and iron transport. Free Radic Biol Med. 2019;133:55–63. doi: 10.1016/j.freeradbiomed.2018.07.020.
- Donegan RK, Moore CM, Hanna DA, et al. Handling heme: the mechanisms underlying the movement of heme within and between cells. Free Radic Biol Med. 2018;133:88–100. doi: 10.1016/j.freeradbiomed.2018.08.005.
- Toyokuni S, Kong Y, Cheng Z, et al. Carcinogenesis as side effects of iron and oxygen utilization: from the unveiled truth toward ultimate bioengineering. Cancers (Basel). 2020;12(11):3320. doi: 10.3390/cancers12113320.
- Koleini N, Shapiro JS, Geier J, et al. Ironing out mechanisms of iron homeostasis and disorders of iron deficiency. J Clin Invest. 2021;131(11):e148671. doi: 10.1172/JCI148671.
- Ali MY, Oliva CR, Flor S, et al. Mitoferrin, cellular and mitochondrial iron homeostasis. Cells. 2022;11(21):3464. doi: 10.3390/cells11213464.
- Seguin A, Jia X, Earl AM, et al. The mitochondrial metal transporters mitoferrin1 and mitoferrin2 are required for liver regeneration and cell proliferation in mice. J Biol Chem. 2020;295(32):11002–11020. doi: 10.1074/jbc.RA120.013229.
- Yanatori I, Richardson DR, Toyokuni S, et al. The new role of poly (rC)-binding proteins as iron transport chaperones: proteins that could couple with inter-organelle interactions to safely traffic iron. Biochim Biophys Acta Gen Subj. 2020;1864(11):129685. doi: 10.1016/j.bbagen.2020.129685.
- Yanatori I, Yasui Y, Tabuchi M, et al. Chaperone protein involved in transmembrane transport of iron. Biochem J. 2014;462(1):25–37. doi: 10.1042/BJ20140225.
- Yanatori I, Richardson DR, Toyokuni S, et al. The iron chaperone poly(rC)-binding protein 2 forms a metabolon with the heme oxygenase 1/cytochrome P450 reductase complex for heme catabolism and iron transfer. J Biol Chem. 2017;292(32):13205–13229. doi: 10.1074/jbc.M117.776021.
- Yanatori I, Richardson DR, Imada K, et al. Iron export through the transporter ferroportin 1 is modulated by the iron chaperone PCBP2. J Biol Chem. 2016;291(33):17303–17318. doi: 10.1074/jbc.M116.721936.
- Clayton DA, Shadel GS. Isolation of mitochondria from tissue culture cells. Cold Spring Harb Protoc. 2014;2014(10):pdb prot080002. doi: 10.1101/pdb.prot080002.
- Hirayama T. Fluorescent probes for the detection of catalytic Fe(II) ion. Free Radic Biol Med. 2019;133:38–45. doi: 10.1016/j.freeradbiomed.2018.07.004.
- Kawai K, Hirayama T, Imai H, et al. Molecular imaging of labile heme in living cells using a small molecule fluorescent probe. J Am Chem Soc. 2022;144(9):3793–3803. doi: 10.1021/jacs.1c08485.
- Stockwell BR, Friedmann Angeli JP, Bayir H, et al. Ferroptosis: a regulated cell death nexus linking metabolism, redox biology, and disease. Cell. 2017;171(2):273–285. doi: 10.1016/j.cell.2017.09.021.
- Liao PC, Bergamini C, Fato R, et al. Isolation of mitochondria from cells and tissues. Methods Cell Biol. 2020;155:3–31. doi: 10.1016/bs.mcb.2019.10.002.
- Fleming MD, Campagna DR, Haslett JN, et al. A mutation in a mitochondrial transmembrane protein is responsible for the pleiotropic hematological and skeletal phenotype of flexed-tail (f/f) mice. Genes Dev. 2001;15(6):652–657. doi: 10.1101/gad.873001.
- Miotto G, Tessaro S, Rotta GA, et al. In silico analyses of Fsf1 sequences, a new group of fungal proteins orthologous to the metazoan sideroblastic anemia-related sideroflexin family. Fungal Genet Biol. 2007;44(8):740–753. doi: 10.1016/j.fgb.2006.12.004.
- Kory N, Wyant GA, Prakash G, et al. SFXN1 is a mitochondrial serine transporter required for one-carbon metabolism. Science. 2018;362(6416):eaat9528. doi: 10.1126/science.aat9528.
- Paul BT, Tesfay L, Winkler CR, et al. Sideroflexin 4 affects Fe-S cluster biogenesis, iron metabolism, mitochondrial respiration and heme biosynthetic enzymes. Sci Rep. 2019;9(1):19634. doi: 10.1038/s41598-019-55907-z.
- Vile GF, Basu-Modak S, Waltner C, et al. Heme oxygenase 1 mediates an adaptive response to oxidative stress in human skin fibroblasts. Proc Natl Acad Sci U S A. 1994;91(7):2607–2610. doi: 10.1073/pnas.91.7.2607.
- Gan B. Mitochondrial regulation of ferroptosis. J Cell Biol. 2021;220(9):e202105043. doi: 10.1083/jcb.202105043.
- Soula M, Weber RA, Zilka O, et al. Metabolic determinants of cancer cell sensitivity to canonical ferroptosis inducers. Nat Chem Biol. 2020;16(12):1351–1360. doi: 10.1038/s41589-020-0613-y.
- Busch JD, Fielden LF, Pfanner N, et al. Mitochondrial protein transport: versatility of translocases and mechanisms. Mol Cell. 2023;83(6):890–910. doi: 10.1016/j.molcel.2023.02.020.
- Akhmedov D, Braun M, Mataki C, et al. Mitochondrial matrix pH controls oxidative phosphorylation and metabolism-secretion coupling in INS-1E clonal beta cells. Faseb J. 2010;24(11):4613–4626. doi: 10.1096/fj.10-162222.
- Porcelli AM, Ghelli A, Zanna C, et al. pH difference across the outer mitochondrial membrane measured with a green fluorescent protein mutant. Biochem Biophys Res Commun. 2005;326(4):799–804. doi: 10.1016/j.bbrc.2004.11.105.
- Moroishi T, Nishiyama M, Takeda Y, et al. The FBXL5-IRP2 axis is integral to control of iron metabolism in vivo. Cell Metab. 2011;14(3):339–351. doi: 10.1016/j.cmet.2011.07.011.
- Amorim IS, Graham LC, Carter RN, et al. Sideroflexin 3 is an alpha-synuclein-dependent mitochondrial protein that regulates synaptic morphology. J Cell Sci. 2017;130(2):325–331.
- van der Weyden L, Karp NA, Swiatkowska A, et al. Genome wide in vivo mouse screen data from studies to assess host regulation of metastatic colonisation. Sci Data. 2017;4(1):170129. doi: 10.1038/sdata.2017.129.
- van der Weyden L, Swiatkowska A, Iyer V, et al. A genome-wide screen in mice to identify cell-extrinsic regulators of pulmonary metastatic colonisation. G3 (Bethesda). 2020;10(6):1869–1877. doi: 10.1534/g3.120.401128.
- Ingham NJ, Pearson SA, Vancollie VE, et al. Mouse screen reveals multiple new genes underlying mouse and human hearing loss. PLoS Biol. 2019;17(4):e3000194. doi: 10.1371/journal.pbio.3000194.
- Collins SC, Mikhaleva A, Vrcelj K, et al. Large-scale neuroanatomical study uncovers 198 gene associations in mouse brain morphogenesis. Nat Commun. 2019;10(1):3465. doi: 10.1038/s41467-019-11431-2.
- Ledahawsky LM, Terzenidou ME, Edwards R, et al. The mitochondrial protein sideroflexin 3 (SFXN3) influences neurodegeneration pathways in vivo. Febs J. 2022;289(13):3894–3914. doi: 10.1111/febs.16377.
- Toyokuni S, Kong Y, Zheng H, et al. Three-dimensional regulation of ferroptosis at the intersection of iron, sulfur, and oxygen executing scrap and build toward evolution. Antioxid Redox Signal. 2023;39(10–12):807–815. doi: 10.1089/ars.2022.0142.
- Kong Y, Akatsuka S, Motooka Y, et al. BRCA1 haploinsufficiency promotes chromosomal amplification under fenton reaction-based carcinogenesis through ferroptosis-resistance. Redox Biol. 2022;54:102356. doi: 10.1016/j.redox.2022.102356.
- Motooka Y, Toyokuni S. Ferroptosis as ultimate target of cancer therapy. Antioxid Redox Signal. 2023;39(1-3):206–223. doi: 10.1089/ars.2022.0048.