
 ?Mathematical formulae have been encoded as MathML and are displayed in this HTML version using MathJax in order to improve their display. Uncheck the box to turn MathJax off. This feature requires Javascript. Click on a formula to zoom.
Abstract
Glaucoma is the second cause of blindness worldwide. Frequent administration of traditional topical dosage forms may lead to patient incompliance and failure of treatment. Our study aims to formulate proniosomal gel formulations that sustain the release of the water-soluble anti-glaucoma drug Dorzolamide-HCl (Dorz). Proniosomal gel formulations were prepared using coacervation phase separation method according to a 52 full factorial design. The effects of Cholesterol and surfactant (Span 40) amounts (independent variables) on the percentage entrapment efficiency (EE%), particle size (PS), and the percent of drug released after 8 h (Q8h) (dependent variables (DVs)) were investigated. An optimized formulation (OF) was chosen based on maximizing EE% and Q8h and minimizing PS. An intraocular pressure (IOP) pharmacodynamic study was performed in rabbits to evaluate the in-vivo performance of the OF-gel compared to the marketed Trusopt® eye drops. The results showed that the independent variables studied significantly affected EE%, PS, and Q8h. OF was the one containing 60 mg Cholesterol and 540 mg Span 40. It had desirability of 0.885 and its actually measured DVs deviated from the predicted ones by a maximum of 4.8%. The in-vivo pharmacodynamic study showed that OF could result in higher reduction in IOP, significantly sustain that reduction in IOP and increase Dorz bioavailability compared to Trusopt® eye drops. Thus the OF-gel is very promising for being used in glaucoma treatment.
Introduction
The eye is a small complex multi-compartmental organ with special anatomy, physiology, and biochemistry. Its nature and protective barriers make ocular drug delivery to its site of action, in sufficient amounts, a true challenge.
Although systemic administration of ocular drugs has the advantage of convenient administration yet it suffers from the disadvantage of systemic side effects and poor bioavailability (Janoria et al., Citation2007). Topical administration of ocular drugs via conventional dosage forms like solutions and suspensions has different problems such as nasolacrimal drainage, tears turnover, loss of drug on eyelids, and poor bioavailability (Sultana et al., Citation2006). Highly viscous topical dosage forms like gels and ointments cause blurred vision and patient’s discomfort (Zignani et al., Citation1995).
Glaucoma is an ocular disorder that is characterized by elevated intraocular pressure (IOP) and progressive damage in the optic nerve. It affects the middle aged and elderly. Being the second cause of blindness worldwide (Paul et al., Citation2010), glaucoma is a serious disorder that needs to be under a controlled treatment. Carbonic anhydrase inhibitors (CAIs) are used in the treatment of glaucoma. They aim to decrease the synthesis of fluid in the eye via inhibition of carbonic anhydrase enzymes. CAIs can be administered orally to remove fluid from the body (diuretics), including the eye. Yet this route of administration is limited due to CAIs systemic side effects which include hypokalemia, loss of weight, depression, renal stones, tingling sensation in the limbs, fatigue, and nausea (Epstein & Grant, Citation1977; Goodfield et al., Citation1982). CAIs can also be administered topically several times a day to the eye, yet this leads to patient incompliance. Dorzolamide-HCl (Dorz) is a member of the CAIs class. Dorz is topically active and it is about 20 times more effective, with regard to isoenzyme II, than Acetazolamide (Surgue, Citation1996). Topical Dorz eye drop solution (Trusopt®) was introduced to the market in 1995. The concentration of Dorz in Trusopt® is 2.2% (wv−1), producing 2.0% of the free base, at pH 5.65, hydroxyethyl cellulose is used to make the eye drops more viscous (Sigurdsson et al., Citation2005). The increased viscosity had the advantage of increasing the corneal contact time and the bioavailability of the drug. Yet this product has a drawback of causing local irritation to the eye when applied topically due to the relatively low pH and high viscosity (Silver & Group, Citation2000). Several researchers have used various formulations for ocular delivery of Dorz. These include: in-situ gel nanoemulsion (Ammar et al., Citation2010); niosomes and nano-liposomes (Hasan, Citation2014; Kouchak et al., Citation2016); complexes with beta and gamma cyclodextrins (Sigurdsson et al., Citation2005; Loftsson et al., Citation2012) and polymeric film (Tandale & Wagh, Citation2011).
Proniosomal gels are vesicular systems, in which the vesicles are made up of nonionic based surfactants, Cholesterol and other ingredients. Proniosomal gels can be converted into niosomal suspensions immediately upon hydration. Advantages of proniosomal gels over liposomes and niosomes include the following (Mishra et al., Citation2011): (i) Proniosomal gels don’t need special requirements in storage and handling; (ii) their method of preparation is time saving and avoids incomplete hydration of the lipid/surfactant film on the walls during hydration process; (iii) they show less sedimentation, aggregation or fusion on storage than liposomes and niosomes. Sustaining the release of drug from proniosomal gel formulations help to overcome the disadvantages of frequent ocular dosage form administration. These disadvantages include: patient incompliance, induction of irritation, and cellular damage at the ocular surface (Salminen, Citation1990; Baudouin, Citation1996; Arici et al., Citation2000). Various studies proved the reliability of proniosomal gels in promoting the ocular bioavailability of different drugs. Abdelbary et al. (Citation2017) studied the effect of formulation variables on the in-vitro characters of ocular Ketoconazole-loaded proniosomal gels and carried out both ex-vivo and in-vivo studies. Ocular proniosomal gels of Lomefloxacin-HCl were prepared using different types of nonionic surfactants alone and as mixtures with Span 60 in order to improve its ocular bioavailability for the management of bacterial conjunctivitis (Khalil et al., Citation2017). Tacrolimus-loaded proniosomal gel containing poloxamer 188 and lecithin as surfactants, Cholesterol as a stabilizer and minimal amount of ethanol were prepared and characterized (Li et al., Citation2014).
Thus the aims of this study were to sustain Dorz topical ocular delivery using proniosomal gel formulation. Full factorial design was used to select a suitable proniosomal gel formulation and the optimized formulation was subjected to a comparative pharmacodynamic study against Trusopt® eye drops in rabbits.
Materials and methods
Materials
Dorzolamide-HCl (Dorz) was kindly supplied by Sigmatec Co., Giza, Egypt. l-α-lecithin from soya bean, Span 40 (Sorbitan monopalmitate), Cholesterol, medium molecular weight chitosan (200–800 cps) were purchased from Sigma-Aldrich Co., St. Louis, MO, USA. Ethyl alcohol, disodium hydrogen phosphate, potassium dihydrogen phosphate, and sodium chloride were purchased from Adwic, El Nasr Pharmaceutical Chemicals Co., Abu Zaabal, Egypt. Spectra/Pore® dialysis membrane 12,000–14,000 molecular weight cut off was from Spectrum Laboratories Inc., Rancho Dominguez, CA, USA.
Preparation of proniosomal gels using coacervation phase separation method according to 52 full factorial design
Accurately weighed amounts of l-α-lecithin from soya bean, Cholesterol, Span 40, and Dorz were put in a clean and dry glass container of 5 ml capacity and 2.5 ml ethyl alcohol (95%) were added to them. The glass container was covered with a lid and the mixture was warmed over a water bath at 60–70 °C for about 15 minutes until the components were completely dissolved. Then the aqueous phase 0.9 ml (Phosphate buffer pH = 8) was added and the mixture was warmed on the water bath at the same temperature for (2–5 minutes) till it became a clear solution which was left to cool at room temperature and the proniosomal gel was formed (Vora et al., Citation1998; Gupta et al., Citation2007). When needed, the formed gel was vortexed with the accurately measured volume of phosphate buffer saline (pH =7.4) (PBS) to give a 10 ml of Dorz loaded niosomal dispersion.
The different Proniosomal gel formulations were prepared according to a 52 full factorial design in order to investigate the influence of formulation variables on percentage entrapment efficiency (EE%), particle size (PS), and the percentage drug released after 8 hours (Q8h). Variables studied and their levels investigated are shown in . Different formulations prepared accordingly are shown in . Suitable regression models were elucidated to represent each response as a function of studied factors. These models were used to choose an optimized formulation (OF) according to the predetermined constraints in .
Table 1. Factors studied and respective levels investigated in the 52 full factorial design used for the preparation of proniosomal gel formulations together with the dependent variables and their required constraints.
Table 2. Composition of the prepared Dorzolamide-HCl proniosomal gel formulations and the characterization of their respective niosomes. Data are represented as (mean ± SD).
In-vitro evaluation of the niosomal dispersions
Determination of percentage entrapment efficiency (EE%)
In order to determine the amount of the un-entrapped drug, 1 ml of the dispersion was centrifuged for 1 hour at 14000 rpm and 4 °C in a cooling centrifuge (Beckman, Fullerton, Canada). The supernatant was taken, diluted and measured spectrophotometrically (UV-1601 PC shimadzu, Kyoto, Japan) at λmax=254 nm. EE% was calculated using the following formula (Habib et al., Citation2018):
(1)
(1)
Determination of particle size (PS), polydispersity index (PDI), and zeta potential (ZP)
PS and PDI of the formed niosomes as well as their ZP were determined using Malvern zeta sizer (Malvern Instrument Ltd., Worcestshire, UK). The niosomal dispersions were appropriately diluted with distilled water before measurements (Habib et al., Citation2018).
In-vitro release and kinetic analysis for the release data
The release of Dorz from all prepared formulations and Dorz solution was carried out in horizontal shaking water bath (GFL, Gesellschatt Laboratories, Berlin, Germany). One ml of each formulation niosomal dispersion was centrifuged to get rid of the un-entrapped drug then the niosomes were reconstituted in 1 ml PBS and placed in a dialysis bag (12,000–14,000 molecular weight cut off). The release medium was 60 ml PBS (pH = 7.4) at 37 ± 0.5°C under agitation speed of 50 rpm (Gürsoy et al., Citation2004). Aliquots of 3 ml were withdrawn at time intervals 0.25, 0.5, 1, 1.5, 2, 3, 4, 6, and 8 hours and were replaced by 3 ml of the dissolution medium each time. The amounts of Dorz released were spectrophotometrically measured at λmax = 254 nm
For each formulation, release profile was drawn by plotting the cumulative percent of Dorz released at each time point (Qn in μg) versus time (h). Qn was calculated according to Habib et al. (Citation2018) with modifications:
(2)
(2)
where, Qn is the current cumulative percent of drug released, Cn represents the receptor medium current concentration at nth sample, Vr is the receptor medium volume, Vs is the volume of each sample removed for analysis, and
denotes the summed total of the previously measured concentrations.
Data obtained from the release of the drug from different formulations were kinetically analyzed using excel 2007® (Microsoft, Software). Generally, zero order kinetics, first order kinetics and Higuchi diffusion models were used for the kinetic analysis of the release data. Q8h was determined for each formulation and used as the third response for the full factorial design.
Transmission electron microscopy
In order to investigate the morphological characters of the prepared optimized formulation (OF), it was photographed by transmission electron microscope (Jeol, Jem-2100, Tokyo, Japan) after being negatively stained with potassium phosphotungstate dye (Liu & Guo, Citation2007).
Testing the validity of the proposed models and selection of optimized proniosomal formulation
An objective, statistically eligible way for testing the validity of the proposed models is to calculate 95% two-sided prediction intervals (95% PIs) for the predicted values of responses. The prediction interval (PI) is the range that is likely to include a single future response for a specified combination of factors setting. All measured values for the three responses for all twenty-five combinations were assessed to find whether they fall within the 95% PIs or not (Habib & AbouGhaly, Citation2016).
Design expert software numerical optimization was used for selection of an optimized formulation (OF) satisfying the predetermined constraints listed in . The actual values of factors for the OF will be compared to the predicted values using % deviation and will be tested for lying within the 95% PI range according to the following equation (Sayed et al., Citation2017):
(3)
(3)
Effect of terminal sterilization by gamma irradiation
OF-gel was prepared by incorporation of 0.2% positively charged medium molecular weight chitosan into the OF dispersion. Terminal sterilization by gamma irradiation took place on the produced OF-gel. Irradiation was performed using 60Co irradiator (Volland et al., Citation1994) (National Center for Radiation Research and Technology, Nasr City, Egypt). Samples were irradiated at a dose 25 kGy (Weyenberg et al., Citation2005) in an Indian gamma cell at a dose rate of 1.774 kGyh−1.
PS and ZP were compared before and after sterilization using one way ANOVA test to see whether sterilization have affected these parameters.
Similarity factor (f2) was calculated to compare the release profiles of the OF-gel before and after sterilization via the following equation (Moore & Flanner, Citation1996; Fahmy et al., Citation2018):
(4)
(4)
where n is the number of sampling points, Rt and Tt are the mean percent released from reference (before sterilization) and from test (after sterilization) at time t respectively. An f2 value greater than or equal to 50 indicates that the release profiles are similar, whereas values less than 50 indicate dissimilarity of release profiles.
In-vitro evaluation of the OF-gel
Viscosity
Viscosity of OF-gel was measured by Brookfield viscometer (Model HBDV-I + CP, Spindle CPE-41, Middleboro, MA, USA) at 25 ± 0.1 C˚. About 0.5 g of the tested formula was applied to the plate. The rotational speed ranged from 0.5 to 100 rpm. The results were valid only when the torque was within the acceptable range of 10–100%. A Plot of viscosity and shear stress in relation to shear rate was drawn. The power law model was used to study the rheological behavior.
(5)
(5)
Where τ is the sheer stress, γ is the shear rate, K is the consistency index and n is the flow index. The n value determines the system of the flow. For Newtonian systems, n = 1, if n < 1 then it is a shear thinning system and if n > 1 then it is a dilatant systems. Rheological data was fitted to the non-Newtonian Bingham’s, Carreau’s and Casson’s models to examine the pattern of flow. The model with the highest R2 value described the flow pattern of OF-gel (Fahmy et al., Citation2018).
Surface tension
Surface tension of OF-gel was measured by Du Nouy ring force tensiometer (model K-6, Krüss GmbH, Hamburg, Germany) (Lee et al., Citation2012). The measurements were performed at 20 ± 2 °C. The tensiometer was first calibrated with distilled water and 50 ml of both water and OF-gel were used for the test. The distance between the immersed ring and liquid surface was fixed at 4.5 mm. The surface tension of distilled water was 72 mN/m (Vicario-de-la-Torre et al., Citation2014).
pH
pH was measured by Jenway pH meter (model-3505, Bibby Scientific Ltd., Stone ST15 0SA, UK). The pH was measured by dispersing 1 ml of OF-gel in 9 ml of distilled water. The electrode of the pH meter was immersed in the diluted OF-gel and pH was recorded.
Refractive index
The light refractive index of OF-gel was measured using Hilger and Watts refractometer (model-46.17/63707, Hilger and Watts Ltd., London, UK).
In-vivo evaluation of the OF-gel
The study design was a single-dose crossover design. The experimental procedure was approved by The National Research Center (Cairo, Egypt) (code: PI 1223). The study took place on healthy normotensive male albino rabbits with an average weight of about 2.5 kg. They were hosted in an air-conditioned area at 22 ± 0.5 C° and fed on a standard diet and water. The study included the marketed product Trusopt® eye drops (Trusopt® ED) and the OF-gel. The treatments were instilled in the lower cul-du-sac and the eyes were blinked to insure the instillation. On the first period, after the application of Trusopt® ED or the OF-gel in one eye, any redness was observed and compared to the control untreated eye. Scoring of the eye redness from 0 to 5 took place. Every treatment was instilled in one eye and the other was kept as a control. The IOP was measured twice at each time point using Schiötz Tonometer (Rudolf Riester GmbH and Co. KG, Germany) and average IOP was calculated. On the first period, any animal showing a sign of irritation (eye redness) was to be replaced. Six rabbits completed the whole study. A one week washout period was left between the periods. The percentage decrease in IOP at any time point was calculated using the following equation (Ammar et al., Citation2009):
(6)
(6)
The pharmacodynamic parameters measured were: maximum percentage decrease in IOP [% dec IOP]max, time for maximum percentage decrease in IOP (tmax), area under percentage decrease in IOP versus time curve from zero to 8 h (AUC0–8 h), and mean residence time (MRT). These parameters were calculated using Kinetica® software 2000 (Innaphase Corporation, Philadelphia, PA, USA).
Statistical data analyses
Design-Expert software (V. 7.0.0, Stat-Ease Inc., Minneapolis, MN, USA) was used to statistically analyze the results of the 52 full factorial design and to choose an OF with predetermined characters listed in . ANOVA-factorial was used for comparing means and significance level was set at α = 0.05.
SPSS 20 software (SPSS Inc., Chicago, IL, USA) was used for application of one-way ANOVA for testing whether PS and ZP were affected by radiation. It was also used for application of cross over ANOVA (for % dec IOPmax, AUC0–8 h and MRT) and non-parametric Wilcoxon signed ranks test (for tmax) to detect the significant difference between the treatments in the in-vivo study.
Results and discussion
Percentage entrapment efficiency (EE%)
Span 40 was chosen in this study due to its higher HLB and surface free energy compared to Span 60 (Yoshioka et al., Citation1994) which is prone to yield larger PS and higher capacity of entrapping water-soluble drugs. Obtaining high EE% of a water soluble drug such as Dorz in a niosomal structure is a challenging task. demonstrates that the EE% of the formed niosomes were in the range of 26% to 75%. Terms affecting EE% appearing in the final model for its representation are shown in . ANOVA-factorial showed that both A: Cholesterol and B: Span 40 had significant effects on EE% together with the significant interaction A2B. Due to interaction presence, interaction plot would be better for representation of the effects of the studied factors (Cholesterol and Span 40 amounts) on EE%.
Table 3. Significance of different model terms appearing in the final model for each response, together with models evaluation.
From it is clear that increasing Cholesterol level from 60 to 300 mg led to a decrease in EE%. This effect was negatively parabolic with 180 and 270 mg of Span 40 and positively parabolic with 540 and 630 mg of Span 40. At low Span 40 levels, increasing the Cholesterol level leads to a decrease in the EE% due to its ability to cause disruption of the linear structure of the niosomal membrane leading to drug leakage. Similar results were explained by Mokhtar et al. (Citation2008) who studied the effect of Cholesterol and other formulation parameters on the encapsulation of Flurbiprofen and its release from niosomes. This may be because low Span 40 levels are not enough to stabilize the vesicular membrane. But at higher Span 40 levels (540 and 630 mg), it was observed that increasing the Cholesterol level led to an increase in the EE% till a certain level after which the EE% began to decline again. The increase in EE% is due to increasing the niosomes rigidity as Cholesterol is called “vesicular cement” so that it decreases the drug leakage (Thomas & Viswanad, Citation2012). While the decrease in EE% at higher levels may be because the further increase in the Cholesterol amounts with a high Span 40 levels increases the hydrophobicity of the vesicles that causes the water-soluble drug to be less entrapped. It may also be because the further increase in Cholesterol amounts relative to Span 40 amounts led to the disruption of the niosomes membrane.
Figure 1. (a) and (b): Interaction plots of Cholesterol and Span 40 for the responses of: (a) Percentage entrapment efficiency and (b) Particle size, (c) and (d): Effects plots for the response of Q8h: (c) Cholesterol effect and (d) Span 40 effect.
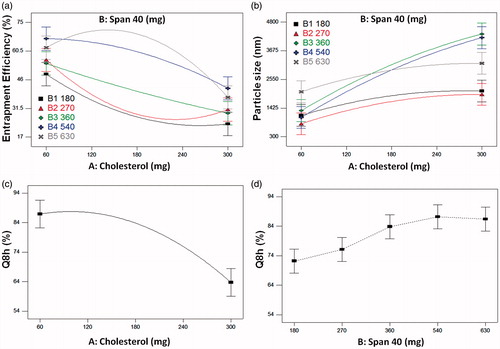
As for the effect of Span 40 level on EE%, it is clear from that the higher the Span 40 level the higher the EE%. Being a water-soluble drug, Dorz tends to escape to the preferable aqueous media. Increasing Span 40 level leads to an increase in Dorz EE%. This may be due to the formation of a larger number of vesicles (Thomas & Viswanad, Citation2012), increasing the vesicles fluidity (Hazel et al., Citation2012) and also due to the role of Span 40 as a surfactant in increasing the solubility of the water-soluble Dorz in organic phase during preparation.
Thus, it can be concluded that the two studied variables should be simultaneously optimized for obtaining maximum EE%.
Particle size (PS), polydispersity index (PDI) and zeta potential (ZP)
shows that all the formulations had a particle size below 5 µm which is suitable for ocular drug delivery systems to avoid irritation by larger particle sizes (Janoria et al., Citation2007). Terms affecting the PS appearing in the final model for its representation are shown in . ANOVA-factorial showed that both (A) Cholesterol and (B) Span 40 had significant effects on PS together with the significant interaction AB. Due to interaction presence, interaction plot would be better for representation of how the studied factors affected PS.
At any Span 40 level, increasing Cholesterol level led to an increase in PS (). This is because the Cholesterol molecules intercalate between the alkyl chain of the surfactant (Abdelkader et al., Citation2010) leading to larger PS.
Span 40 interacted with Cholesterol (interaction term AB in ). This led to the crossing over of different effects lines of Span 40 levels. Generally, higher Span 40 levels (360, 540, and 630 mg) led to higher PS than lower Span 40 levels (180 and 270 mg). This may be due to the increase in EE%. It was found that the water-soluble drugs, like Dorz, increase the vesicular size, because they tend to be encapsulated in the aqueous core of the vesicles (Manconi et al., Citation2002). This causes an interaction between the drugs and the amphiphile head groups and leads to increasing the mutual repulsion of surfactant bilayers (Uchegbu & Florence, Citation1995) thus leading to higher PS.
PDI for the prepared formulations ranged from 0.188 ± 0.110 to 0.897 ± 0.146. This indicates the relative heterogeneity of the size of the prepared vesicles. PDI data for the prepared formulations is shown in Supplementary Table S1.
All the prepared niosomes had negative charges on their surface because of the free hydroxyl groups present in the surfactant and Cholesterol molecules (Zubairu et al., Citation2015). L-α-Lecithin also contains phospholipids which contribute to the negative charge at the neutral pH (Wang & Wang, Citation2008). The magnitude of ZP gives an indication about the stability of the formulations. shows that all the formulations of the design had high negative ZP ranging from −49 to −80.5 which means the presence of strong repulsion between the niosomes and this ensures their stability (Thomas & Viswanad, Citation2012).
In-vitro release and kinetic analysis for the release data
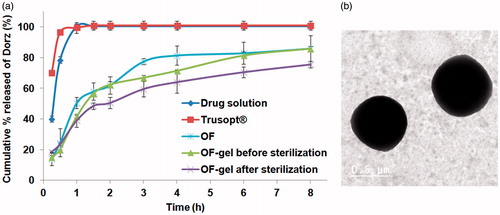
The release of Dorz from all the prepared formulations was biphasic, with an initial faster release followed by a period of slow but sustained release (Supplementary figure S1). This is in accordance with other studies describing the release pattern of drugs from niosomes (Hasan, Citation2014). Comparing the release results of all the formulations prepared with the drug solution release results showed that the drug solution released 78.5% in the first half hour and about 100% in one hour, while in case of Trusopt® ED 96.5% of Dorz was released in the first half hour and about 99.5% in one hour. The release profiles of Dorz from solution and Trusopt® ED are shown in . As for all the 25 studied formulations, they gave a sustained drug release till 8 hours. It means that the niosomal dispersion produced from the reconstitution of the proniosomal gel leads to the sustainment of the release of the water soluble Dorz. The kinetic analysis of the release profiles showed a Higuchi diffusion mechanism of the drug release from all the formulations.
Figure 2. (a) Release profiles of Dorzolamide-HCl from OF-gel before and after sterilization compared to that from optimized formulation (OF), Dorzolamide-HCl solution and Trusopt® eyedrops, (b) Transmission electron image of Dorzolamide-HCl loaded niosomes of optimized formulation negatively stained with potassium phophotungustate.
demonstrates that Q8h of the formed niosomes were in the range of 54.7% to 93.7%. Terms affecting Q8h appearing in the final model for its representation are shown in . ANOVA-factorial showed that both (A) Cholesterol and (B) Span 40 had significant effects on Q8h. Due to absence of interaction main effects plots would be suitable for representation of the effects of the studied factors (Cholesterol and Span 40 amounts) on Q8h.
illustrates that increasing the Cholesterol level decreases Q8h. This may be due to the ability of Cholesterol to abolish the gel to liquid transition of niosomes which decreases the drug release (Abdelbary & El-gendy, Citation2008). Cholesterol also increases the rigidity of vesicles and the hydrophobic barriers through which the drug diffuses.
Generally, increasing Span 40 levels from 180 to 540 mg led to an increase in Q8h (). This may be because Span 40 as a surfactant increases the solubility of Dorz leading to higher drug percentage release (Torchilin, Citation2001). But further increase in Span 40 level to 630 mg led to a decrease in Q8h. This may be due to supplying the Cholesterol molecules with more alkyl chains for stronger interaction and more stability to the membrane (Sankhyan & Pawar, Citation2013) leading to Q8h reduction. It was also reported that an optimum amount of surfactant is required for controlling drug release (Sankhyan & Pawar, Citation2013) and this is similar to what was found in this study.
Testing the validity of the proposed models and selection of optimized proniosomal formulation
All measured mean values of the responses for the 25 design points fell within the corresponding 95% PI. Thus, the final models proved to be adequate for representation and prediction of the studied responses within data uncertainty. As for optimization, the combination having maximum desirability was chosen for the OF as A (Cholesterol): 60 mg and B (Span 40): 540 mg, this was one of the already prepared formulations (F16) (). The overall desirability of this chosen formulation was 0.885, which means that this formulation substantially satisfies the predetermined constraints . shows the predicted values of all the responses for OF together with their 95% PIs. Corresponding actual values are also shown with the calculated % deviation.
Table 4. Predicted values of different responses for the optimized formulation (OF) compared to the actual values together with the prediction intervals and percent deviations.
Transmission electron microscopy
Imaging of OF by transmission electron microscope (), showed that the niosomes had well formed spherical structure and a comparable size to that found by zeta sizer.
Effect of terminal gamma sterilization on OF-gel
Chitosan polymer was chosen for OF-gel preparation because of its reported advantageous mucoadhesive and antimicrobial properties (Akncbay et al., Citation2007; Kong et al., Citation2010). Terminal sterilization is a preferable method of sterilization because it ensures the freedom of the sterilized formulations from microorganisms. Drug content before and after gamma sterilization was found to be within the acceptable range (90%–110%). Both PS and ZP measurements before and after gamma sterilization were analyzed using one-way ANOVA statistical test (at α = 0.05) and the results showed that the difference is not significant. Similarity factor between the drug release profiles before and after sterilization was calculated and found to be f2 = 55, which is within the similarity range (50–100). The release profiles of OF, OF-gel before and after sterilization are shown in (). As a conclusion, depending on the results of percentage drug content, PS, ZP, and similarity factor of the release profiles, gamma sterilization can be used to sterile the prepared dosage form (OF-gel) without any adverse effects on its drug delivery or therapeutic efficiency.
The in-vitro evaluation of OF-gel
Viscosity
Supplementary Figure S2 shows that OF-gel has a non-Newtonian shear thinning behavior as after applying the power law model its flow index (n) value was found to be 0.2768 (<1). Applying the non-Newtonian models to the results showed that the Carreau’s model had the highest R2 value. This indicates a pseudoplastic flow which is suitable for topical preparations (El-Hadidy et al., Citation2012). It was reported that semi-solid systems containing nanocarriers usually present pseudoplastic behavior (Sohrabi et al., Citation2016). The pseudoplastic behavior of the hydrogel is due to the presence of equilibrium between the effect of random Brownian motion and the shear induced changes which increase by increasing the shear stress. As the shear stress increases, the polymer molecules are aligned with their long axes in the direction of flow leading to decreased viscosity. It was also reported that the shear stress causes the release of some of the entrapped water from the dispersed polymer molecules. This leads to decrease in their apparent molecular weight and concentration (Fahmy et al., Citation2018).
Surface tension
The surface tension of ocular formulations is an important issue as it can affect the drug penetration through the cornea. Formulations containing surfactants can emulsify corneal epithelium to a certain extent and help in quicker partitioning of the drug in the epithelium (Dave & Paliwal, Citation2014). The surface tension of tear film is about 44 mN/m (Tiffany et al., Citation1989). The closer the surface tension of the ocular formulation to that of the tear film the more residence time it stays on the corneal surface (Doshi & Xu, Citation2009). The surface tension of OF-gel was found to be 56 mN/m. This may be due to the presence of surfactant and phosphatidylcholine in the prepared vesicles (Vicario-de-la-Torre et al., Citation2014).
pH
pH was of OF-gel was found to be 7.36 ± 0.00 which is compatible with the normal pH of tears (pH =7.4) (Achouri et al., Citation2013) and will not cause irritation to the eye.
Refractive index
Refractive index measurements detect possible patient discomfort due to blurred vision after administration of ocular preparations. The light refraction index of the tear fluid is 1.34–1.36. It was reported that the ocular preparations shouldn't have a refraction index higher than 1.476 (Ammar et al., Citation2009). The refractive index of OF-gel was found to be 1.36 which is within the acceptable range.
The in-vivo evaluation of OF-gel
Only one animal had an irritated red eye (scored 3). This may be due to hypersensitivity against Dorz (being a sulfur-containing drug) so it was replaced by another rabbit which showed no hypersensitivity. Then, within the whole study time, no irritation signs were observed.
The average % dec in IOP for the six rabbits was plotted against time for both OF-gel and Trusopt® ED (). The in-vivo results revealed that Trusopt® ED showed a decreased IOP reaching its maximum value of 32.6 ± 2.7 at 1.5 h and then % dec in IOP decreased rapidly till the IOP returned normal at 5h. On the other hand, the OF-gel showed a sustained action of decreasing the IOP. The % dec in IOP for OF-gel reached its maximum value of 45.4 ± 8.2 at 6 h which was significantly higher than that with Trusopt® ED at α = 0.1. Even at the end of the experimental period of eight hours, % dec in IOP was 19.5 ± 9.2. This means that OF gel continued releasing the drug for a more prolonged time than the marketed Trusopt® ED. This is probably due to two aspects in this formulation; firstly: the mucoadhesive property of the chitosan gel in which the OF is incorporated led to overcoming drug loss caused by ocular barriers and thus longer contact time of vesicles at corneal surface was achieved, and secondly: during this longer contact, niosomes acting as a drug carrier, changed the rate and the extent of Dorz release and absorption resulting in reduction of IOP for a prolonged period of time (Prabhu et al., Citation2010).
Figure 3. Average percentage decrease in intraocular pressure after administration of the OF-gel and Trusopt® eye drops to rabbits.
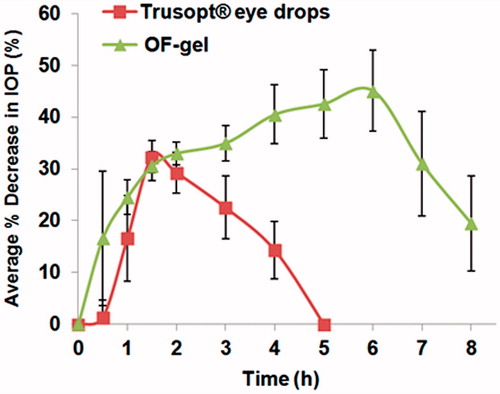
This can be illustrated numerically by comparing tmax and MRT of OF-gel to those of Trusopt® ED. Median tmax was 6 h and 1.75 h for OF gel and Trusopt® ED respectively. Wilcoxon signed rank sum test application to tmax values yielded a Z value of −2.232. This Z value yielded an asymptotic significance of 0.026 which means that OF-gel resulted in significantly higher tmax than Trusopt® ED. As for MRT, mean MRT was 6.1h ± 1.7 and 4.1h ± 1.2 for OF gel and Trusopt® ED respectively. Crossover ANOVA showed that a significant difference (α = 0.05) existed between these two values. This increased MRT ensured the sustainment of the drug release (Chandraprakash et al., Citation1990; Ruckmani et al., Citation2010).
In addition to the prolonged action associated with OF-gel, it also had a fast onset of action where after 1 h it resulted in a % dec in IOP of 24.48% ± 3.3 compared to 16.6% ± 8.3 in case of Trusopt® ED. This may be due to the adsorbed drug on the niosomes surface or the unentrapped drug outside the niosomes.
The better performance of OF-gel compared to Trusopt® ED is manifested in its higher bioavailability where AUC0–8 h values were 264.4%.h ± 18.4 for OF-gel and this was significantly higher than AUC0–8 h for Trusopt® ED which was 76.2%.h ± 12.7 at α = 0.05. This increased bioavailability of Dorz from the OF-gel is the overall result of longer contact time, controlled Dorz release from niosomes and the ability of niosomes to act as a penetration enhancer due to their phosphatidylcholine and surfactant content (Yadav et al., Citation2010).
Conclusion
Dorzolamide-HCl loaded proniosomal gel formulations were prepared according to a 52 full factorial design. All the formulations showed sustained Dorz release, acceptable particle size for ocular administration and high zeta potential which ensured the stability of the prepared formulations. The optimized formulation (OF) chosen for maximizing EE% and Q8h and minimizing PS contained 60 mg Cholesterol and 540 mg Span 40. It had desirability of 0.885 and its actually measured DVs deviated from the predicted ones by a maximum of 4.8%. In the in-vivo study, the measured pharmacodynamic parameters {[% red IOP]max, tmax, MRT and AUC0-8 h} for OF-gel compared to Trusopt® ED were: 45.4% ± 8.2, 6 h (range 5–6h), 6.1h ± 1.7 and 264.4%.h ± 18.4 versus 32.6% ± 2.7, 1.75 h (range 1.5–2h), 4.1h ± 1.2 and 76.2%.h ± 12.7 respectively. These results showed that the OF-gel could result in a higher reduction in IOP, significantly sustain that reduction in IOP and increase Dorz bioavailability compared to Trusopt® eye drops. Thus the OF-gel successfully sustained the IOP reducing effect of Dorz and increased its bioavailability and it is very promising for being used at significantly less frequency than the marketed product Trusopt® eye drops.
Supplemental Material
Download MS Word (35.1 KB)Disclosure statement
No potential conflict of interest was reported by the authors.
References
- Abdelbary G, El-gendy N. (2008). Niosome-encapsulated gentamicin for ophthalmic controlled delivery. AAPS Pharm SciTech 9:740–7.
- Abdelbary GA, Amin MM, Zakaria MY. (2017). Ocular ketoconazole-loaded proniosomal gels: formulation, ex vivo corneal permeation and in vivo studies. Drug Deliv 24:309–19.
- Abdelkader H, Ismail S, Kamal A, Alany R. (2010). Preparation of niosomes as an ocular delivery system for naltrexone hydrochloride: physicochemical characterization. Pharmazie 65:811–17.
- Achouri D, Alhanout K, Piccerelle P, Andrieu V. (2013). Recent advances in ocular drug delivery. Drug Dev Ind Pharm 39:1599–617.
- Akncbay H, Senel S, Ay ZY. (2007). Application of chitosan gel in the treatment of chronic periodontitis. J Biomed Mater Res Part B Appl Biomater 80:290–6.
- Ammar HO, Salama HA, Ghorab M, Mahmoud AA. (2009). Nanoemulsion as a Potential Ophthalmic Delivery System for Dorzolamide Hydrochloride. AAPS PharmSciTech 10:808–19.
- Ammar HO, Salama H, Ghorab M, Mahmoud A. (2010). Development of dorzolamide hydrochloride in situ gel nanoemulsion for ocular delivery. Drug Dev Ind Pharm 36:1330–9.
- Arici MK, Arici DS, Topalkara A, Güler C. (2000). Adverse effects of topical antiglaucoma drugs on the ocular surface. Clin Experiment Ophthalmol 28:113–17.
- Baudouin C. (1996). Side effects of antiglaucomatous drugs on the ocular surface. Curr Opin Ophthalmol 7:80–6.
- Chandraprakash K, Udupa N, Umadevi P, Pillai G. (1990). Pharmacokinetic evaluation of surfactant vesicle-entrapped methotrexate in tumor-bearing mice. Int J Pharm 61:R1–4.
- Dave V, Paliwal S. (2014). A novel approach to formulation factor of aceclofenac eye drops efficiency evaluation based on physicochemical characteristics of in vitro and in vivo permeation. Saudi Pharm J 22:240–5.
- Doshi U, Xu J. (2009). Effect of viscosity, surface tension and mucoadhesion on ocular residence time of lubricant eye drops. Invest Ophthalmol Vis Sci 50:4641.
- El-Hadidy GN, Ibrahim HK, Mohamed MI, El-Milligi MF. (2012). Microemulsions as vehicles for topical administration of voriconazole: formulation and in vitro evaluation. Drug Dev Ind Pharm 38:64–72.
- Epstein DL, Grant WM. (1977). Carbonic anhydrase inhibitor side effects. Serum chemical analysis. Arch Ophthalmol 95:1378–82.
- Fahmy AM, El-setouhy DA, Ibrahim AB, et al. (2018). Penetration enhancer-containing spanlastics (PECSs) for transdermal delivery of haloperidol: in vitro characterization, ex vivo permeation and in vivo biodistribution studies. Drug Deliv 25:12–22.
- Goodfield M, Davis J, Jeffcoate W. (1982). Acetazolamide and symptomatic metabolic acidosis in mild renal failure. Br Med J (Clin Res Ed) 284:422.
- Gupta A, Prajapati SK, Balamurugan M, et al. (2007). Design and development of a proniosomal transdermal drug delivery system for captopril. Trop J Pharm Res 6:687–93.
- Gürsoy A, Kut E, Özkırımlı S. (2004). Co-encapsulation of isoniazid and rifampicin in liposomes and characterization of liposomes by derivative spectroscopy. Int J Pharm 271:115–23.
- Habib BA, AbouGhaly MHH. (2016). Combined mixture-process variable approach: a suitable statistical tool for nanovesicular systems optimization. Expert Opin Drug Deliv 13:1–12.
- Habib BA, Sayed S, Elsayed GM. (2018). Enhanced transdermal delivery of ondansetron using nanovesicular systems: Fabrication, characterization, optimization and ex-vivo permeation study-Box-Cox transformation practical example . Eur J Pharm Sci 115:352–61.
- Hasan AA. (2014). Design and in vitro characterization of small unilamellar niosomes as ophthalmic carrier of dorzolamide hydrochloride. Pharm Dev Technol 19:748–54.
- Hazel G, Akhilesh D, Prabhakara P. (2012). Kamath Jagadish V. Development and evaluation of norfloxacin loaded maltodextrin based proniosomes. Int Res J Pharm 3:176–9.
- Janoria KG, Gunda S, Boddu SH, Mitra AK. (2007). Novel approaches to retinal drug delivery. Expert Opin Drug Deliv 4:371–88.
- Khalil RM, Abdelbary GA, Basha M, et al. (2017). Enhancement of lomefloxacin HCl ocular efficacy via niosomal encapsulation: in vitro characterization and in vivo evaluation. J Liposome Res 27:312–23.
- Kong M, Chen XG, Xing K, Park HJ. (2010). Antimicrobial properties of chitosan and mode of action: a state of the art review. Int J Food Microbiol 144:51–63.
- Kouchak M, Bahmandar R, Bavarsad N, Farrahi F. (2016). Ocular Dorzolamide Nanoliposomes for Prolonged IOP Reduction: in-vitro and in-vivo Evaluation in Rabbits. Iran J Pharm Res 15:205–12.
- Lee B-B, Chan E-S, Ravindra P, Khan TA. (2012). Surface tension of viscous biopolymer solutions measured using the du Nouy ring method and the drop weight methods. Polym Bull 69:471–89.
- Li Q, Li Z, Zeng W, et al. (2014). Proniosome-derived niosomes for tacrolimus topical ocular delivery: in vitro cornea permeation, ocular irritation, and in vivo anti-allograft rejection. Eur J Pharm Sci 62:115–23.
- Liu T, Guo R. (2007). Investigation of PEG 6000/Tween 80/Span 80/H2O niosome microstructure. Colloid Polym Sci 285:711–13.
- Loftsson T, Jansook P, Stefansson E. (2012). Topical drug delivery to the eye: dorzolamide. Acta Ophthalmol 90:603–8.
- Manconi M, Sinico C, Valenti D, et al. (2002). Niosomes as carriers for tretinoin. I. Preparation and properties. Int J Pharm 234:237–48.
- Mishra A, Kapoor A, Bhargava S. (2011). Proniosomal gel as a carrier for improved transdermal drug-delivery. AJPS 1:370–9.
- Mokhtar M, Sammour OA, Hammad MA, Megrab NA. (2008). Effect of some formulation parameters on flurbiprofen encapsulation and release rates of niosomes prepared from proniosomes. Int J Pharm 361:104–11.
- Moore JW, Flanner HH. (1996). Mathematical comparison of dissolution profiles. Pharma Tech 20:64–74.
- Paul S, Mondol R, Ranjit S, et al. (2010). Antiglaucomatic niosomal system: recent trend in ocular drug delivery research. Int J Pharm Pharm Sci 2:15–18.
- Prabhu P, Koland M, Vijaynarayan K. (2010). Preparation and evaluation of niosomes of brimonidine tartrate as ocular drug delivery system. JPRHC 2:293–301.
- Ruckmani K, Sankar V, Sivakumar M. (2010). Tissue distribution, pharmacokinetics and stability studies of zidovudine delivered by niosomes and proniosomes. J Biomed Nanotechnol 6:43–51.
- Salminen L. (1990). Review: systemic absorption of topically applied ocular drugs in humans. J Ocul Pharmacol Ther 6:243–9.
- Sankhyan A, Pawar PK. (2013). Metformin loaded non-ionic surfactant vesicles: optimization of formulation, effect of process variables and characterization. Daru J Daru 21:7.
- Sigurdsson HH, Stefánsson E, Gudmundsdóttir E, et al. (2005). Cyclodextrin formulation of dorzolamide and its distribution in the eye after topical administration. J Control Release 102:255–62.
- Sayed S, Habib BA, Elsayed GM. (2017). Tri-block co-polymer nanocarriers for enhancement of oral delivery of felodipine: preparation, in vitro characterization and ex vivo permeation. J Liposome Res 1–11 DOI:10.1080/08982104.2017.1327541.
- Silver LH, Group BCS. (2000). Ocular comfort of brinzolamide 1.0% ophthalmic suspension compared with dorzolamide 2.0% ophthalmic solution: results from two multicenter comfort studies. Surv Ophthalmol 44:S141–S5.
- Sohrabi S, Haeri A, Mahboubi A, et al. (2016). Chitosan gel-embedded moxifloxacin niosomes: an efficient antimicrobial hybrid system for burn infection. Int J Biol Macromol 85:625–33.
- Surgue MF. (1996). Review the preclinical pharmacology of dorzolamide hydrochloride, a topical carbonic anhydrase inhibitor. J Ocul Pharmacol Ther 12:363–76.
- Sultana Y, Jain R, Aqil M, Ali A. (2006). Review of ocular drug delivery. Curr Drug Deliv 3:207–17.
- Tandale YN, Wagh VD. (2011). Formulation and evaluation of dorzolamide hydrochloride polymeric film. Int J Pharmtech Res 3:1817–24.
- Tiffany J, Winter N, Bliss G. (1989). Tear film stability and tear surface tension. Curr Eye Res 8:507–15.
- Thomas L, Viswanad V. (2012). Formulation and optimization of clotrimazole-loaded proniosomal gel using 3(2) factorial design. Sci Pharm 80:731–48.
- Torchilin VP. (2001). Structure and design of polymeric surfactant-based drug delivery systems. J Control Release 73:137–72.
- Uchegbu IF, Florence AT. (1995). Non-ionic surfactant vesicles (niosomes): physical and pharmaceutical chemistry. Adv Colloid Interface Sci 58:1–55.
- Vicario-de-la-Torre M, Benítez-del-Castillo JM, Vico E, et al. (2014). Design and characterization of an ocular topical liposomal preparation to replenish the lipids of the tear film. Invest Ophthalmol Vis Sci 55:7839–47.
- Volland C, Wolff M, Kissel T. (1994). The influence of terminal gamma-sterilization on captopril containing poly (D, L-lactide-co-glycolide) microspheres. J Control Release 31:293–305.
- Vora B, Khopade AJ, Jain N. (1998). Proniosome based transdermal delivery of levonorgestrel for effective contraception. J Control Release 54:149–65.
- Wang G, Wang T. (2008). Oxidative stability of egg and soy lecithin as affected by transition metal ions and pH in emulsion. J Agric Food Chem 56:11424–31.
- Weyenberg W, Vermeire A, Vandervoort J, et al. (2005). Effects of roller compaction settings on the preparation of bioadhesive granules and ocular minitablets. Eur J Pharm Biopharm 59:527–36.
- Yadav K, Yadav D, Saroha K, et al. (2010). Proniosomal Gel: a provesicular approach for transdermal drug delivery. Pharm Lett 2:189–98.
- Yoshioka T, Sternberg B, Florence AT. (1994). Preparation and properties of vesicles (niosomes) of sorbitan monoesters (Span 20, 40, 60 and 80) and a sorbitan triester (Span 85). Int J Pharm 105:1–6.
- Zignani M, Tabatabay C, Gurny R. (1995). Topical semi-solid drug delivery: kinetics and tolerance of ophthalmic hydrogels. Adv Drug Deliv Rev 16:51–60.
- Zubairu Y, Negi LM, Iqbal Z, Talegaonkar S. (2015). Design and development of novel bioadhesive niosomal formulation for the transcorneal delivery of anti-infective agent: In-vitro and ex-vivo investigations. Asian J Pharm Sci 10:322–30.