
 ?Mathematical formulae have been encoded as MathML and are displayed in this HTML version using MathJax in order to improve their display. Uncheck the box to turn MathJax off. This feature requires Javascript. Click on a formula to zoom.
Abstract
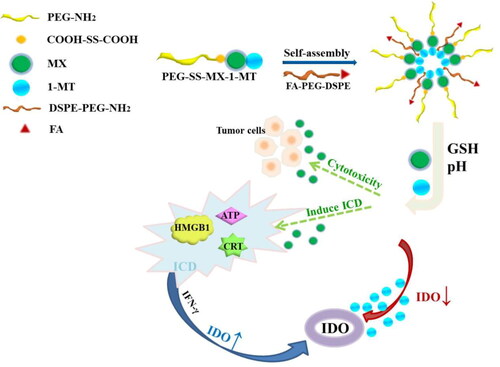
Mitoxantrone (MX) can induce the immunogenic-cell death (ICD) of tumor cells and activate anti-tumor immune responses. However, it can also cause high expression of indole amine 2, 3-dioxygenase (IDO) during ICD, leading to T-cell apoptosis and a weakened immune response. An IDO inhibitor, 1-methyl tryptophan (1-MT), can inhibit the activity of IDO caused by MX, resulting in enhanced chemo-immunotherapy. Here, MX-1-MT was connected by ester bond which could be broken in an acidic tumor microenvironment. MX-1-MT was combined with polyethylene glycol (PEG) via a disulfide bond which could be reduced by glutathione overexpressed in tumors, thereby accelerating drug release at target sites. Folic acid-modified distearoyl phosphoethanolamine-polyethylene glycol (DSPE-PEG-FA) was introduced to form targeting micelles. The micelles were of uniform particle size, high stability, and high responsiveness. They could be taken-up by drug-resistant MCF-7/ADR cells, displayed high targeting ability, and induced enhanced cytotoxicity and ICD. Due to 1-MT addition, micelles could inhibit IDO. In vivo studies demonstrated that micelles could accumulate in the tumor tissues of nude mice, resulting in an enhanced antitumor effect and few side-effects.
1. Introduction
Breast cancer is one of the most common malignant tumors in women (especially in young women), and seriously affects quality of life (Henriques et al., Citation2021; Retecki et al., Citation2021). Breast cancer incidence ranks first among malignant tumors in women in China.
Chemotherapy is the main treatment method for breast cancer. The anthraquinone mitoxantrone (MX) (An et al., Citation2021) is efficacious against breast cancer. It can produce an anti-tumor effect by disturbing DNA synthesis (Evison et al., Citation2016; Granja et al., Citation2021). Some studies have shown that MX can also induce immunogenic-cell death (ICD) (Kepp et al., Citation2019). ICD can promote damage-associated molecular patterns (Zhou et al., Citation2019; Kim et al., Citation2022) in dying cancer cells, including exposure of calreticulin (CRT) (Mei et al., Citation2020) on the membrane surface, release of high mobility group box 1 (HMGB1), and secretion of adenosine triphosphate (ATP) (Li et al., Citation2020). All of these substances activate dendritic cells (Dudek et al., Citation2013) to devour dying tumor cells and recruit activated cytotoxic T cells to the tumor site. However, this process also induces overexpression of indole amine 2,3-dioxygenase (IDO) in tumor cells (Li et al., Citation2021) and activation of regulatory T cells (Tregs). These actions can further inhibit the functions of effector T cells and natural killer cells, thereby weakening the therapeutic effect of ICD (Li et al., Citation2021; Yang et al., Citation2022).
IDO is the key enzyme in the catabolism of tryptophan (Trp) to kynurenine (Kyn). Overexpressed IDO promotes excessive degradation of Trp to Kyn (Li et al., Citation2019; Fronik et al., Citation2021), leading to the anergy or apoptosis of T cells and differentiation of Tregs, and results in inhibition of the anti-tumor immune response (Zhang et al., Citation2019) .1-Methyl-tryptophan (1-MT) (Tsao et al., Citation2022) is a derivative of Trp. 1-MT can inhibit IDO activity through competitive binding, thereby reducing Trp degradation and Kyn production (Zhou et al., Citation2020), and regulating the immunosuppressive tumor microenvironment.
However, cancer cells have been reported to show multidrug resistance to MX: MX is pumped out of cancer cells and results in a weak anticancer effect. 1-MT also displays deficient potency, mainly because of its poor solubility in water and inadequate targeting (Selvan et al., Citation2016; Günther et al., Citation2019; Zhang et al., Citation2019).
To improve the water solubility of drugs, use of polyethylene glycol (PEG)ylated prodrugs (in which hydrophobic drugs are conjugated to PEG via chemical bonds) is the most widely used strategy. PEG and drugs can be combined via environment-sensitive linkers (e.g., ester bond (Chen et al., Citation2020; Han et al., Citation2020 ) or disulfide bond (Wang et al., Citation2021)), which can remain stable in normal tissues but can be cracked rapidly in acidic or glutathione (GSH)-overexpressed tumor sites. Hence, prodrugs display fewer side-effects and greater anti-cancer efficacy (Guo et al., Citation2018).
In addition to the specific tumor microenvironment, cancer cells also show particular characteristics. For example, the folic acid (FA) receptor has high affinity for FA, and shows high expression on the surface of tumor cells (Li et al., Citation2018). Thus, FA-modified drug-delivery systems are expected to be transported selectively into tumor cells, thereby improving cellular uptake and enhancing the anticancer activity of drugs while reducing toxicity to normal cells (Wang et al., Citation2018).
Based on the theories mentioned above, a nano drug-delivery system with active targeting and GSH-responsibility was constructed. First, reduction-responsive PEG-SS-MX-1-MT and active-targeting distearoyl phosphoethanolamine-polyethylene glycol-FA (DSPE-PEG-FA) were synthesized, Then, the two polymers were mixed to form a nano-drug-delivery system based on micelles: PEG-SS-MX-1-MT/FA. The FA-modified nano-preparation PEG-SS-MX-1-MT/FA could enter tumor cells through active targeting. Then, the disulfide bond was broken under a high GSH concentration to release MX, whereas 1-MT was freed by degradation of ester bonds in the acidic tumor microenvironment. MX could cause cytotoxicity and induce ICD in tumor cells and activate anti-tumor immune responses. 1-MT could inhibit the activity of IDO caused by MX, thereby regulating immunosuppression of the tumor microenvironment and achieving chemo-immunotherapy.
2. Materials and methods
2.1. Materials
MX was purchased from Shanghai Macklin Biochemical Co., Ltd. (China). 1-(3-dimethylaminopropyl)-3-ethylcarbodiimide hydrochloride (EDCI), 4-Pyrrolidinopyridine (4-ppy), PEG-NH2 (2000), dithiodibutyric acid, N-hydroxysuccinimide (NHS), folic acid, DSPE-PEG-NH2 (2000), trichloroacetic acid, DL-Dithiothreitol (DTT) and 4-Dimethylaminobenzaldehyde were purchased from Shanghai Aladdin Reagent Co., Ltd. (China). 1-MT-Boc was purchased from SINO High Goal Chemical Technology Co., Ltd. Dialysis bag was purchased from Yobios Science And Technology Co., Ltd. (China).
Roswell Park Memorial Institute-1640 (RPMI-1640), fetal bovine serum (FBS), trypsin solution, penicillin–streptomycin solution and phosphate buffered saline (PBS, pH 7.4) were obtained from Procell Life Science & Technology Co., Ltd. (Wuhan, China). 4% paraformaldehyde solution, 2-(4-amidinophenyl)-6-indolecarbamidine dihydrochloride (DAPI), 3-(4, 5-dimethylthiazol-2-yl)-2, 5-diphenyltetrazolium bromide (MTT) and HMGB1 ELISA Kit were obtained from Beijing Solarbio Science & Technology Co., Ltd. (Beijing, China). Anti-HMGB1 Rabbit mAb and Anti-Calreticulin Rabbit pAb were obtained from ABclonal Technology Co., Ltd. (Wuhan, China). TritonX-100 and Enhanced ATP Assay Kit were purchased from Beyotime Biotechnology Co., Ltd. (Shanghai, China). Recombinant mouse interferon gamma (IFN-γ) was bought from BioLegend, Inc. Kyn and Trp were obtained from Sigma Co., Ltd. BALB/c nude mice (male, 5–6 weeks) were purchased from the Beijing Huafukang Biotechnology Co., Ltd. All animal experiments were approved by the Ethical Committee on Animal Experimentation of Yantai University (Yantai, China) ().
Figure 1. Schematic structure of PEG-SS-MX-1-MT/FA and drug effect under the tumor microenvironment.
2.2. Synthesis and characteristics of PEG-SS-MX-1-MT and DSPE-PEG-FA
2.2.1. Synthesis and characteristics of PEG-SS-MX-1-MT
First, MX-1-MT-Boc was synthesized. Briefly, 1-MT-Boc (88.3 mg, 0.278 mmol) was dissolved in dry dimethyl sulfoxide (DMSO; 2 mL). Then, 4-ppy (98.7 mg, 0.666 mmol) and EDCI (127.7 mg, 0.666 mmol) were added sequentially. Thirty-minutes later, MX (172.3 mg, 0.333 mmol) dissolved in DMSO was added. After allowing the reaction to proceed at room temperature for 24 h, the reaction solution was extracted by ethyl acetate and the intermediate product (MX-1-MT-Boc) was obtained by vacuum drying.
To synthesize PEG-SS-COOH, PEG-NH2 (2000) (500.0 mg, 0.25 mmol) was first dissolved in dry dichloromethane (2 mL). Then, dithiodibutyric acid (70.0 mg, 0.3 mmol) dissolved in dry dimethylformamide (0.5 mL), DIEA (97.0 mg, 0.75 mmol) dissolved in dry dichloromethane (1 mL), and HATU (142.6 mg, 0.375 mmol) dissolved in dry dimethylformamide (1 mL) were added. After being allowed to react at room temperature for 24 h, the product was precipitated with cold ether and dried in a vacuum.
According to a molar ratio of PEG-SS-COOH: MX: 4-ppy: EDCI of 1.2:1:2:2, PEG-SS-COOH dissolved in dry DMSO was first catalyzed by 4-ppy and EDCI, and then MX-1-MT-Boc was added. This reaction was carried out at room temperature. After 24 h, the reaction solution was dialyzed against deionized water for 2 days and the product (PEG-SS-MX-1-MT-Boc) was obtained by freeze-drying for 24 h.
To obtain the final product (PEG-SS-MX-1-MT), PEG-SS-MX-1-MT-Boc was dissolved in 10% trifluoroacetic acid/dichloromethane (v/v) and reacted in ice water for 4 h. After evaporation, the product was dissolved in dichloromethane, and the residual trifluoroacetic acid was removed by extraction with saturated NaHCO3 solution. The latter was washed away by water extraction while the solvent (dichloromethane) was removed using a rotary evaporator. The structure of the PEG-SS-MX-1-MT was confirmed by proton nuclear magnetic resonance (1H-NMR) spectroscopy and Fourier-transform-infrared (FT-IR) spectroscopy.
2.2.2. Synthesis and characteristics of DSPE-PEG-FA
DSPE-PEG-FA was synthesized according to a method described previously (Li et al., Citation2015). Briefly, FA (66.17 mg, 0.15 mmol) was dissolved in DMSO. NHS (20.72 mg, 0.18 mmol) and EDCI (34.51 mg, 0.18 mmol) dissolved in DMSO were added to activate the carboxy group of FA at room temperature for 30 min. DSPE-PEG-NH2 (2000) (200 mg, 0.1 mmol) dissolved in DMSO was added to the reaction solution. After being allowed to react for 24 h, the reaction solution was dialyzed against deionized water for 2 days, which was then lyophilized to obtain a yellow product. The structure of DSPE-PEG-FA was confirmed by spectroscopy (1H-NMR and FT-IR).
2.3. Preparation and characterization of PEG-SS-MX-1-MT/FA
2.3.1. Preparation of PEG-SS-MX-1-MT/FA
PEG-SS-MX-1-MT (10 mg) and DSPE-PEG-FA (10 mg) were dissolved in DMSO (200 μL), respectively. Then, PEG-SS-MX-1-MT and DSPE-PEG-FA were mixed at a volume ratio of 2:1. After stirring for 30 min at room temperature, deionized water was added dropwise slowly and the mixture stirred for an additional 2 h at room temperature. Finally, the mixed solution was transferred to an ultrafiltration tube (10 kDa) and centrifuged twice at 5000 rpm to obtain concentrated PEG-SS-MX-1-MT/FA.
2.3.2. Size and morphology of PEG-SS-MX-1-MT/FA
The particle size of PEG-SS-MX-1-MT/FA was measured by Zetasizer Nano ZS (Malvern Instruments, Malvern, UK). For morphology observation, PEG-SS-MX-1-MT/FA micelles were added dropwise on a clean carbon-coated copper grid. After drying, the sample was observed under a transmission electron microscope (JEM-1400 Plus; Jeol, Tokyo, Japan) and photographed to record the morphology.
2.3.3. Critical micelle concentration (CMC) of PEG-SS-MX-1-MT/FA
Nile Red solution (10 μL) dissolved in methyl alcohol (10 −4 mg/mL) was placed in a series of tubes. After methyl alcohol had evaporated overnight, PEG-SS-MX-1-MT/FA solution of different concentrations was added to the Nile Red solution-containing tubes, thereby making a final concentration of Nile Red of 1 0 −6 mg/mL. After ultrasonic treatment for 40 min, the solution was kept in the dark for 3 h at room temperature. The fluorescence intensity was measured using a fluorescence spectrophotometer.
2.3.4. Sensitivity of PEG-SS-MX-1-MT/FA to the environment
Drug release in vitro was measured by a dialysis method. PEG-SS-MX-1-MT/FA solution was placed in a dialysis bag (molecular weight cutoff = 1000 Da) and immersed in PBS at pH 7.4 or 5.0 containing DTT (0, 10, 50 mM) at 37 °C with continuous stirring (100 rpm). At predefined time points, 2 mL of a sample was drawn from the release medium and an equal volume of fresh release medium was added. The content of MX released in a sample was determined by an ultraviolet–visible spectrophotometer at 610 nm. The content of 1-MT released in a sample was determined by high-performance liquid chromatography (Agilent Technologies, Santa Clara, CA, USA). Finally, the cumulative percent release was calculated and a release profile was plotted.
2.3.5. Stability of PEG-SS-MX-1-MT/FA in vitro
A solution of PEG-SS-MX-1-MT/FA micelles and PBS (pH 7.4) containing 10% FBS was mixed at a volume ratio of 1:20 (Yang et al., Citation2018). Samples were placed in a water bath at 37 °C. The particle size of PEG-SS-MX-1-MT/FA micelles was measured at 0, 3, 6, 9, 12, 24, and 48 h.
2.3.6. Hemolysis of PEG-SS-MX-1-MT/FA
The hemolysis of PEG-SS-MX-1-MT/FA micelles in vitro was used to evaluate if they could be administered via the intravenous route. A solution of PEG-SS-MX-1-MT/FA micelles (150 μL) of different concentrations was mixed with a red blood cell suspension (1.25 mL) and 1.1 mL of physiologic (0.9%) saline. A mixed solution of red blood cell suspension (1.25 mL) and saline (1.25 mL) was set as the negative control. A mixed solution of red blood cell suspension (1.25 mL) and ultrapure water (1.25 mL) was set as the positive control. After incubation for 3 h at 37 °C and centrifugation (1500 rpm, 15 min), the absorbance of the supernatant at 540 nm was measured by an ultraviolet–visible spectrophotometer (Yang et al., Citation2020). Percent hemolysis was calculated according to the following equation.
2.4. Cytotoxicity assay
The cytotoxicity of PEG-SS-MX-1-MT/FA was detected by MTT assay. Accordingly, a tumor-cell suspension (200 μL) was seeded into a 96-well plate at 5000 cells/well and cultured overnight. After cells had adhered, a medium loaded with MX, MX + 1-MT, PEG-SS-MX-1-MT, and PEG-SS-MX-1-MT/FA was added to each well, respectively, and incubation allowed for 48 h; the final concentration of MX was 20, 10, 5, 1, and 0.1 μg/mL. Subsequently, 20 μL of MTT solution (5 mg/mL) was added, followed by additional incubation for 4 h. After removal of the supernatant, DMSO (150 μL) was added to each well to dissolve the purple formazan crystals. Finally, the absorbance was measured at 490 nm using a microplate reader (Model 550; Bio-Rad Laboratories, Hercules, CA, USA). Percent inhibition of cells was calculated using the following equation.
2.5. Inhibition of proliferation of three-dimensional (3D) tumor spheroids
Sterile agarose solution was added to a 96-well plate and cooled to room temperature. MCF-7/ADR cells were seeded into the 96-well plate at 5 × 10³/well and cultured in an incubator. Tumor spheroids (Di Donato et al., Citation2022) of appropriate shape and size were selected and treated with MX, PEG-SS-MX-1-MT, and PEG-SS-MX-1-MT/FA at a MX concentration of 1 μg/mL. In the next 5 days, 3D tumor spheroids were photographed using an optical microscope (Eclipse E400; Nikon, Tokyo, Japan).
2.6. Wound-healing assay
A tumor-cell suspension (2 mL) was seeded into a six-well culture plate at 106 cells/well overnight. Then, three parallel lines were drawn on the cell layer with a sterile pipette tip. Cell debris was washed off thrice with PBS. A medium (2 mL) loaded with MX, PEG-SS-MX-1-MT, and PEG-SS-MX-1-MT/FA was added to each well, and the MX concentration was 1 μg/mL. After incubation for 48 h, the wound area was photographed using a microplate reader. Cell migration in the treatment groups was analyzed (Yang et al., Citation2018; Di Donato et al., Citation2022).
2.7. Cell-uptake assay
Coumarin 6 (C6) was used as a “model drug” to observe the uptake behavior of micelles by cells. A cell suspension (2 mL) was seeded into 12-well plate at 2 × 10⁵ cells/well and cultured to allow cells to adhere. Then, culture medium (2 mL) containing C6, PEG-SS-MX-1-MT/C6, and PEG-SS-MX-1-MT/FA/C6 with a C6 concentration of 1 μg/mL was added to each well. After culture for 4 h, C6 was washed off thrice with PBS. Cells were collected and resuspended in PBS (0.5 mL). The mean fluorescence intensity of cells was measured by flow cytometry.
2.8. ICD function of PEG-SS-MX-1-MT/FA
2.8.1. CRT efflux
A cell suspension (5 × 10⁵) was seeded into a cell plate with a glass bottom and cultured overnight. After treatment with MX, PEG-SS-MX-1-MT, and PEG-SS-MX-1-MT/FA at a MX concentration of 1 μg/mL for 24 h, cells were fixed in 4% paraformaldehyde for 30 min and washed thrice with PBS. Then, fixed cells were incubated with anti-CRT rabbit polyclonal (primary) antibody overnight at 4 °C, and FITC-labeled goat anti-rabbit antibody for 1 h at room temperature subsequently (Turubanova et al., Citation2019). After staining with DAPI for 30 min, the CRT distribution was observed by confocal laser scanning confocal microscopy (CLSM).
2.8.2. HMGB1 secretion
Tumor cells were plated at 5 × 10⁵ cells/well in a cell plate with a glass bottom and allowed to adhere overnight. After treatment with MX, PEG-SS-MX-1-MT, and PEG-SS-MX-1-MT/FA at a MX concentration of 1 μg/mL for 24 h, cells were fixed with 4% paraformaldehyde for 30 min. Then, the cell membrane was permeabilized by 0.1% TritonX-100 for 10 min (Zhang et al., Citation2020). Next, cells were incubated with anti-HMGB1 rabbit monoclonal (primary) antibody overnight at 4 °C, and FITC-labeled goat anti-rabbit antibody for 1 h at room temperature subsequently. Finally, cell nuclei were stained by DAPI for 30 min, and HMGB1 efflux in tumor-cell nuclei observed by CLSM.
To quantify HMGB1 secretion, a cell suspension (5 × 10⁵) was seeded into a six-well plate and cultured overnight. After treatment with MX, PEG-SS-MX-1-MT, and PEG-SS-MX-1-MT/FA at a MX concentration of 1 μg/mL for 24 h, the supernatant was collected and processed according to the instructions of an ELISA test kit. Finally, the HMGB1 content in the sample was measured by a microplate reader.
2.8.3. ATP release
MCF-7/ADR tumor cells were seeded into a 12-well cell-culture plate at 2 × 10⁵/well. After treatment with MX, PEG-SS-MX-1-MT, and PEG-SS-MX-1-MT/FA at a MX concentration of 1 μg/mL for 24 h, the supernatant of tumor cells was collected. The ATP content was measured according to the instructions of an ATP assay kit (Zhou et al., Citation2016).
2.9. IDO inhibition
The inhibitory effect of PEG-SS-MX-1-MT/FA on IDO was evaluated by the content of kyn in cell supernatants. MCF-7/ADR cells were seeded into 96-well plates at 1 × 10⁴ cells/well. After adherence, cells were cultured in a medium containing IFN-γ (100 ng/mL) and trp (100 μM) for 24 h. Then, the old medium was discarded. Fresh media loaded with MX, PEG-SS-MX-1-MT, and PEG-SS-MX-1-MT/FA with a MX concentration of 10, 20, 40, and 80 μM were used to culture cells continuously for 24 h. After centrifugation, 10 μL of trichloroacetic acid (30%) was added to the supernatant (140 μL) and incubation undertaken for 30 min at 50 °C. After centrifugation (3000 rpm, 10 min, room temperature), the supernatant (100 μL) was mixed with an identical volume of Ehrlich reagent in the dark. The absorbance of samples and Kyn standard solution at 470 nm was measured by a microplate reader (Zhou et al., Citation2021).
2.10. In vivo distribution
To observe the distribution of micelles in vivo, DiR, PEG-SS-MX-1-MT/DiR, and PEG-SS-MX-1-MT/FA/DiR (at the DiR concentration at 100 μg/kg) were injected into the tail vein of nude mice. DiR distribution in vivo was imaged at predetermined times. Twelve hours after sacrificing, the major organs and tumor tissues were harvested and imaged.
2.11. In vivo antitumor effect
To evaluate the anti-tumor effect in vivo, tumor-bearing nude mice were allotted randomly into four groups of five. Tumor-bearing nude mice were injected with saline, free MX, PEG-SS-MX-1-MT, and PEG-SS-MX-1-MT/FA (at a MX-equivalent dose of 4 mg/kg bodyweight) in the tail vein every 2 days. The bodyweight and tumor volume of nude mice were measured every other day. Mice were sacrificed on day-18. The heart, liver, spleen, lungs, kidneys, and tumor tissues were excised, weighed, and fixed in 4% paraformaldehyde solution. Percent tumor inhibition was calculated using the following equation:
where Wc is the tumor weight of the control group and Wt is the tumor weight of the experimental group.
2.12. IDO inhibition in vivo
The inhibitory effect of IDO in vivo was characterized by the contents of Trp and Kyn in tumor tissues (Zhang et al., Citation2019). After tumor tissues of identical weight had been homogenized, trichloroacetic acid was added and incubation undertaken for 30 min at 50 °C. After centrifugation, the supernatant (100 μL) was mixed with Ehrlich reagent in the dark. The absorbance was measured by a microplate reader and the contents of Trp and Kyn were calculated.
2.13. Immunomodulatory effect
To further explore the immune-associated anti-tumor effect of PEG-SS-MX-1-MT/FA, cytokine levels in the blood and tumor tissues of nude mice were measured after PEG-SS-MX-1-MT/FA administration. Blood samples of nude mice were collected and centrifuged to obtain serum. Tumor tissue was ground and centrifuged to collect supernatants. Expression of the cytokines IFN-γ, TNF-α, and IL-10 was measured by ELISA kits (Zhou et al., Citation2019).
2.14. Histopathology
The tumor tissues were embedded in paraffin for histopathology. The tumors were dehydrated, embedded in paraffin, sectioned, and then stained with hematoxylin and eosin (H&E) (Li et al., Citation2019). Finally, sections were observed under an optical microscopic.
TUNEL staining was employed to analyze the apoptosis of tumor cells. A paraffin section of tumor tissue was added to a TUNEL reaction solution, and 3, 3′-Diaminobenzidine was used for color development. Finally, each stained sample was photographed by an optical microscope.
3. Results and discussion
3.1. Synthesis and characterization
3.1.1. Synthesis and characterization of PEG-SS-MX-1-MT
PEG-SS-MX-1-MT was synthesized according to the route shown in . MX and 1-MT-Boc were connected by an ester bond, and then connected to PEG by a disulfide bond. The Boc group was removed by trifluoroacetic acid and the final product, PEG-SS-MX-1-MT, was obtained. The structure of the products was confirmed by spectroscopy (1H-NMR and FT-IR). Appearance of the characteristic peaks of MX (d, e) and 1-MT (f) in the 1H-NMR spectrum of PEG-SS-MX-1-MT shown in demonstrated that MX-1-MT was attached to PEG-SS-COOH (Lan et al., Citation2020).
Figure 2. (a) Synthetic route of PEG-SS-MX-1-MT. (b) FT-IR spectra of MX, 1-MT, PEG-SS-COOH and PEG-SS-MX-1-MT. (c) 1H-NMR spectrum of PEG-SS-MX-1-MT.
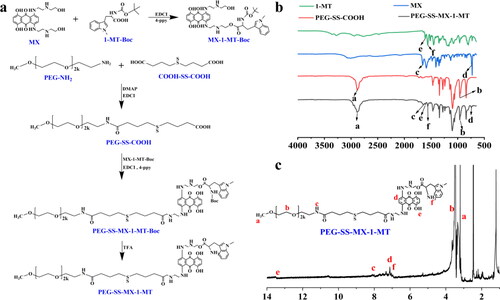
In the FT-IR spectra of PEG-SS-COOH, MX, 1-MT, and PEG-SS-MX-1-MT (), peaks at 2882 cm−1 (a) and 960 cm−1 (b) were characteristic of PEG-SS-COOH, peaks at 1649 cm−1 (c) and 741 cm−1 (d) belonged to MX, and peaks at 1608 cm−1 (e) and 1562 cm−1 (f) were ascribed to 1-MT. Taken together, these results indicated that PEG-SS-MX-1-MT had been synthesized.
3.1.2. Synthesis and characterization of DSPE-PEG-FA
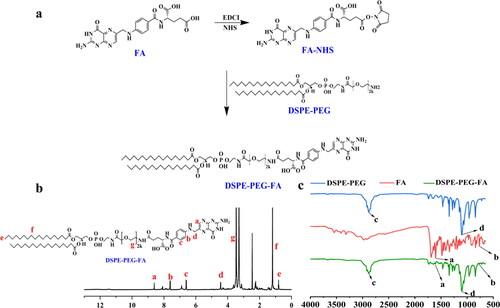
DSPE-PEG-FA was synthesized according to the route shown in . First, FA was activated by NHS, which was then reacted with DSPE-PEG-NH2 to obtain the product: DSPE-PEG-FA. The structure of the products was confirmed by spectroscopy (1H-NMR and FT-IR). As shown in , the characteristic peaks of the benzene ring on FA (a, b, c) and DSPE-PEG-NH2 (e, f, g) appeared in the 1H-NMR spectrum of DSPE-PEG-FA, thereby indicating that FA was attached to DSPE-PEG-NH2. In the FT-IR spectra of DSPE-PEG-FA (), appearance of the characteristic peaks of FA at 1603 cm−1 (a) and 765 cm−1 (b) and DSPE-PEG-NH2 at 2885 cm−1 (c) and 1106 cm−1 (d) demonstrated the synthesis of DSPE-PEG-FA.
Figure 3. (a) Synthetic route of DSPE-PEG-FA (DSPE-PEG-NH2). (b) 1H-NMR spectrum of DSPE-PEG-FA. (c) FT-IR spectra of DSPE-PEG-NH2, FA and DSPE-PEG-FA.
3.2. Characterization of micelles
3.2.1. Size and morphology of PEG-SS-MX-1-MT/FA
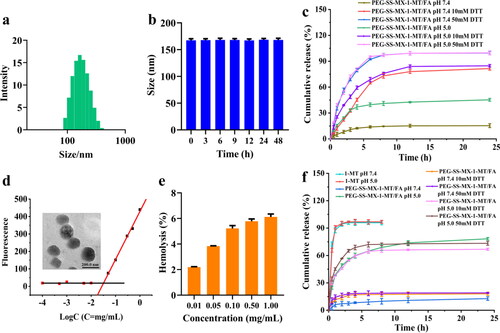
The mean particle size of PEG-SS-MX-1-MT/FA was found to be 169.0 ± 1.6 nm and the particle-size distribution was narrow (Polydispersity Index = 0.208) (). Transmission electron microscopy () showed that PEG-SS-MX-1-MT/FA was a spherical nano-micelle. The moderate particle size and uniform distribution of PEG-SS-MX-1-MT/FA could facilitate accumulation of these micelles in tumor sites due to the enhanced permeability and retention effect (Li et al., Citation2019).
Figure 4. (a) Size of PEG-SS-MX-1-MT/FA. (b) Stability of PEG-SS-MX-1-MT/FA micelles in vitro. (c) Reduction-responsive release of disulfide bonds. (d) Morphology and CMC of PEG-SS-MX-1-MT/FA. (e) Hemolysis of PEG-SS-MX-1-MT/FA. (f) Release of 1-MT in vitro.
3.2.2. CMC Of PEG-SS-MX-1-MT/FA
CMC was calculated using Nile Red as a fluorescent molecule (). The low CMC of 0.0398 mg/mL which was similar to the ones in the reported literatures indicated that PEG-SS-MX-1-MT/FA could: (i) self-assemble readily in aqueous solution and display high stability; (ii) could resist dilution in the blood circulation (Behroozi et al., Citation2018; Fang et al., Citation2021).
3.2.3. Sensitivity of PEG-SS-MX-1-MT/FA to the environment
The release behavior of MX and 1-MT from PEG-SS-MX-1-MT/FA was evaluated under different DTT concentrations and pH conditions. MX release from PEG-SS-MX-1-MT/FA incubated in PBS (pH 7.4) with a DTT concentration (mM) of 0, 10, and 50 was 15.3%, 81.5%, and 99.5%, respectively (). MX release from PEG-SS-MX-1-MT/FA incubated in PBS (pH 5.0) with a DTT concentration (mM) of 0, 10, and 50 was 45.3%, 84.8%, and 99.7%, respectively. These results suggested that MX release was controlled mainly by the breaking of disulfide bonds, and that the release profile of MX displayed high responsiveness to reduction. However, the release profile of 1-MT () was controlled mainly by pH, and DTT had almost no influence on 1-MT release. With a DTT concentration 0, 10, and 50 mM, 1-MT release from PEG-SS-MX-1-MT/FA was <20% at pH 7.4 in 24 h, but was >60% at pH 5.0, which indicated the highly pH-sensitive release of 1-MT. The results shown above suggested that PEG-SS-MX-1-MT/FA could trigger drug release through the cleavage of disulfide bonds and ester bonds if exposed to an acidic tumor environment with overexpression of GSH, thereby enhancing the antitumor effect while reducing damage to normal tissues.
3.2.4. Stability of PEG-SS-MX-1-MT/FA in vitro
The stability of PEG-SS-MX-1-MT/FA was investigated by determining the change in particle size in PBS (pH 7.4) containing 10% FBS after 48-h incubation. The particle size changed slightly (), indicating that PEG-SS-MX-1-MT/FA displayed high stability and could retain its integrity in the blood circulation.
3.2.5. Percent hemolysis of PEG-SS-MX-1-MT/FA
Percent hemolysis of PEG-SS-MX-1-MT/FA at different concentrations was <10% (), which showed that PEG-SS-MX-1-MT/FA had good biocompatibility and could meet the requirements of intravenous administration.
3.3. In vitro cytotoxicity assay
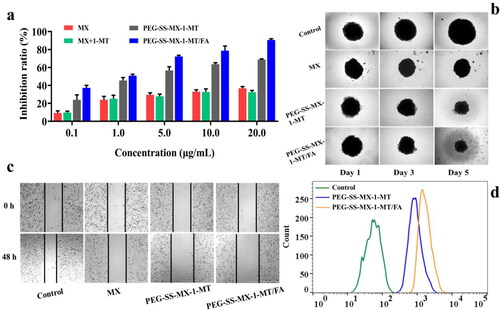
The growth of tumor cells after 48-h incubation with MX, MX + 1-MT, PEG-SS-MX-1-MT, and PEG-SS-MX-1-MT/FA was detected by the MTT assay. MX + 1-MT displayed a similar effect of proliferation inhibition on MCF-7/ADR cells compared with that of MX, indicating that 1-MT had almost no cytotoxicity (). Due to the resistance of MCF-7/ADR cells to MX, the percent inhibition of cell proliferation did not increase with increasing MX concentration, and highest percent inhibition was only 38% at the highest MX concentration (20 μg/mL). Compared with free MX, we found that PEG-SS-MX-1-MT and PEG-SS-MX-1-MT/FA could inhibit the growth of tumor cells. These results demonstrated that PEG-SS-MX-1-MT could prevent the efflux of MX by MCF-7/ADR cells, thereby improving the anticancer effect of MX. In particular, PEG-SS-MX-1-MT/FA with an active targeting ligand had the most potent inhibition on the growth of tumor cells. When the equivalent concentration of MX in PEG-SS-MX-1-MT/FA increased from 0.1 μg/mL to 20.0 μg/mL, the percent inhibition increased from 37.3% to 90.6%, which was much higher than that of MX.
Figure 5. (a) Cell inhibition ratio of MCF-7/ADR cells incubated with different concentrations of MX, MX + 1-MT, PEG-SS-MX-1-MT and PEG-SS-MX-1-MT/FA. (b) Inhibition of proliferation of 3D tumor spheroids. (c) Wound healing assay of MCF-7/ADR cells. (d) Cellular uptake of MCF-7/ADR.
3.4. Inhibition of proliferation of 3D tumor spheroids
The inhibitory effect of cell preparations was evaluated using 3D tumor spheroids (). The volume of tumor spheroids in the control group increased significantly, and the inhibitory effect of free MX on tumor spheroids was limited. Compared with the control group and MX group, the volume of tumor spheroids treated with PEG-SS-MX-1-MT and PEG-SS-MX-1-MT/FA decreased significantly, thereby indicating the robust ability of PEG-SS-MX-1-MT and PEG-SS-MX-1-MT/FA to inhibit cell proliferation.
3.5. Wound healing
A wound-healing assay was applied to study the migration ability of MCF-7/ADR cells treated with PEG-SS-MX-1-MT/FA. Wound scratches of cells cultured with PBS and MX showed obvious healing, which indicated that the migration ability of cells was strong (). However, when cells were treated in a medium containing PEG-SS-MX-1-MT and PEG-SS-MX-1-MT/FA, the wound areas enlarged. These results suggested that PEG-SS-MX-1-MT and PEG-SS-MX-1-MT/FA (especially active PEG-SS-MX-1-MT/FA) had a strong ability to inhibit cell migration.
3.6. Cell uptake
Cell uptake was analyzed by flow cytometry using C6 as a fluorescent agent. After incubation in a medium for 6 h, the mean fluorescence intensity of cells in the administration group was significantly higher than that in the control group (). The mean fluorescence intensity of the PEG-SS-MX-1-MT/FA group was higher than that of the PEG-SS-MX-1-MT group. Hence, the targeting effect of FA could promote cellular uptake.
3.7. ICD Function of PEG-SS-MX-1-MT/FA
3.7.1. CRT efflux
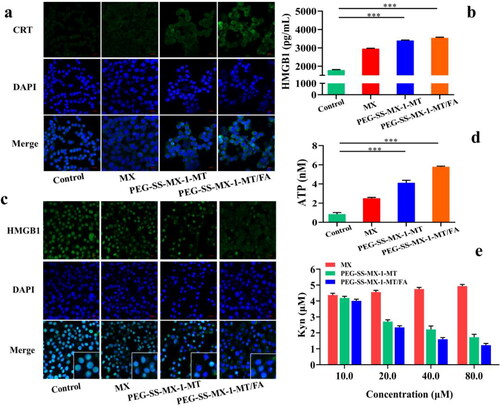
Tumor cells were induced to develop ICD, which caused CRT to “flip” from the endoplasmic reticulum to the membrane surface. CRT efflux from tumor cells after administration of agents was observed by CLSM. Under normal circumstances, almost no CRT was distributed (). After treatment with MX, PEG-SS-MX-1-MT, and PEG-SS-MX-1-MT/FA, the expression of CRT was detected in tumor cells, which indicated that ICD had occurred. The fluorescence signal of CRT in tumor cells treated with PEG-SS-MX-1-MT/FA was the strongest, indicating that PEG-SS-MX-1-MT/FA displayed the highest ability to induce ICD (Huang et al., Citation2020), which resulted from the highest cellular uptake of MX.
Figure 6. (a) CRT efflux detected by immunofluorescent. (b) HMGB1 secretion detected by ELISA test kit. (c) HMGB1 secretion detected by immunofluorescent. (d) ATP release detected by test kit. (e) IDO inhibition of PEG-SS-MX-1-MT/FA. ***p < 0.0001.
3.7.2. HMGB1 secretion
Tumor cells undergoing ICD were stimulated to elicit HMGB1 efflux from nuclei to the outside of the cell. CLSM was used to observe HMGB1 efflux from tumor cells after administration of agents. HMGB1 was located in the nuclei of tumor cells treated with PBS (). However, after treatment with MX, PEG-SS-MX-1-MT, and PEG-SS-MX-1-MT/FA, HMGB1 was secreted from nuclei into the cytoplasm. PEG-SS-MX-1-MT/FA exhibited the highest ability to stimulate tumor cells to excrete HMGB1 (Feng et al., Citation2018).
HMGB1 secretion from cells in different groups was quantified using ELISA kits. HMGB1 content in cell supernatants was measured after administration of agents (). Compared with the control group, the HMGB1 content in cell supernatants (pg/mL) treated with MX, PEG-SS-MX-1-MT, and PEG-SS-MX-1-MT/FA increased from 1800 to 2960, 3404 and 3554, respectively. Hence, MX, PEG-SS-MX-1-MT, and PEG-SS-MX-1-MT/FA could induce ICD. PEG-SS-MX-1-MT/FA was the strongest ICD promoter because it had the highest cellular uptake of MX.
3.7.3. ATP release
A kit was used to measure ATP in the supernatants of drug-treated cells. The ATP concentration in the administration group was significantly higher than that in the control group (0.8 nM). ATP release (nM) in the MX, PEG-SS-MX-1-MT, and PEG-SS-MX-1-MT/FA groups was 2.4, 5.1, and 7.2, respectively (). PEG-SS-MX-1-MT and PEG-SS-MX-1-MT/FA displayed a higher ability to induce ICD than MX, which might have been because: (i) chemical modification could prevent the efflux of PEG-SS-MX-1-MT by MCF-7/ADR cells; (ii) PEG-SS-MX-1-MT/FA could increase cellular uptake with the assistance of FA.
3.8. IDO inhibition
The content of Kyn in cell supernatants was measured to evaluate the inhibition of IDO in preparation groups. The MX group had an increased Kyn content (), which resulted in an increase in IDO level in tumor cells. However, PEG-SS-MX-1-MT and PEG-SS-MX-1-MT/FA preparation groups showed IDO inhibition due to 1-MT addition. The PEG-SS-MX-1-MT/FA group showed stronger inhibition of IDO due to greater uptake by cells (Huang et al., Citation2019).
3.9. Imaging and biodistribution in vivo
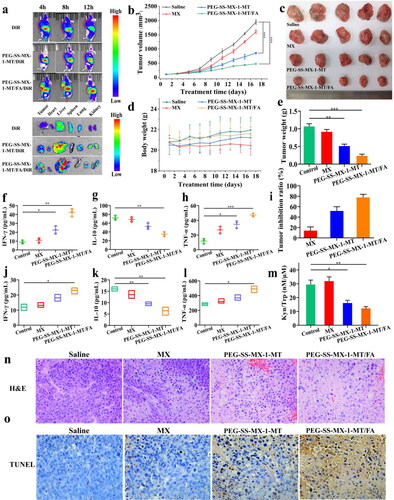
The distribution of DiR-labeled micelles in tumor-bearing nude mice was observed by an in vivo imaging system. Almost no fluorescence signal of free DiR was detected in the tumor site within 12 h (), and the metabolic rate of DiR was very high. The accumulation of PEG-SS-MX-1-MT/DiR micelles in the liver was higher than that in other organs, and their mean fluorescence intensity was higher than that of free DiR at various time points, which suggested that PEG-SS-MX-1-MT micelles were stable in vivo. PEG-SS-MX-1-MT/FA/DiR micelles showed a strong fluorescence signal in tumor tissue, and remained in tumor tissue after 12 h. Hence, PEG-SS-MX-1-MT/FA micelles could deliver the drug to the tumor site and prolong the time the drug remained in tumor tissue.
Figure 7. (a) In vivo distribution of DiR, PEG-SS-MX-1-MT/DiR and PEG-SS-MX-1-MT/FA/DiR. (b) Change of tumor volume. (c) Images of excised tumors. (d) Body weight changes of nude mice in each group. (e) Tumor weight. (f) IFN-γ in serum. (g) IL-10 in serum. (h) TNF-α in serum. (i) Tumor inhibition ratio. (j) IFN-γ in tumor. (k) IL-10 in tumor. (l) TNF-α in tumor. (m) In vivo Kyn to Trp ratio. (n) H&E staining of tumor sections. (o) TUNEL staining of tumor sections. (*p < 0.01, **p < 0.001, ***p < 0.0001, scale bar: 50 μm).
3.10. Antitumor efficacy in vivo
The bodyweight () and tumor volume of nude mice () were measured every other day during the experiment. At the end of the experiment, significant bodyweight loss was not observed in any group of nude mice. As shown in , the tumors of nude mice treated with saline and MX grew much more rapidly than those of treated by micelles. PEG-SS-MX-1-MT/FA had the most significant effect on tumor inhibition (), which might have been because it could target the tumor and increase MX accumulation in the tumor site, thereby improving the anti-tumor effect.
3.11. Inhibitory effect of IDO in vivo
The ratio of Kyn: Trp in the tumors of nude mice treated with MX alone was higher than that of saline group, which suggested that MX could cause the up-regulation of IDO (). However, PEG-SS-MX-1-MT and PEG-SS-MX-1-MT/FA groups inhibited the metabolism of Trp and Kyn production significantly. Also, the ratio of Kyn:Trp in the PEG-SS-MX-1-MT/FA group was only 41% that of the saline group. Hence, PEG-SS-MX-1-MT/FA could inhibit IDO and regulate the immunosuppressive environment in vivo.
3.12. Immunomodulatory effect
After administration of agents, the contents of the cytokines IFN-γ, TNF-α, and IL-10 in serum and tumors were determined using ELISA kits. The contents of IFN-γ () and TNF-α () in PEG-SS-MX-1-MT and PEG-SS-MX-1-MT/FA groups were significantly higher than those of the other groups. However, the IL-10 () content decreased. These results suggested an effective anti-tumor immune response.
3.13. Histopathology
The paraffin sections of tumor tissues were stained by H&E, and the results were shown in . The morphology and biological structure of tumor cells treated with saline were good. In MX group, a few tumor cells were deformed and slightly damaged, while in PEG-SS-MX-1-MT group, some cell necrosis occurred. However, in PEG-SS-MX-1-MT/FA group, the number of tumor cells decreased, the morphology changed obviously, and the degree of cell necrosis was high.
To further evaluate the efficacy of PEG-SS-MX-1-MT/FA, tumor tissues in each group were stained by TUNEL and observed (). Cells in the saline group were dyed blue, brown cells appeared in MX and PEG-SS-MX-1-MT groups, and the number of brown cells in the PEG-SS-MX-1-MT/FA group was the greatest. Hence, PEG-SS-MX-1-MT/FA had a stronger ability to induce the apoptosis of tumor cells.
4. Conclusions
The prodrug PEG-SS-MX-1-MT was synthesized by conjugating MX, 1-MT, and PEG using an acidic-responsive ester bond and GSH-responsive disulfide bond. This strategy could accelerate drug release at the tumor site while reducing accumulation of the drug in normal cells. The polymer DSPE-PEG-FA was also synthesized and introduced to form the active targeting micelles PEG-SS-MX-1-MT/FA. This system could improve cellular uptake of MX by drug-resistant MCF-7/ADR cells, thus enhancing the cytotoxicity and ICD of MX. Targeted delivery of 1-MT could also inhibit IDO activity in the immunosuppressive tumor environment, resulting in an enhanced chemo-immunotherapy. In vivo studies showed that PEG-SS-MX-1-MT/FA could target and accumulate at a tumor site to have an anti-tumor role while simultaneously activating the immune response of the body.
Disclosure statement
No potential conflict of interest was reported by the author(s).
Additional information
Funding
References
- An J, Peng C, Tang H, et al. (2021). New advances in the research of resistance to neoadjuvant chemotherapy in breast cancer. IJMS 22:1.
- Behroozi F, Abdkhodaie M, Abandansari H, et al. (2018). Engineering folate-targeting diselenide-containing triblock copolymer as a redox-responsive shell-sheddable micelle for antitumor therapy in vivo. Acta Biomater 76:239–12.
- Chen D, Yu Q, Huang X, et al. (2020). A highly-efficient type I photosensitizer with robust vascular-disruption activity for hypoxic-and-metastatic tumor specific photodynamic therapy. Small 16:2001059.
- Di Donato M, Giovannelli P, Migliaccio A, et al. (2022). Inhibition of Vps34 and p110δ PI3K impairs migration, invasion and three-dimensional spheroid growth in breast cancer cells. IJMS 23:9008.
- Dudek A, Garg A, Krysko D, et al. (2013). Inducers of immunogenic cancer cell death. Cytokine Growth Factor Rev 24:319–33.
- Evison B, Sleebs B, Watson K, et al. (2016). Mitoxantrone, more than just another topoisomerase II poison. Med Res Rev 36:248–99.
- Fang Y, Wang K, Li Q, et al. (2021). pH responsive release of paclitaxel by self-assembling Chitosan-ethyl vanillin@GNRs nanocomposites. Int J Pharm 607:121047.
- Feng B, Zhou F, Hou B, et al. (2018). Binary cooperative prodrug nanoparticles improve immunotherapy by synergistically modulating immune tumor microenvironment. Adv Mater 30:1803001.
- Fronik P, Poetsch I, Kastner A, et al. (2021). Structure-activity relationships of triple-action platinum(IV) prodrugs with albumin-binding properties and immunomodulating ligands. J Med Chem 64:12132–51.
- Granja A, Lima-Sousa R, Alves C, et al. (2021). Mitoxantrone-loaded lipid nanoparticles for breast cancer therapy - Quality-by-design approach and efficacy assessment in 2D and 3D in vitro cancer models. Int J Pharm 607:121044.
- Günther J, Däbritz J, Wirthgen E. (2019). Limitations and off-target effects of tryptophan-related IDO inhibitors in cancer treatment. Front Immunol 10:1801.
- Guo X, Cheng Y, Zhao X, et al. (2018). Advances in redox-responsive drug delivery systems of tumor microenvironment. J Nanobiotechnol 16:74.
- Han X, Cheng K, Xu Y, et al. (2020). Modularly designed peptide nanoprodrug augments antitumor immunity of PD-L1 checkpoint blockade by targeting indoleamine 2,3-dioxygenase. J Am Chem Soc 142:2490–6.
- Henriques B, Mendes F, Martins D. (2021). Immunotherapy in breast cancer: when, how, and what challenges? Biomedicines 9:1687.
- Huang G, Tao A, Miyazaki T, et al. (2019). PEG-poly(1-Methyl-l-Tryptophan)-based polymeric micelles as enzymatically activated inhibitors of indoleamine 2,3-dioxygenase. Nanomaterials 9:719.
- Huang F-Y, Wang J-Y, Dai S-Z, et al. (2020). A recombinant oncolytic Newcastle virus expressing MIP-3α promotes systemic antitumor immunity. J Immunother Cancer 8:e000330.
- Kepp O, Sauvat A, Leduc M, et al. (2019). A fluorescent biosensor-based platform for the discovery of immunogenic cancer cell death inducers. OncoImmunology 8:1606665.
- Kim M, Lee J, Kim W, et al. (2022). Aptamer-conjugated nano-liposome for immunogenic chemotherapy with reversal of immunosuppression. J Controlled Release 348:893–910.
- Lan Y, Liang Q, Sun Y, et al. (2020). Co-delivered chemotherapeutic doxorubicin via a dual-functional immunostimulatory polymeric prodrug for breast cancer immunochemotherapy. ACS Appl Mater Interfaces 12:31904–21.
- Li B, Cai M, Lin L, et al. (2019). MRI-visible and pH-sensitive micelles loaded with doxorubicin for hepatoma treatment. Biomater Sci 7:1529–42.
- Li G, Gao Y, Gong C, et al. (2019). Dual-blockade immune checkpoint for breast cancer treatment based on a tumor-penetrating peptide assembling nanoparticle. ACS Appl Mater Interfaces 11:39513–24.
- Li H, Li Y, Ao H, et al. (2018). Folate-targeting annonaceous acetogenins nanosuspensions: significantly enhanced antitumor efficacy in HeLa tumor-bearing mice. Drug Delivery 25:880–7.
- Li Y, Lin J, Yang X, et al. (2015). Self-assembled nanoparticles based on amphiphilic anticancer drug-phospholipid complex for targeted drug delivery and intracellular dual-controlled release. ACS Appl Mater Interfaces 7:17573–81.
- Li Q, Liu J, Fan H, et al. (2021). IDO-inhibitor potentiated immunogenic chemotherapy abolishes primary tumor growth and eradicates metastatic lesions by targeting distinct compartments within tumor microenvironment. Biomaterials 269:120388.
- Li C, Sun H, Wei W, et al. (2020). Mitoxantrone triggers immunogenic prostate cancer cell death via p53-dependent PERK expression. Cell Oncol 43:1099–116.
- Mei K, Liao Y, Jiang J, et al. (2020). Liposomal delivery of mitoxantrone and a cholesteryl indoximod prodrug provides effective chemo-immunotherapy in multiple solid tumors. ACS Nano 14:13343–66.
- Retecki K, Seweryn M, Graczyk-Jarzynka A, et al. (2021). The immune landscape of breast cancer: strategies for overcoming immunotherapy resistance. Cancers 13:6012.
- Selvan S, Dowling J, Kelly W, et al. (2016). Indoleamine 2,3-dioxygenase (IDO): biology and target in cancer immunotherapies. CCDT 16:755–64.
- Tsao H, Cheng H, Kuo C, et al. (2022). Dual-sensitive gold-nanocubes platform with synergistic immunotherapy for inducing immune cycle using NIR-mediated PTT/NO/IDO. Pharmaceuticals 15:138.
- Turubanova V, Balalaeva I, Mishchenko T, et al. (2019). Immunogenic cell death induced by a new photodynamic therapy based on photosens and photodithazine. J Immunother Cancer 7:350.
- Wang Y, Cai D, Wu H, et al. (2018). Functionalized CuBiS nanoparticles for dual-modal imaging and targeted photothermal/photodynamic therapy. Nanoscale 10:4452–62.
- Wang Y, Luo C, Zhou S, et al. (2021). Investigating the crucial roles of aliphatic tails in disulfide bond-linked docetaxel prodrug nanoassemblies. Asian J Pharm Sci 16:643–52.
- Yang Z, Cheng R, Zhao C, et al. (2018). Thermo- and pH-dual responsive polymeric micelles with upper critical solution temperature behavior for photoacoustic imaging-guided synergistic chemo-photothermal therapy against subcutaneous and metastatic breast tumors. Theranostics 8:4097–115.
- Yang Y, Li Y, Chen K, et al. (2020). Dual receptor-targeted and redox-sensitive polymeric micelles self-assembled from a folic acid-hyaluronic acid-SS-vitamin e succinate polymer for precise cancer therapy. Int J Nanomed 15:2885–902.
- Yang Z, Luo X, Lin Y, et al. (2022). Tandem chemoimmunotherapy by a cascade-responsive molecular prodrug. ACS Chem Biol17:762–7.
- Zhang D, Zhang J, Li Q, et al. (2019). Cold to hot: rational design of a minimalist multifunctional photo-immunotherapy nanoplatform toward boosting immunotherapy capability. ACS Appl Mater Interfaces 11:32633–46.
- Zhang H, Zhang J, Li Q, et al. (2020). Site-specific MOF-based immunotherapeutic nanoplatforms via synergistic tumor cells-targeted treatment and dendritic cells-targeted immunomodulation. Biomaterials 245:119983.
- Zhou F, Feng B, Yu H, et al. (2019). Tumor microenvironment-activatable prodrug vesicles for nanoenabled cancer chemoimmunotherapy combining immunogenic cell death induction and CD47 blockade. Adv Mater 31:1805888.
- Zhou H, Forveille S, Sauvat A, et al. (2016). The oncolytic peptide LTX-315 triggers immunogenic cell death. Cell Death Dis 7:e2134.
- Zhou Y, Ren X, Hou Z, et al. (2021). Engineering a photosensitizer nanoplatform for amplified photodynamic immunotherapy via tumor microenvironment modulation. Nanoscale Horiz 6:120–31.
- Zhou S, Shang Q, Wang N, et al. (2020). Rational design of a minimalist nanoplatform to maximize immunotherapeutic efficacy: four birds with one stone. J Control Release 328:617–30.
- Zhou J, Wang G, Chen Y, et al. (2019). Immunogenic cell death in cancer therapy: present and emerging inducers. J Cell Mol Med 23:4854–65.