
Abstract
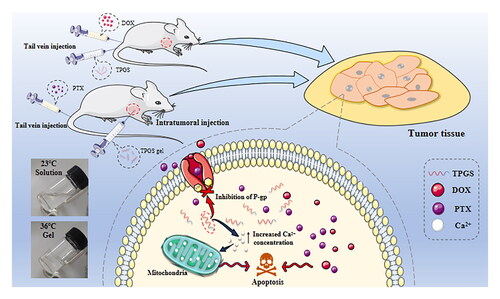
D-alpha-tocopheryl polyethylene glycol 1000 succinate (TPGS) is a commonly used nonionic surfactant used as a pharmaceutical carrier in different drug delivery systems. TPGS can reverse P-glycoprotein (P-gp)-mediated multidrug resistance (MDR) and also has anticancer activities. It suggests that when designing antitumor drug preparation, it’s necessary to take into account the antitumor activity of TPGS. Our in vivo studies showed that TPGS exerted the strongest cytotoxicity in MCF-7-ADR cells when compared with seven other tumor cell lines. The further study revealed TPGS caused apoptosis and blocked MCF-7 cell growth in G2/M phase. Mechanistic insights suggested that TPGS increased intracellular calcium ion concentrations, leading to apoptosis via the mitochondrial pathway. Furthermore, two in vivo experiments were performed. One was TPGS, and DOX solution was administered by tail vein injection on MCF-7-ADR tumor bearing nude mice. The other was temperature sensitive TPGS gel (TPGS-TG) was administered by intratumoral injection on MCF-7-ADR tumor bearing nude mice combined with paclitaxel albumin nanoparticles (Abraxane®) administered by tail vein injection. The findings confirmed that TPGS could play its role in anti-tumor to reduce the toxicity of chemotherapeutic drugs and improve the efficiency of drug-resistant tumors, thereby enhancing the development of safe oncology therapeutics.
1. Introduction
Global cancer statistics show that breast cancer is the most common cancer in the world and the leading cause of death among women, accounting for 24.2% (2.2 million) of new cases and more than 609,360 deaths per year (Siegel et al., Citation2022). The disease has the second highest mortality rate, accounting for approximately 14% of all female cancer deaths. Currently, treatment regimens mainly include chemotherapy, surgical resection, radiotherapy and immunotherapy, or combinations thereof (Vincze et al., Citation2022). However, these methods damage normal adjacent tissue, while their clinical applications have many limitations. Therefore, the exploration of safe and effective breast cancer treatment strategies is warranted.
D-alpha-tocopheryl polyethylene glycol 1000 succinate (TPGS) is a water-soluble natural vitamin E derivative composed of vitamin E succinate and polyethylene glycol (PEG) 1000 by esterification, which makes it amphiphilic (Z. Zhang et al., Citation2012; Pawar et al., Citation2014). As a nonionic surfactant, TPGS is used as a solubilizer, emulsifier, dispersant agent, and gelling agent (Pawar et al., Citation2014; Rathod et al., Citation2021). Due to its amphiphilic nature and water solubility, TPGS was identified as a P-glycoprotein (P-gp) inhibitor, which was used in combination with anti-tumor drugs to reverse multidrug resistance (MDR) in tumors, and to escape rapid recognition and elimination by the human immune system to prolong in vivo circulation (Dintaman & Silverman, Citation1999; Kumbhar et al., Citation2022). In vitro studies indicated that TPGS selectively induced G1-phase cell cycle arrest and caspase-dependent and independent apoptotic cell death in breast cancer cells without significantly affecting normal cell survival rates (Neophytou et al., Citation2014). Currently, TPGS is mainly used as a drug carrier in drug delivery systems to promote hydrophobic drug bioavailability, improve MDR, and enhance anti-tumor drug targeting (Varma & Panchagnula, Citation2005; Jin et al., Citation2017; Yang et al., Citation2016). For example, the DOX-loaded TPGS2000 micelles could overcome MDR in breast cancer treatment (Hao et al., Citation2015). Likewise, it was reported that the TPGS1000-functionalized polydopamine-coated mesoporous silica nanoparticles (NPs) was prepared for sustainable and pH-responsive delivery of DOX (Cheng et al., Citation2017). As mentioned above, in previous studies TPGS was used as a carrier to prepare drug-loaded nanoformulations. Our present study focused on investigating the antitumor activities of TPGS itself at the mechanistic level and the synergistic effects of TPGS with conventional antineoplastic drugs. To sum up, this research provided a new idea for the rational application of TPGS in oncology settings, multi-channel administration.
Doxorubicin (DOX) is a broad-spectrum anthracycline anticancer drug with a wide range of effects in different tumors (Gewirtz, Citation1999; Agudelo et al., Citation2016; Kanwal et al., Citation2018). However, its clinical application is limited by several factors. Firstly, DOX has poor solubility and low bioavailability. Secondly, DOX has a short half-life, poor tissue distribution, strong toxic side effects, and displays MDR. Its toxicity in normal tissues is considerable, especially cardiotoxicity and nephrotoxicity, which impact its clinical application (Blum & Carter, Citation1974; Bhagat & Kleinerman, Citation2020). Paclitaxel (PTX) is a popular chemotherapeutic drug for breast cancer treatment. However, PTX treatment is also associated with severe adverse effects (Luo et al., Citation2000; Wang et al., Citation2000). To increase antitumor efficacy and overcome these side effects, DOX and PTX have been combined with other anticancer drugs with different action mechanisms to great effect (Fu et al., Citation2015; Jia et al., Citation2015; Ruttala & Ko, Citation2015).
Thermosensitive gel (TG) is a formulation used for the intratumoral administration of therapeutic drugs (Ren et al., Citation2021). After tumor injection, TG rapidly changes from a liquid to a semi-solid state and prolongs drug release time to avoid repeated administration (Rahman et al., Citation2013; Bujňáková et al., Citation2017; Yu et al., Citation2019). In this study, we firstly reveal the inhibition selectivity of TPGS on tumor lines and preliminary explorate how TPGS caused tumor cell apoptosis which have not been reported. In terms of investigating the effects of combined medications of TPGS and chemotherapy drugs, we performed tail vein injections with combined TPGS and DOX, and also assessed the effects of TPGS-TG intratumoral injections combined with PTX albumin nanoparticles (nab-PTX, Abraxane®) administered by tail vein injection to treat breast cancer tumors. Furthermore, tumor-inhibitory effects and the effects on different organs were also evaluated.
2. Materials and methods
2.1. Materials
TPGS was purchased from Haimen Huiju Pharmaceutical Co., Ltd (Haimen, China). DOX was purchased from Dalian Meilun Biotech Co., Ltd (Dalian, China). Abraxane® was purchased from Shiyao Group Ouyi Pharmaceutical Co., Ltd (Shijiazhuang, China). Chlorpromazine hydrochloride and verapamil were purchased from Aladdin Scientific Inc. (Shanghai, China). Dulbecco’s modified Eagle’s Medium (DMEM), phosphate buffered saline (PBS), Roswell Park Memorial Institute-1640 (RPMI-1640), trypsin, and penicillin-streptomycin solution were purchased from Jinuo Biotech Co., Ltd (Hangzhou, China). Fetal bovine serum (FBS) was purchased from Gibco (Grand Island, NY, USA). A cytochrome C primary antibody was purchased from ABclonal Technology Co., Ltd (Wuhan, China). A β-actin antibody was purchased from Santa Cruz Biotechnology Co., Ltd (USA). Hematoxylin and eosin (H&E) were obtained from Guge Biotechnology Co., Ltd (Wuhan, China). Polyethylene-polypropylene glycol 407 (PL407) and polyethylene-polypropylene glycol 188 (PL188) were purchased from BASF Co., Ltd (Germany). All other reagents and chemicals were analytical grade.
2.2. Cell lines and animals
Human lung cancer cells (A549), human breast cancer cells (MCF-7), human liver cancer cells (HepG2), human cervical cancer cells (Hela), human colon cancer cells (HCT116), and human prostate cancer cells (PC-3M) were obtained from the cell bank of the Chinese Academy of Sciences (Shanghai, China). DOX resistant breast cancer cells (MCF-7-ADR) were obtained from Nanjing Kaiji Biotech Co., Ltd (Nanjing, China). HepG2, Hela, and HCT116 cells were cultured in DMEM plus 10% FBS. A549, PC-3M, MCF-7, and MCF-7-ADR were cultured in RPMI1640 plus 10% FBS and 1% penicillin-streptomycin solution at 5% CO2 and 37 °C.
Female BALB/c nude mice (4–5 weeks old and 18–20 g) were obtained from Shanghai Slack Laboratory Animal Research Center (Shanghai, China). Animal studies were conducted in accordance with protocols evaluated and approved by the Ethics Committee of Zhejiang University of Technology (Hangzhou, China). (Approval No. 20190304039).
2.3. TPGS in vitro assays
2.3.1. Cytotoxicity assays
TPGS-mediated cytotoxicity in different cell lines was detected using the 3-(4,5-dimethylthiazol-2-yl)-2,5-diphenyl-2H-tetrazolium bromide (MTT) assay. Briefly, cells were seeded in 96-well plates (5 × 10³ cells/well) and incubated overnight at 37 °C in 5% CO2. TPGS was diluted at gradient concentrations (25, 50, 100, 200, 400, 800 µg/mL) in complete medium and added to wells. After 24 h and 48 h incubation, the medium was replaced with 20 μL MTT solution (5 mg/mL) and cells cultured for another 4 h. The MTT solution was then removed, dimethyl sulfoxide added, and plates shaken for 10 min at 37 °C. Plate absorbance at 490 nm was measured using a microplate reader (BIO-RAD iMark, USA). Each experimental group included three parallel groups.
2.3.2. Apoptosis assays
Fluorescein isothiocyanate (FITC)-annexin V/propidium iodide (PI) staining was used to quantitate apoptosis. MCF-7-ADR cells were incubated with different TPGS concentrations (16, 80, and 400 µg/mL) for 48 h. Untreated cells were used as controls. Cells were then washed twice in cold PBS, detached using trypsin, and resuspended at 1 × 10⁶ cells/mL. Cell suspensions were stained with FITC-annexin V for 15 min at 4 °C in the dark, and PI added to wells for 5 min under the same conditions. Stained cells were analyzed by flow cytometry (Becton Dickinson, USA).
2.3.3. Mitochondrial membrane potential assays
Mitochondrial membrane potential was investigated using the JC-1 fluorescent dye method. MCF-7-ADR cells were treated with 16, 80, and 400 µg/mL TPGS for 48 h. A blank group was also established. After 48 h, cells were collected in 1.5 mL centrifuge tubes. For each group, 1 mL buffer plus 2 µL JC-1 solution were added to cell and incubated in a 5% CO2 incubator according to kit instructions for 20 min. Then, cells were centrifuged at 2,000 rpm for 5 min and supernatants discarded and washed in PBS. JC-1 fluorescence intensity was measured by flow cytometry (Excitation = 488 nm and Emission = 530 nm). FITC green fluorescence was measured in the FL1 channel while PI red fluorescence was detected in the FL2 channel.
2.3.4. Cytochrome C Western blotting
To explore TPGS-induced apoptosis, MCF-7-ADR cells were incubated with different TPGS concentrations (16, 80, and 400 µg/mL) for 48 h. Cells were lysed for 1 h after washing twice in cold PBS and supernatants collected by centrifugation at 12,000 rpm for 30 min at 4 °C. Total protein concentrations were determined using the bicinchoninic acid method. Samples were mixed with 4 × loading buffer (1:3), denatured by boiling for 10 min, and stored at −20 °C. After electrophoresis on 15% sodium dodecyl sulfate-polyacrylamide gels, the glue was removed, and appropriate size paper and film were cut with filter papers on top and bottom, then we used a semi-dry transmembrane system to transfer proteins to membranes at 20 V. Transfer time was adjusted according to protein size. After staining membranes in Ponceau stain for 2 min, rinsing in distilled water, and observing protein bands, the transfer was deemed efficient. Membranes were then washed in PBS, blocked for 1 h in 3% bovine serum albumin, and rewashed in PBS. A cytochrome C primary antibody was diluted in PBS plus Tween 20 (PBST) to a working concentration, added to membranes, incubated overnight at 4 °C, and the next day washed three times in PBST for 5 min each. A secondary antibody was diluted in PBST and added to washed membranes, then incubated in the dark for 1 h and washed in PBST three times for 5 min in the dark. Membranes were finally washed three times in Tris Buffered Saline plus Tween 20. Protein band intensities were determined using the Odyssey near-infrared fluorescence scanning imaging system.
2.3.5. Intracellular calcium (Ca2+) detection
To investigate the effects of TPGS on intracellular Ca2+ levels, MCF-7-ADR cells were inoculated into 6-well plates (1 × 10⁶ cells/well) and cultured in medium containing different TPGS concentrations (16, 80, and 400 µg/mL) for 48 h. Cells were then centrifuged at 8000 rpm at 4 °C for 5 min and washed twice in cold PBS. Next, the fluorescent fluo-3 AM probe was diluted in PBS (1:1000), added to cells, and incubated at 37 °C for 0.5 h before washing twice in PBS. Fluorescence at 528 nm was determined by flow cytometry in the FL1 channel.
2.3.6. Cell cycle assays
MCF-7-ADR cells were harvested using trypsin after exposure to gradient TPGS concentrations (16, 80, and 400 µg/mL) for 48 h. After washing twice in cold PBS, cells were fixed in 70% ethanol and stored at 4 °C for 12 h. Then, after rinsing in cold PBS, cells were PI stained for 10 min and fluorescence intensity measured using a flow cytometry.
2.3.7. In vitro TPGS cell uptake assays
To evaluate TPGS cell uptake efficiency, MCF-7-ADR cells were seeded into 24-well plates at 1 × 10⁵ cells/well. After incubation at 37 °C for 24 h, cells were treated with complete medium containing different TPGS concentrations (0.5, 1, 2, and 4 mg/mL) for 1, 2, 4, 6, and 8 h. Then, 0.5% lauryl sodium sulfate was added and then lysed in a cell incubator for 5 min and collected in a centrifuge tube. After processing cells in methanol and centrifuging at 10,000 rpm for 10 min, cell supernatants were analyzed using high performance liquid chromatography (HPLC) (Agilent 1200, Agilent Technologies, Santa Clara, CA, USA) to determine TPGS levels. HPLC analyses were performed at 284 nm using a 1 mL/min flow rate. The mobile phase was consisted of methanol and 10 mM phosphoric acid in a 97:3 (v/v) ratio.
The effects of inhibitors (verapamil, sodium amide, chlorpromazine, and indomethacin) were also investigated. Verapamil is a P-gp efflux inhibitor, and sodium azide is an ATP inhibitor. Both chlorpromazine and indomethacin are endocytosis inhibitors, chlorpromazine is involved in clathrin-mediated endocytosis, and indomethacin is involved in caveolin-mediated endocytosis. Inhibitors were simultaneously added with TPGS to cells and co-cultured for 6 h. Other treatments were consistent with the cellular uptake experiments described above.
2.4. In vivo anti-tumor TPGS assays via tail vein injection
MCF-7-ADR tumor-bearing female nude mice were used to study the in vivo effects of TPGS. When the tumor volume reached approximately 100–120 mm3, mice were randomly divided into six groups (n = 6): (a) normal saline group (Control); (b) 7.5 mg/kg DOX group (DOX); (c) 262.5 mg/kg TPGS group (High TPGS); (d) 131.25 mg/kg TPGS (Low TPGS); (e) 262.5 mg/kg TPGS combined with 7.5 mg/kg DOX (DOX-High TPGS); and (f) 131.25 mg/kg TPGS combined with 7.5 mg/kg DOX (DOX-Low TPGS). All treatments were administered via tail vein injection once on days 1, 4, 7, 10, and 13. Body weights and tumor sizes were measured every 2 days. On day 14, mice were humanely sacrificed, tumor tissue and main organs (liver, spleen, lung, and kidney) immediately collected, and stained for pathological analysis using H&E.
2.5. In vivo antitumor TPGS-TG assay via intratumoral injection
2.5.1. TPGS-TG preparation and characterization
We incubated 20 g PL407, 4 g PL188, 10 mL PBS, and 65 mL normal saline at 4 °C for 24 h. Then, 25 mL 0.15 g/mL TPGS in normal saline solution was added and mixed for 5 min to generate a clear and transparent low-dose TPGS-TG solution (Akkari et al., Citation2016). High-dose TPGS-TG was prepared using 40 mL normal saline and 50 mL 0.15 g/mL TPGS in normal saline solution. Other conditions were unchanged.
The TPGS-TG gelation temperature was determined as follows: 5 mL TPGS-TG solution was heated in a tube from 25 °C to 45 °C in a water bath at approximately 1 °C/min. When the temperature had risen by 1 °C, it was held for 15 min. A gel was formed when the TPGS-TG did not flow to the mouth of the tube within 30 s at a certain temperature, when the tube was tilted at 180 °C. The corresponding temperature was recorded as the gelation temperature.
Next, the morphology of freeze-dried TPGS-TG and blank TG powders were observed using scanning electron microscopy (SEM, SU8010, Hitachi, Japan).
2.5.2. In vitro TPGS release profiles
TPGS release rates from TG in vitro were determined by dialysis, 3 mL TPGS-TG aqueous solution containing 0.15 mg/mL TPGS was added to a dialysis bag and immersed in 100 mL PBS (pH 6.5) at 37 °C and 100 rpm (THZ-82 Thermostatic Oscillator: Shunhua Instrument Co., Ltd, Jintan, China). At predetermined times, 3 mL release medium was taken for HPLC assay, followed by replenishment with an equal volume of fresh medium. TPGS release was conducted under the same conditions as TPGS-TG.
2.5.3. In vivo anti-tumor TPGS-TG assays via intratumoral injection
In vivo anti-tumor TPGS-TG assays were performed in MCF-7 tumor-bearing nude mice. When the tumor volume reached approximately 100–120 mm3, mice were randomly assigned to six groups (n = 6): (a) normal saline group (Control); (b) 375 mg/kg TPGS-TG (High TPGS TG); (c) 15 mg/kg Abraxane® (Abraxane); (d) blank TG combined with 15 mg/kg Abraxane® (Blank TG-Abraxane); (e) 375 mg/kg TPGS-TG combined with 15 mg/kg Abraxane® (High TPGS TG-Abraxane); and (f) 187.5 mg/kg TPGS-TG combined with 15 mg/kg Abraxane® (Low TPGS TG-Abraxane). Blank TG and TPGS-TG were administrated twice via intratumoral injection. Concurrently, Abraxane® was administrated by tail vein injection on days 1, 4, 7, 10, and 13. Body weights and tumor sizes were measured every 2 days. On day 14, mice were humanely sacrificed, and tumor tissue and main organs (liver, spleen, lung, and kidney) immediately sectioned and stained with H&E to assess tissue toxicity.
2.6. Statistical analysis
All data are presented as means ± standard deviations. Statistical analysis was performed by Student’s t-test for two groups, and one-way ANOVA for multiple groups with using GraphPad Prism 8. A value of p < 0.05 were considered statistically significant. Error bars indicate standard deviation.
3. Results and discussion
3.1. In vitro assays
3.1.1. In vitro cytotoxicity and apoptosis assays
To systematically determine in vitro TPGS cytotoxicity in different cancer cell lines, HepG2, A549, MCF-7, MCF-7-ADR, HeLa, HCT116, and PC-3M were cultured with TPGS for 24 h and 48 h. Our MTT assays showed that TPGS cytotoxicity was more evident in all tested cells with the increase of its concentration. TPGS cytotoxicity in MCF-7-ADR cells was the strongest, except for HCT116 cells, the half maximal inhibitory concentration (IC50) of MCF-7-ADR () was 153.97 μg/mL at 24 h and 83.65 μg/mL at 48 h. Higher TPGS inhibition rates of HCT116 cells at 48 h may have been due to a lack of sufficient growth space and nutrients due to rapid cell division and growth rates, rather than the high sensitivity to HCT116 cells. In summary, TPGS cytotoxicity at different concentrations was investigated in MCF-7-ADR cells. As shown (), TPGS inhibited MCF-7-ADR cell proliferation in a time and concentration dependent manner. Cell viability was 82% when TPGS was at 25 μg/mL, and approximately 8% at higher TPGS concentrations at 48 h.
Figure 1. The in vitro effects of TPGS on apoptosis. (A) Half maximal inhibitory concentrations (IC50) in different cells treated with TPGS at 24 h and 48 h, (B) MCF-7-ADR cell viability in the presence of different TPGS concentrations, (C) the effects of different TPGS concentrations (0, 16, 80, and 400 μg/mL) on MCF-7-ADR cell apoptosis and necrosis, (D) quantitative analysis of MCF-7-ADR cell apoptosis at different TPGS concentrations (n = 3, **p < 0.01, ***p < 0.001).

To further characterize TPGS-mediated cell death, apoptosis was evaluated using flow cytometry. Cells were incubated for 48 h to achieve better wall adhesion and higher stability. As shown (), when compared with blank control cells, TPGS-induced MCF-7-ADR cell necrosis and apoptosis. Dead cells increased significantly with increasing TPGS concentrations. Thus, TPGS exerted greater killing effects in MCF-7-ADR cells, which were higher than the other cell lines. Specific differences in cell uptake efficiencies may have accounted for these observations.
3.1.2. Mechanistic study of TPGS on apoptosis by MCF-7-ADR cells
Several reports have indicated that TPGS selectively induces apoptosis in cancer cells (Guan et al., Citation2020), therefore we used a cytometric approach to investigate such mechanisms. As shown (), significantly increased intracellular Ca2+ levels were observed in MCF-7-ADR cells when compared with controls, and positively correlated with TPGS concentrations. As a key intracellular regulator, Ca2+ concentration changes are closely related to cellular homeostasis (L. Zhang et al., Citation2022). When intracellular Ca2+ concentrations increase in the cytoplasm, Ca2+ intake by the mitochondria is reinforced, so we hypothesized that TPGS causes mitochondrial damage by increasing Ca2+ concentrations. When high Ca2+ levels accumulate in the mitochondrial matrix and overload the system, this impairs mitochondrial function and induces the release of mitochondrial factors which activate cytoplasmic mechanisms resulting in apoptosis (Hajnóczky et al., Citation2006). From our mitochondrial membrane potential results (), TPGS-treated groups had decreased mitochondrial cell membrane potentials and altered mitochondrial membrane permeability in MCF-7-ADR cells when compared with controls. These results indicated that TPGS had no effect on intracellular mitochondria, thus verifying our hypothesis that TPGS caused mitochondrial damage by regulating intracellular Ca2+ levels.
Figure 2. TPGS-induced mitochondrial damage in MCF-7-ADR cells. (A) The effects of different TPGS concentrations (0, 16, 80, and 400 μg/mL) on intracellular Ca2+ levels in MCF-7-ADR cells, (B) relative Ca2+ concentration differences at different TPGS concentrations (0, 16, 80, and 400 μg/mL) in MCF-7-ADR cells, (C) the effects of different TPGS concentrations (0, 16, 80, and 400 μg/mL) on mitochondrial membrane potential, (D) the effects of different TPGS concentrations on mitochondrial cytochrome C release (n = 3, ***p < 0.001).

Cytochrome C expression in the mitochondrial apoptotic pathway was also positively correlated with TPGS concentrations (). In addition to apoptosis, cytochrome C was also associated with MDR mechanisms, previous studies reported that P-gp blocked cytochrome C release and prevented apoptosis in tumor cells, leading us to hypothesize that a crossover mechanism may have existed between MDR inhibition and TPGS-mediated anti-tumor activity (Fantappiè et al., Citation2007).
Overall, these phenomena suggested that TPGS restrained MDR and induced apoptosis at the mitochondrial level in MCF-7-ADR cells. In addition, these conclusions were also proved in the following experimental part where TPGS-TG was combined with chemotherapeutic drugs.
3.1.3. The effects of TPGS on cell cycle distribution of MCF-7-ADR in vitro
PI fluorescence assays show how PI binding is proportional to cellular DNA levels. By measuring PI fluorescence intensity using flow cytometry, DNA levels at each cell cycle phase were determined, and cell percentages at each phase calculated. After treating MCF-7-ADR cells with different TPGS concentrations for 48 h, cell percentages at G2/M phase increased, while S and G0/G1 phase ratios decreased significantly with increasing TPGS concentration when compared with control cells (). This result showed that TPGS blocked G2/M phase, thereby increasing MCF-7-ADR apoptosis and further inhibiting mitosis. However, this finding contrasted with previous studies showing that TPGS arrested nonresistant tumor cells in S phase, therefore we hypothesized this phenomenon was related to MDR mechanisms (Chen et al., Citation2020). However, further investigations are required to clarify this issue.
Figure 3. Cellular experiments. (A) and (B) The effects of different TPGS concentrations (0, 16, 80, and 400 μg/mL) on MCF-7-ADR cell cycle distribution, (C) cellular uptake of different TPGS concentrations (0.5, 1.0, 2.0, and 4.0 mg/mL) in MCF-7-ADR cells, (D) the effects of efflux, ATP, and endocytosis inhibitors on TPGS uptake (n = 3, *p < 0.05, **p < 0.01).

3.1.4. Cell uptake assay
As time and TPGS concentrations increased, TPGS uptake by MCF-7-ADR cells increased, reflecting time and concentration uptake characteristics of TPGS (). TPGS uptake efficiency started to decrease at 6 h, which was possibly caused by gradual cell death and decreased adherent cells. To elucidate the TPGS intracellular uptake pathway, uptake studies were performed by pretreating MCF-7-ADR cells with different inhibitors (). After treating cells with indomethacin and sodium azide, TPGS uptake efficiency in MCF-7-ADR cells was reduced, and showed that TPGS endocytosis may be caveolin-mediated and require ATP. We also observed no significant differences in TPGS uptake after cells were incubated with chlorpromazine or verapamil. Chlorpromazine had no obvious inhibitory effects on uptake, indicating that TPGS endocytosis was not mediated by clathrin. The insignificant effects of the P-gp efflux inhibitor verapamil on uptake was due to the presence of TPGS. TPGS itself is a P-gp efflux inhibitor, and its inhibitory effect on P-gp efflux is much greater than that of verapamil. Under competitive inhibition, the inhibitory effect of verapamil on P-gp efflux was greatly attenuated and thus had no effect on TPGS uptake.
3.2. In vivo anti-tumor TPGS assay via tail vein injection
In nude mice bearing MCF-7-ADR breast cancer tumors, we evaluated TPGS anti-tumor effects in all six groups. When compared with the control group, tumor volumes in treatment groups exhibited different growth rates; tumor growth inhibition was ranked as follows: DOX + high-dose TPGS group > DOX + low-dose TPGS group > DOX group > high-dose TPGS group > low-dose TPGS group (). Tumor suppression effects were more pronounced in the high-dose TPGS group when compared with the low-dose TPGS group, implying that TPGS anti-tumor effects were dose-dependent. We observed statistically significant differences between the DOX + high-dose TPGS treatment group and the DOX group. These results indicated that single tail vein TPGS injections suppressed tumor effects. As a vitamin E derivative, the vitamin E component of the TPGS structure significantly increased microsomal peroxidase activity, which potentially inhibited tumor growth (Youk et al., Citation2005). Therefore, more studies are required to investigate TPGS effects in tumorigenic cell lines and animal models.
Figure 4. In vivo antitumor TPGS and DOX effects in MCF-7-ADR tumor-bearing female nude mice. (A) Tumor volume changes in MCF-7-ADR bearing nude mice after treatment with different formulations, (B) tumor inhibition rates in tumor-bearing mouse groups, (C) tumor weights in tumor-bearing mouse groups at treatment end, (D) MCF-7-ADR tumor-bearing mouse body weight changes during treatments, (E) tumor images at treatment end (n = 6, **p < 0.01).

Inhibition rate data were consistent with tumor volume data (), the DOX + high-dose TPGS inhibition rate was approximately 54.40%, which was significantly higher when compared with high-dose TPGS and DOX groups. Therefore, TPGS and DOX combinations improved anticancer effects. As indicated, (), tumor volume difference was observed between groups. Compared with the control group, the tumor volume of each administration group was reduced, and the DOX + high-dose TPGS group had the most significant effect. The tumor inhibitory effect of the high-dose TPGS group was more obvious than that of the low-dose group, which indicated that the anticancer effect of TPGS was dose-dependent. During treatments, body weights in the DOX treatment group decreased, but body weights in the single TPGS-use group were unaffected ().
After processing and comparing tumor tissue sections, control group sections showed clear staining with intact tumor tissue (). When compared with this group, DOX + high-dose TPGS and DOX + low-dose TPGS groups exhibited the most tumor necrosis, followed by the DOX group, while tumor tissue in low-dose TPGS and high-dose TPGS groups were only partially necrotic. By histologically examining normal tissue sections, including heart, liver, lung, spleen, and kidney, TPGS treatment showed no toxicity in heart and spleen samples from tumor-bearing mice, and reduced DOX toxicity in the heart and spleen. TPGS showed no significant toxicity to the lungs and kidneys, with mild hepatotoxicity. Therefore, TPGS efficacy and toxicity evaluations indicated very little toxicity.
Figure 5. Tissue histology sections from different TPGS treatments. Hematoxylin & Eosin stained tissue images (tumor, heart, liver, spleen, lung, and kidney) of MCF-7-ADR tumor-bearing nude mouse groups. Bars represent 200 µm.

These data showed that TPGS exhibited certain tumor-killing effects and was dose-dependent within a particular range. Also, TPGS was almost nontoxic, and its combination with DOX reduced the side effects of DOX in the heart and spleen and had a synergistic anti-tumor effect.
3.3. In vivo antitumor TPGS-TG assay via intratumoral injection
3.3.1. TPGS-TG characterization and release behaviors
Blank TG, low-dose, and high-dose TPGS-TG reagents were fabricated using a low-temperature method, with gelation temperatures approximately 35 °C, 35 °C, and 36 °C, respectively. After injecting TPGS-TG into tumor sites, which theoretically increased drug retention times and helped maintain local blood concentrations (Tang et al., Citation2020), good local therapeutic effects were observed ().
Figure 6. TPGS-TG characterization. (A) Physical TPGS-TG state at 23 °C and (B) 36 °C, (C) SEM showing blank TG, and (D) TPGS-TG, In vitro TPGS release profiles of TPGS-TG and TPGS solutions at (E) pH 6.5.

We next investigated TPGS-TG and TPGS solution release efficiency in vitro under acidic tumor microenvironment (pH 6.5). As indicated (), TPGS-TG could effectively slow down the release rate of TPGS and the in vitro complete release was up to approximately 9 days. Morphological SEM characterization () showed that TPGS-TG was dense and organized. Compared with the blank TG group, TPGS-TG cavities were reduced and arranged in a skeletal pattern. Changes in gel network density affected its degradation processes, thus providing a structural basis for TPGS to exert a slow-release and long-lasting effects at tumor sites.
3.3.2. In vivo anti-tumor TPGS-TG assay via intratumoral injection
Based on breast cancer characteristics on the body surface, sites are often amenable for local drug administration (Y. Zhang et al., Citation2020). Therefore, administered TPGS-TG to mice via intratumoral injection. As observed (), control animals showed the fastest growth in tumor volume but tumor growth rates were unaffected. Tumor inhibition rates in high-dose TPGS-TG, Abraxane®, blank TG + Abraxane®, low-dose TPGS-TG + Abraxane®, and high-dose TPGS-TG + Abraxane® groups were 37.8%, 49.2%, 57.1%, 69.5% and 85.2%, respectively (). As shown (), tumor weights in the high-dose TPGS-TG + Abraxane® group were 15.9%, 25.6%, and 31.3% of saline control, high-dose TPGS-TG, and Abraxane® groups, respectively. Tumor growth was also inhibited in high-dose TPGS-TG, Abraxane®, blank TG + Abraxane®, and low-dose TPGS-TG + Abraxane® groups, at 62.2%, 50.8%, 42.9%, and 37.5%, respectively. Significant differences were observed when we compared tumor weights in the high-dose TPGS-TG + Abraxane® group with the Abraxane® group. Furthermore, when we compared the low-dose TPGS-TG + Abraxane® group with the high-dose TPGS-TG + Abraxane® group, TPGS better inhibited tumor growth as TPGS doses increased, thus significant synergistic effects for TPGS and Abraxane® were observed.
Figure 7. In vivo antitumor effects of TPGS-TG and Abraxane® in MCF-7-ADR tumor-bearing female nude mice. (A) Changes in tumor volumes during treatment in tumor-bearing mouse groups, (B) tumor inhibition rates in tumor-bearing mouse groups, (C) tumor weights in tumor-bearing mouse groups, (D) relative body weight changes in tumor-bearing mouse groups during treatments, and (E) tumor anatomy in tumor-bearing mouse groups. Error bars indicate standard deviation (n = 5, *p < 0.05, ***p < 0.001).

When observing tumors and major organs in sections, control sections displayed the tumor cells had large and deeply stained nuclei, less cytoplasm, and high cell density, all of which indicated that the tumor cells were proliferating continuously (). After treatments, tumor tissues exhibited varying degrees of necrosis, nuclear fragmentation, nuclear perforation, nuclear lysis, and reduced tumor cell numbers. Tumor cells in Abraxane® and blank TG + Abraxane® groups shrank, and had smaller nuclei and lighter staining, while tumor tissue necrosis was not evident in the high-dose TPGS-TG group. Low-dose TPGS-TG + Abraxane® and high-dose TPGS-TG + Abraxane® groups showed the most tumor cell death, with large cell necrosis areas, significant nuclear atrophy, and increased cytoplasm when compared with other groups, the high-dose TPGS-TG + Abraxane® group showed the strongest anti-tumor effects.
Figure 8. TPGS-TG histology in different tissue. Hematoxylin & Eosin stained tissue images (tumor, heart, liver, spleen, lung, and kidney) in different MCF-7 tumor-bearing nude mice groups. Bars represent 200 µm.

In control and high-dose TPGS-TG groups, myocardial fibers were relatively regular, no myocardial fibers were disrupted and cell gaps were normal. Some myocardial fibers in Abraxane® and blank TG + Abraxane® groups were deformed and swollen. In low-dose TPGS-TG + Abraxane® and high-dose TPGS-TG + Abraxane® groups, vacuolar deformation and myocardial fibers, disorganized cardiomyocytes, sarcoplasmic lysis, and some fiber breaks were observed. H&E staining showed that Abraxane® exerted cardiotoxic and hepatotoxic effects. In contrast, in spleen and lung pathological sections, histomorphology between groups was similar, with clear histology, red pulp, white pulp, clear margins, and no significant toxic effects. Moreover, the control group showed normal glomerular morphology and less lymphocytic infiltration, while the other groups showed less nephrotoxicity. As indicated (), Abraxane® caused weight loss in nude mice, but TPGS had no significant toxic effects in mice. Therefore, TPGS and Abraxane® combinations increased breast cancer therapeutic efficacy without increasing side effects in normal tissue.
TPGS-TG therefore exerted anti-tumor effects and could be combined with commonly used oncology drugs to enhance anti-tumor effects without additional serious toxic side effects, thereby demonstrating high safety levels and high antineoplastic efficiency.
4. Conclusions
In this work, several studies were systematically conducted to determine the anti-tumor mechanisms and anti-tumor effect of TPGS. Notably, TPGS promoted apoptosis in tumor cells via the mitochondrial pathway by increasing Ca2+ concentrations, and also TPGS significantly inhibited MCF-7-ADR cells proliferation and arrested growth in the G2/M phase. Furthermore, TPGS and DOX were injected via tail veins to investigate anti-tumor TPGS effects in vivo and showed that TPGS enhanced DOX therapeutic effects in breast cancer tumors and reduced DOX toxicity to some degree. Subsequently, a TPGS-TG formulation was prepared, which involved the intratumoral injection of TPGS-TG and Abraxane® via the tail vein. TG not only slowly and effectively released TPGS at tumor sites, but also enhanced the anti-tumor efficacy of Abraxane®, a conventional chemotherapeutic drug. Overall, we demonstrated the promising application of TPGS in oncology settings. In future work, when TPGS is used in tumor drug delivery system, its anti-tumor characteristics should be fully developed and considered.
Authors’ contributions
Lan Tang: conceptualization, methodology, writing - original draft. Kaijuan Huang: writing - review & editing, validation. Wenhui Jiang and Lulu Fu: writing - review & editing, investigation. Ran Zhang: conceptualization, data curation. Liting Shen: writing-original draft. Ye Huang: conceptualization, data curation, supervision, resources. Zhenhai Zhang: conceptualization, supervision.
Date availability statement
Date will be made available on request.
Disclosure statement
The authors declare that they have no competing interests.
Correction Statement
This article has been republished with minor changes. These changes do not impact the academic content of the article.
Additional information
Funding
References
- Agudelo D, Bérubé G, Tajmir-Riahi HA. (2016). An overview on the delivery of antitumor drug doxorubicin by carrier proteins. Int J Biol Macromol 88:1–13.
- Akkari ACS, Papini JZB, Garcia GK, et al. (2016). Poloxamer 407/188 binary thermosensitive hydrogels as delivery systems for infiltrative local anesthesia: physico-chemical characterization and pharmacological evaluation. Mater Sci Eng C Mater Biol Appl 68:299–307.
- Bhagat A, Kleinerman ES. (2020). Anthracycline-induced cardiotoxicity: causes, mechanisms, and prevention. Adv Exp Med Biol 1257:181–92.
- Blum RH, Carter SK. (1974). Adriamycin. a new anticancer drug with significant clinical activity. Ann Intern Med 80:249–59.
- Bujňáková Z, Baláž M, Zdurienčíková M, et al. (2017). Preparation, properties and anticancer effects of mixed As(4)S(4)/ZnS nanoparticles capped by Poloxamer 407. Mater Sci Eng C Mater Biol Appl 71:541–51.
- Chen Y, Mo L, Wang X, et al. (2020). TPGS-1000 exhibits potent anticancer activity for hepatocellular carcinoma in vitro and in vivo. Aging (Albany NY) 12:1624–42.
- Cheng W, Liang C, Xu L, et al. (2017). TPGS-functionalized polydopamine-modified mesoporous silica as drug nanocarriers for enhanced lung cancer chemotherapy against multidrug resistance. Small 13:1700623.
- Dintaman JM, Silverman JA. (1999). Inhibition of P-glycoprotein by D-alpha-tocopheryl polyethylene glycol 1000 succinate (TPGS). Pharm Res 16:1550–6.
- Fantappiè O, Solazzo M, Lasagna N, et al. (2007). P-glycoprotein mediates celecoxib-induced apoptosis in multiple drug-resistant cell lines. Cancer Res 67:4915–23.
- Fu Q, Lv P, Chen Z, et al. (2015). Programmed co-delivery of paclitaxel and doxorubicin boosted by camouflaging with erythrocyte membrane. Nanoscale 7:4020–30.
- Gewirtz DA. (1999). A critical evaluation of the mechanisms of action proposed for the antitumor effects of the anthracycline antibiotics adriamycin and daunorubicin. Biochem Pharmacol 57:727–41.
- Guan Y, Wang LY, Wang B, et al. (2020). Recent advances of D-α-tocopherol polyethylene glycol 1000 succinate based stimuli-responsive nanomedicine for cancer treatment. Curr Med Sci 40:218–31.
- Hajnóczky G, Csordás G, Das S, et al. (2006). Mitochondrial calcium signalling and cell death: approaches for assessing the role of mitochondrial Ca2+ uptake in apoptosis. Cell Calcium 40:553–60.
- Hao T, Chen D, Liu K, et al. (2015). Micelles of d-α-tocopheryl polyethylene glycol 2000 succinate (TPGS 2K) for doxorubicin delivery with reversal of multidrug resistance. ACS Appl Mater Interfaces 7:18064–75.
- Jia L, Li Z, Shen J, et al. (2015). Multifunctional mesoporous silica nanoparticles mediated co-delivery of paclitaxel and tetrandrine for overcoming multidrug resistance. Int J Pharm 489:318–30.
- Jin X, Li M, Yin L, et al. (2017). Tyroservatide-TPGS-paclitaxel liposomes: tyroservatide as a targeting ligand for improving breast cancer treatment. Nanomed 13:1105–15.
- Kanwal U, Irfan Bukhari N, Ovais M, et al. (2018). Advances in nano-delivery systems for doxorubicin: an updated insight. J Drug Target 26:296–310.
- Kumbhar PS, Nadaf S, Manjappa AS, et al. (2022). D-ɑ-tocopheryl polyethylene glycol succinate: a review of multifarious applications in nanomedicines. OpenNano 6:100036.
- Luo Y, Ziebell MR, Prestwich GD. (2000). A hyaluronic acid-taxol antitumor bioconjugate targeted to cancer cells. Biomacromolecules 1:208–18.
- Neophytou CM, Constantinou C, Papageorgis P, Constantinou AI. (2014). D-alpha-tocopheryl polyethylene glycol succinate (TPGS) induces cell cycle arrest and apoptosis selectively in survivin-overexpressing breast cancer cells. Biochem Pharmacol 89:31–42.
- Pawar VK, Singh Y, Meher JG, et al. (2014). Engineered nanocrystal technology: in-vivo fate, targeting and applications in drug delivery. J Control Release 183:51–66.
- Rahman CV, Kuhn G, White LJ, et al. (2013). PLGA/PEG-hydrogel composite scaffolds with controllable mechanical properties. J Biomed Mater Res B Appl Biomater 101:648–55.
- Rathod S, Bahadur P, Tiwari S. (2021). Nanocarriers based on vitamin E-TPGS: Design principle and molecular insights into improving the efficacy of anticancer drugs. Int J Pharm 592:120045.
- Ren X, Wang N, Zhou Y, et al. (2021). An injectable hydrogel using an immunomodulating gelator for amplified tumor immunotherapy by blocking the arginase pathway. Acta Biomater 124:179–90.
- Ruttala HB, Ko YT. (2015). Liposomal co-delivery of curcumin and albumin/paclitaxel nanoparticle for enhanced synergistic antitumor efficacy. Colloids Surf B Biointerfaces 128:419–26.
- Siegel RL, Miller KD, Fuchs HE, Jemal A. (2022). Cancer statistics, 2022. CA A Cancer J Clinicians 72:7–33.
- Tang L, Zhu ZF, Cao LP, et al. (2020). [Thermosensitive gel of polysaccharide from Ganoderma applanatum combined with paclitaxel for mice with 4T1 breast cancer]. Zhongguo Zhong Yao Za Zhi 45:2533–9.
- Varma MV, Panchagnula R. (2005). Enhanced oral paclitaxel absorption with vitamin E-TPGS: effect on solubility and permeability in vitro, in situ and in vivo. Eur J Pharm Sci 25:445–53.
- Vincze O, Colchero F, Lemaître JF, et al. (2022). Cancer risk across mammals. Nature 601:263–7.
- Wang TH, Wang HS, Soong YK. (2000). Paclitaxel-induced cell death: where the cell cycle and apoptosis come together. Cancer 88:2619–28.
- Yang L, Xin J, Zhang Z, et al. (2016). TPGS-modified liposomes for the delivery of ginsenoside compound K against non-small cell lung cancer: formulation design and its evaluation in vitro and in vivo. J Pharm Pharmacol 68:1109–18.
- Youk HJ, Lee E, Choi MK, et al. (2005). Enhanced anticancer efficacy of alpha-tocopheryl succinate by conjugation with polyethylene glycol. J Control Release 107:43–52.
- Yu M, Zhang C, Tang Z, et al. (2019). Intratumoral injection of gels containing losartan microspheres and (PLG-g-mPEG)-cisplatin nanoparticles improves drug penetration, retention and anti-tumor activity. Cancer Lett 442:396–408.
- Zhang L, Qi J, Zhang X, et al. (2022). The regulatory roles of mitochondrial calcium and the mitochondrial calcium uniporter in tumor cells. Int J Mol Sci 23:6667.
- Zhang Y, Dosta P, Conde J, et al. (2020). Prolonged local in vivo delivery of stimuli-responsive nanogels that rapidly release doxorubicin in triple-negative breast cancer cells. Adv Healthc Mater 9:e1901101.
- Zhang Z, Tan S, Feng SS. (2012). Vitamin E TPGS as a molecular biomaterial for drug delivery. Biomaterials 33:4889–906.