
 ?Mathematical formulae have been encoded as MathML and are displayed in this HTML version using MathJax in order to improve their display. Uncheck the box to turn MathJax off. This feature requires Javascript. Click on a formula to zoom.
Abstract
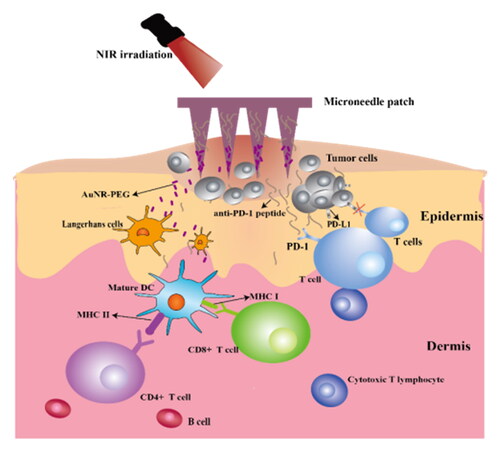
Conventional treatments for tumors were frequently accompanied by drawbacks and side effects. It might be useful to use the revolutionary microneedle technology which combines photothermal therapy with tumor immunotherapy. In this study, we created a microneedle drug delivery system with mercapto-modified gold nanorods and immune checkpoint blocker anti-PD-1 polypeptide. With good mechanical strength, the microneedle system can efficiently penetrate the skin and deliver drugs. When inserted into human skin, anti-PD-1 peptides and gold nanorods can be released, boosting the capacity of cytotoxic T lymphocytes to destroy tumor cells. Additionally, the elimination of the tumor is aided by the production of heat while being exposed to near-infrared light. This microneedle drug delivery system can enhance the immunological reaction and prolong the survival time of mice. Moreover, it has been demonstrated that the system has mild toxic and side effects on normal tissues and can effectively inhibit the growth of tumors, indicating a bright prospect for the treatment of cancers.
GRAPHICAL ABSTRACT
1. Introduction
According to numerous studies, immunotherapy provides unmatched advantages over conventional anti-tumor therapy in extending progression-free survival and overall survival. (Yang, Citation2015; Tan et al., Citation2020). Immunotherapy regulates the immune microenvironment to boost immunity, allowing immune cells to control and eliminate tumor cells at several significant nodes (Chevolet et al., Citation2015). In recent years, immune checkpoint blocking therapy (ICB) (mainly including PD-1 and CTLA-4) has recently emerged as a promising treatment option for a variety of cancers, including renal cell carcinoma, classical Hodgkin’s lymphoma, metastatic melanoma, advanced nonsmall-cell lung cancer, bladder cancer and Merkel cell carcinoma (Sharma & Allison, Citation2015; Dholaria et al., Citation2016; Syn et al., Citation2017). The expression of PD-1 exists on activated lymphocytes, and generally depleted lymphocytes over-express PD-1. To maintain the balance of T-cell activation, tolerance, and immune-mediated tissue damage, interactions between PD-1 and its ligands PD-L1 and PD-L2 restrict T-cell function. The stimulator of PD-L1 expression mainly exists in hematopoietic cells and epithelial cells and is stimulated primarily by IFN-γ produced by activated T cells and natural killer cells. While PD-L2 is mainly expressed in macrophages and activated dendritic cells, PD-L1 can be expressed by a variety of types, including immune cells, epithelial cells, endothelial cells, and tumor cells. (Sharma & Allison, Citation2015; Zou et al., Citation2016). Increased PD-L1 expression in some tumor cells has has been demonstrated to result in improved T-cell activity suppression, which is beneficial to tumor cell survival. Therefore, PD-1/PD-L1 inhibitors have been developed for clinical treatment. These drugs can improve T-cell activity and proliferation, which will subsequently help immunotherapy perform its anti-tumor function.
Effective cancer immunotherapy is highly dependent on the activation of CD4+ T cells, thereby mediating the function of CD8+ T cells (Schumacher & Schreiber, Citation2015). Monoclonal antibodies (mAbs) have traditionally had a high level of specificity and effectiveness. In recent years, the development of mAbs for cancer immunotherapy, particularly as immunosuppressive drugs, has received a lot of attention lately. Although exciting clinical progress has been made in checkpoint inhibitors, deficiency still exists, such as serious adverse effects, and they may also induce organ-specific autoimmune diseases (Pardoll, Citation2012). To overcome this limitation, Gu et al. achieved local transmission of anti-PD1 antibodies (aPD1) by loading anti-PD1 antibodies (aPD1) into MNs (Wang et al., Citation2016; Yu et al., Citation2017). With glucose oxidase, MNs were designed as a pH reaction platform to control drug release precisely. Blood glucose was transformed into gluconic acid after the insertion of MNs, which caused glucose oxidase to lower the pH, cause NPs to dissociate and cause drug release at a low pH level. As an immunoactive organ, the skin provides immune protection with specialized cells that capture and process antigens. In order to trigger protective immune responses to locally administered antigens, transcutaneous immunization (TCI) makes advantage of the skin’s immunological network. This vaccination mode offers a novel and effective method for needle-free immunization, which is reliable, convenient, and noninvasive, and breaks through the limitations of many injection methods of vaccines (Karande & Mitragotri, Citation2010). In the percutaneous immunotherapy of cancer, targeting skin dendritic cells through local immunity has shown significant advantages in cancer immunotherapy (Carreno et al., Citation2015). In a clinical trial, targeting skin DC proved to be a viable immunotherapeutic approach for melanoma patients as it induced cytotoxic CD8+ T cell response via TCI and resulted in regression of some lesions (Yagi et al., Citation2006). Microneedles (MNs), as a new type of percutaneous drug delivery carrier, have broken through the bottleneck of traditional percutaneous drug delivery systems and have become a hot spot in drug delivery in recent years. MNs have shown promise in immunotherapy, particularly the transdermal delivery of macromolecules (such as antigens, antibodies, and DNA) (Zhao et al., Citation2018). The local administration strategy improves the protein drugs’ stability and extends the retention time of aPD1 in the administration site. Compared with injecting aPD1, the MN system has a better tumor inhibition effect and fewer side effects (Wang et al., Citation2016; Yu et al., Citation2017). Gu et al. have reported that the MN system carrying aPD-1 and IDO inhibitor 1-methyl-dl-tryptophan (1-MT) had a synergistic anti-tumor effect in the B16F10 mouse melanoma model (Ye et al., Citation2016). Courtenay et al. used hydrogel MNs to provide a high dose of bevacizumab. They demonstrated the transport capacity of MN platforms in lymphatic and systemic circulation systems, highlighting the characteristics of continuous transport, which was crucial for treating metastatic cancer (Courtenay et al., Citation2018).
Photothermal therapy (PTT) is a promising cancer treatment method. It uses laser energy to generate heat to cause apoptosis or necrosis of cancer cells directly, as opposed to photodynamic therapy’s (PDT) method of relying on the creation of reactive oxygen species (Jiang et al., Citation2021). This therapy is believed to reduce side effects and toxicity because they are minimally invasive and easy to use (Kennedy et al., Citation1990; Park et al., Citation2010; Hamdan et al., Citation2018; Tham et al., Citation2018). Deng et al. used doxorubicin-loaded gold nanovesicles to achieve chemophotothermal cancer synergistic therapy (Deng et al., Citation2021). Ying et al. used polyethylene glycol gold nanorods to coat MNs and combined MNs with intravenous injecting docetaxel micelles to treat diseases. Compared with PTT alone or chemotherapy alone, the combination therapy had an excellent anti-cancer effect and was without recurrence (Hao et al., Citation2017; Gao et al., Citation2022). Chen et al. also progressed in MN transdermal delivery, especially in anti-cancer PTT. They developed renewable, low leakage, noninvasive trigger MNs to transfer photosensitizers to the skin. In addition, they loaded DOX and a photosensitive nanomaterial platform (lanthanum hexaborate) into MNs through polyvinyl alcohol/polyvinyl pyrrolidone for the combination of photothermal therapy and chemotherapy (Lai & Chen, Citation2013; Chen et al., Citation2015). In recent years, the selective photothermal method has received more and more attention by using the difference in the concentration of photothermal agents in the tumor site to selectively increase the temperature of the tumor site (Zhao et al., Citation2021). In a study by Sun and coworkers (Qin et al., Citation2022a, Citation2022b), PTT significantly increased the expression of PD-L1 and TILs, effectively sensitizing tumors to immune checkpoint blockade (ICB) therapy, the photothermal reagent IR820 and programmed death-ligand 1 anti-body (anti-PD-L1) were coencapsulated into a thermosensitive lipid gel reservoir to achieve PTT and immunotherapy after the drug was intertumoral administration. Recently, selective thermotherapy of tumor selective photothermal therapy has also made great research progress. Qin et al. think the combination of CAP and PTT can increase the selectivity of PTT and promote the clinical transformation of CAP (Qin et al., 2022 a, 2022b). Zhao et al. designed a self-regulating photothermal conversion system for selective thermotherapy based on self-assembling gold nanoparticles (S-AuNPs) and investigated the selectivity effect using a novel home-made in vitro selective photothermal transformation model and an in vivo skin damaging assessment model (Zhao et al., Citation2022a). In the same year, they prepare a Cu2+ doped hollow zeolitic imidazolate frame-work nanoparticle (HZIFCu) as the carrier to equip DSF and indocyanine green (ICG) to achieve the supply of Cu2+, ‘DSF-to-CuET’ transformation delivery, and multiple combination therapy (Zhao et al., Citation2022b).
In this study, we employed the photothermal material AuNR-PEG to ablate the tumor under near-infrared light irradiation and the anti-PD-1 polypeptide, an immune checkpoint blocker, to prevent the occurrence of immune escape and maximize the cytotoxic T lymphocyte’s ability to kill tumors. It was indicated that our microneedle patch system possessed great superiorities in inhibiting the growth of early tumors, offering a promising alternative for tumor treatment.
2. Materials and methods
2.1. Materials
Anti-PD-1 peptide (Sequence: (SNTSESF)2KFRVTQLAPKAQIKE-NH2 Branched peptide) (molecular weight 3261.55) was supplied by DGpeptides Co., Ltd. (China). Monoterminal methoxy polyethylene glycol mercapto polymer was purchased from Shanghai Macklin Reagent Co., Ltd. (China). Polymethyl vinyl ether maleic anhydride copolymer was purchased from Shanghai JuWei International Trade Co., Ltd. Polydimethylsiloxane (PDMS, Sylgard 184) was obtained from Dow Corning (USA). RPMI 1640 was provided by Thermo Fisher Scientific Co., Ltd. (China). FITC-anti-mouse CD11c, APC-anti-mouse CD80, and PE-anti-mouse CD86 were purchased from Biolegend (USA). Calcein/PI Cell Viability/Cytotoxicity Assay Kit was purchased from Beyotime Biotechnology Co., Ltd. (China). Other chemical solvents used were of reagent grade and used as directed.
2.2. Animals
4 ∼ 6 weeks BALB/c mice, 18 ± 2 g, were supplied by the Zhejiang Academy of Medical Sciences (Zhejiang, China). Mice fed with commercial aseptic food were housed at constant temperature and humidity. All studies were reviewed and approved by the Institutional Animal Care and Use Committee of Zhejiang University of Technology (20211018081).
2.3. Methods
2.3.1. Preparation and characterization of cetyltrimethylammonium bromide (CTAB) and mPEG-SH coated AuNRs
The gold nanorods (AuNRs) were synthesized according to the reference with slight modifications (Liu et al., Citation2014). First, 5 mL HAuCl4 • 4H2O (0.5 mM) was dissolved in 5 mL CTAB (0.2 M) solution, and 600 μL NaBH4 (0.01 M) (ice bath, to prevent rapid oxidation) was added with rapid stirring for 2 ∼ 5 min to generate a yellow gold seed solution (stored at 27 ∼ 30 °C for about 2 h for standby). The preparation steps of the growth solution were as follows: 7.5 mL AgNO3 (4 mM) and 150 mL CTAB (0.2 M) solution were added into a conical flask. When mixed well, 150 mL HAuCl4 • 4H2O (1.0 mM) solution and 3 mL HCl (1.0 M) were added. Finally, 2.1 mL ascorbic acid (0.0788 M) was added for reduction. After slow stirring, the color of the solution changed from yellow to colorless. Then, 360 μL gold seed solution prepared above was added, and the solution was incubated at 30 °C for 12 h to obtain a brown solution. The solution prepared was then centrifuged (9500 rpm, 15 min) and washed three times with water to remove CTAB and obtain AuNRs. The AuNRs got above and mPEG-SH were mixed at a ratio of 1:1 (w/w) and placed in a constant temperature oscillating incubator (37 °C, 150 rpm) for ligand exchange for 48 h. The product was followed by high-speed centrifugation (10000 rpm, 8 min). The supernatant was removed and the precipitate was resuspended with ultrapure water to obtain AuNR-PEG. The AuNRs and AuNR-PEG were confirmed by UV-vis (TU-1900, Beijing Puxi, China) and Fourier transform infrared (FTIR) (Nicolet iS50, Thermo Fisher Scientific, USA). The particle size and zeta potential of the AuNRs and AuNR-PEG were determined at 25 °C by the dynamic light scattering (DLS) (Zetasizer Nano ZS90, Malvern, UK). The morphology of AuNRs was determined with transmission electron microscopy (TEM, Talos-S, FEI, USA).
2.3.2. Cytotoxicity assay
As previously reported, a standard MTT assay was performed to test the cytotoxicity of AuNRs and AuNR-PEG. Cells were plated at a density of 8 × 10³ cells per well in a 96-well plate to determine the relative cell viability. After 24 h culture, a fresh medium with varying concentrations of AuNR and AuNR-PEG (the Au atomic concentration was determined by ICP-OES) was used to replace the original medium. The group using a nanoparticle-free medium served as a control. After 24 h, the MTT solution (5 mg/mL) was added to each well and cultured for 4 h. Then 150 μL dimethyl sulfoxide was added to each well to dissolve the dark blue formazan crystals generated by the mitochondria dehydrogenase in live cells. A microplate reader was used to measure the absorbance (OD value)at 490 nm.
2.3.3. Preparation and characterization of dissolving microneedle delivery system
The micro molding technology fabricated the dissolving microneedle (DMN) as described with some modifications. Different kinds of MN matrix materials were selected to screen the best prescription. We found that PMVE-MA (Gantrez S-97) was the most suitable DMN matrix material, which had excellent mechanical properties in the dry state and excellent biological bonding properties in a humid environment. The anti-PD-1 peptide was loaded into the base material and cavities of the microneedles by a two-step sandwich method. The AuNR-PEG was injected into the microneedle chamber as solution. MNs were observed by scanning electron microscope (SEM S-4800, Hitachi, Japan).
2.3.4. Fracture and bending rate test of MNs
To evaluate the degree of compression by applying different forces, we applied forces of 0.9 ∼ 18 N to MNs patch (3 × 3 array). We recorded the microneedle morphology and height under different forces with a microscope to calculate the percentage of microneedle height reduction. At the same time, folding experiments were conducted to further verify microneedles’ mechanical properties. Microneedle patches were cut into 3 × 3 arrays and put into a round bottom test tube. The tube was placed in a constant temperature oscillating incubator with a rotating speed of 100 rpm, and the patches were taken out at 0.5, 1, and 3 h, respectively. The numbers of microneedles bent or broken were recorded, and the bending/breaking rates were calculated.
2.3.5. Study on dissolution behavior of DMNs
MN tips were placed on the pre-perforated polyethylene film of appropriate size. The lower part of the film directly contacted the PBS buffer (pH 5.5), which simulated the interstitial skin fluid. The test tube was put in a constant temperature shock box with a temperature of 37 °C and a speed of 50 rpm. MNs were taken out at regular intervals. After absorbing the water on the microneedle surface with filter paper, MNs were immediately observed under the microscope, and photos were taken for recording.
To further investigate the dissolution of microneedles under heating, the microneedle dissolution experiment was repeated under NIR irradiation.
2.3.6 Study on skin penetration of DMNs
The skin-piercing performance of the DMNs was investigated. After the mice were sacrificed, the back hair of these mice was shaved with a razor, and the isolated back skin was obtained. The prepared composite DMNP was pressed into the skin for about 1 min, and 0.4% (w/v) trypan blue solution was used to stain the pinhole area for 5 min to confirm whether the microneedles had pierced the skin. Besides, the low invasiveness of the microneedles was also verified through the skin of living mice. The skin healing process was observed and recorded over time.
Besides, the microneedle-treated skin was also scanned at 2D cross-sectional to determine penetration depth using optical coherence tomography (OCT). OCT images were recorded by self-assembly equipment from the School of Information and Engineering, Zhejiang University of Technology. The scale of the obtained image file was 1.0 pixel = 8.8 µm vertically and 1.0 pixel = 10 µm horizontally. The OCT images allowed accurate penetration depth measurements, and quantification was performed by imaging software Image J.
2.3.7. Study on the healing process of DMNs after penetrating skin
To verify that the skin at the puncture site of Gantrez S-97 MNs healed well after administration, the MNs were stuck on the back of the mice, which was depilated for 2 minutes, and then the microneedle patch was removed. The whole process of skin healing was recorded with a camera.
2.3.8. Photothermal heating effect of AuNR-PEG MNs
We prepared microneedles loading AuNR-PEG solution (30 μg/mL) in advance. The difference between this preparation process and that of blank MNs was the needle tips were vacuum dried for 1 h after preparation. After removal, the AuNR PEG solution was filled into the holes of microneedles with a syringe. The steps of loading and centrifuging the remaining backing materials were the same as those of blank MNs. The photothermal heating effect was tested within 5 min of laser irradiation (power 2 W/cm2), and photos were taken by a thermal imager at 0, 1, 3, and 5 min.
2.3.9. The mass of anti-PD-1 Peptides is loaded in MNs
Anti-PD-1 peptides and rhodamine B(SRB) were dissolved in PBS buffer solution at pH 7.4, and the Anti-PD-1 peptide solution was dropped drop by drop into SRB solution under stirring for 30 min in the dark. Finally, place in a refrigerator at 4 °C and incubate for 12 h. The conjugate is then placed in a dialysis bag for 3 days to remove the unbound SRB, and finally, SRB-Anti-PD-1 powder is obtained by freeze-drying. And then weigh 10 mg of SRB-Anti-PD-1 powder at a concentration of 1 μg/μL. Dilution (0, 1, 2, 4, 8, 10, 25, 35 μg/mL) is performed in a 96-well plate and then the absorbance is measured at 610 nm on a microplate reader to establish a standard curve. The prepared MNs were dissolved in a PBS buffer solution at pH 7.4 and measured the absorbance of this solution at 610 nm on a microplate reader.
2.3.10. Distribution of anti-PD-1 Peptides in MNs
The laser confocal scanning electron microscope (CLSM) was used for observation. Rhodamine B, whose physical and chemical properties were similar to the anti-PD-1 polypeptide, was thoroughly mixed in the proportion of 100:1 by weight, and the mixed powder was loaded into microneedles. The specific preparation method was as follows: after centrifugation, needle tips were placed in a vacuum-drying oven to dry for 2 ∼ 3 h to form holes. Then the holes were filled with the prepared mixed powder of anti-PD-1 polypeptide and rhodamine B. The prepared MNs were dried and stored away from light to prevent fluorescence quenching. The confocal microscope was set to scan layer by layer in 2D, and the total scanning height was 500 μm.
2.3.11. In vitro photothermal ablation of tumor cells
The living/dead cell staining method was used to qualitatively analyze the status of 4T1 tumor cells. The MTT method was used to quantitatively investigate the photothermal ablation effect of tumor cells in vitro. 4T1 cells were plated at a density of 8 × 10³ cells per well in a 96-well plate and cultured for 24 h. When accomplished, the medium was replaced with fresh medium containing PBS solution, AuNR, or AuNR-PEG of equal concentration and thus divided into three groups. After incubation for 2 h, half of each group was treated with laser irradiation (2 W/cm2, 3 min), and the other half was not treated with laser irradiation. After 24 h, MTT solution (5 mg/mL) was added to each well and treated for 4 h. Then, 150 μL of dimethyl sulfoxide was added to each well to measure the absorbance at 490 nm by a microplate reader. Cell survival rate was calculated from these. Five wells were set in each group, and each experiment was repeated 3 times.
The cell viability was qualitatively detected with the Calcein AM/PI cell activity and cytotoxicity test kit. 4T1 cells growing in the logarithmic phase were inoculated at a density of 105 cells per well into a 6-well plate. After overnight incubation, PBS solution, AuNR, or AuNR-PEG of equal concentration were added and thus divided into three groups. After incubation for 2 h, half of each group was treated with laser irradiation (2 W/cm2, 3 min), and the other half was not treated as a control. After 24 h of incubation, the culture solution was sucked off, and the cells were washed with PBS. Calcein AM/PI detection working solution was added to each hole (prepared according to the instructions of the kit). When accomplished, the cells were incubated in the dark at 37 °C for 30 min. After incubation, the staining effect was observed under the fluorescence microscope.
2.3.12. In vitro tumor immune effect evaluation
Firstly, we extracted and cultured bone marrow-derived dendritic cells (DCs) from BALB/c mice. The dead mice were immersed in 75% ethanol for 10 min to eliminate the bacteria on the body surface of the mice. The tibia and femur of the mice were carefully dissected, and the attached muscle and mucosal tissue were removed. The bones were immersed in 50% ethanol solution for 5 min and then washed with PBS buffer solution three times. After that, both ends of the treated bones were cut off, and sterile 1 mL syringes were used for flushing and collecting the bone marrow. The cell sieve was used to remove the tissue fragments. The filtrate was centrifuged at 1000 rpm for 5 min, and the supernatant was discarded. The red blood cell lysate of 10 times volume was added to resuspend the cells. The cells were left to stand for 5 min and then centrifuged again. The cells were resuspended with RPMI 1640 complete medium and were inoculated into a 6-well plate. Finally, the growth factors GM-CSF and IL-4 with a final concentration of 20 ng/mL were added and cultured at 37 °C in a 5% CO2 constant temperature incubator. The cell morphology was observed under the microscope on the first, third, and fifth days of culture. On the seventh day of culture, the extracted bone marrow cell surface protein was labeled with fluorescent antibody FITC-anti-mouse CD11c. The phenotype of mouse bone marrow dendritic cells was identified. The proportion of different DCs was determined by the expression rate of positive cells.
After extracting DCs from mouse bone marrow, the ability of AuNR-PEG under laser irradiation to promote the maturation of DCs was explored. As shown in , the attached 4T1 tumor cells were coincubated with PBS and AuNR-PEG for 2 h, then irradiated with laser for 3 min, and incubated for 24 h. Then a small amount of the supernatant of the tumor cells was added to the DCs pre-inoculated in 6 well plates, and the cells were incubated for 24 h to collect DCs. APC-anti-CD11c, PE-anti-CD80, and FITC-anti CD86 were prepared according to the instructions and then tested by flow cytometry.
Figure 1. Schematic diagram of DCs activation in vitro.

2.3.13. In vivo evaluation of the anti-tumor effect of anti-PD-1 polypeptide combined with AuNR-PEG MNs
We built a 4T1 tumor-bearing BALB/c mice model. After the tumor reached a specific size, the mice were randomly divided into six groups, and there were 8-10 mice in each group: (1) Saline group; (2) anti-PD-1 + AuNR-PEG injection group; (3) Blank MN group; (4) anti-PD-1 MN group; (5) AuNR-PEG MN group; (6) anti-PD-1 + AuNR-PEG MN group. The experimental administration scheme design is shown in . The mice were administrated every other day. The administration was divided into two ways: intratumoral injection and microneedle administration. The mice in the intratumoral injection group were injected with 100 μL anti-PD-1 polypeptide (3 mg/mL) and 300 μL AuNR-PEG (30 μg/mL) with laser irradiation each time; The MN patch was applied to the tumor site in microneedle administration group. Each patch of the anti-PD-1 MN group contained about 500 μg anti-PD-1 polypeptides, and each patch of the AuNR-PEG MN administration group contained 100 μg anti-PD-1 polypeptides. The above experimental groups were administered 10 times in total. The laser irradiation condition was 2 W/cm2, and the irradiation time was 2 min.
Figure 2. Schematic diagram of administration method for BALB/c mice.

The weight of tumor-bearing mice was recorded every other day, and the length and width of tumors were recorded with vernier calipers. The tumor volume was calculated according to the formula:
After 6 times of administrations, 3 mice in each group were randomly selected for blood collection and then put to death. Each mice’s heart, liver, spleen, lung, kidney, and tumor were carefully collected with surgical scissors and tweezers. A steel ruler with a scale and the tumors of mice of each group were placed on A4 paper, and the size of each tumor was observed visually and photographed. The tumors and spleens were weighed, and the average value was calculated.
2.3.14. Study on photothermal properties in vivo
Using 4T1 tumor-bearing mice as model animals, the temperature of the tumor site of mouse tumor tissue under laser irradiation was investigated. The following experimental groups were irradiated with laser (2 W/cm2): Blank MN group; AuNR MN group; AuNR-PEG MN group; anti-PD-1 + AuNR-PEG MN; anti- PD-1 + AuNR-PEG injection, to explore the tumor site temperature in laser irradiated mice at different time points of 0, 30, 60, 90, and 120 s, and recorded and photographed with an infrared thermal imager.
2.3.15. Anti-tumor mechanism of tumor immunotherapy combined with photothermal therapy
The expression of immune factors TNF-α, IL-6, and IFN-γ in serum was detected. After administration 10 times, 3 mice in each group were randomly selected. Their spleens were collected and cut into small pieces. A cell filter sieve was put on the plate, and a small amount of tissue diluent was added to ensure the samples obtained were in a liquid environment. The pieces of spleens were placed on the sieve mesh and were ground with a syringe piston. After filtration, the number of cells was counted, and the cell concentration was adjusted to 2 ∼ 5 × 10⁵ per sample tube. The lymphocytes were stained with flow cytometry fluorescent antibodies PE-anti-mouse-CD3, FITC-anti-mouse-CD4, and APC-anti-mouse-CD8a to analyze the percentage of CD3+, CD4+, and CD8+ T lymphocytes in spleen cells of mice in different experimental groups.
2.3.16. Statistical analysis
All data are expressed as mean ± standard deviation (SD). Significance differences were derived by Student’s t-test. *p < 0.05 was considered statistical significance, while **p < 0.01 was considered highly significant.
3. Results and discussion
3.1. Preparation and characterization of AuNRs and AuNR-PEG
AuNRs were synthesized by the gold seed growth method. UV-Vis and FT-IR were utilized to confirm the successful synthesis. The UV-vis absorbance peaks of AuNRs and AuNR-PEG were 796 and 802 nm, respectively, similar to previous reports (). It also indicated that AuNRs and AuNR-PEG possessed sound absorption effects for near-infrared light. To further verify the successful thiolation of gold nanorods, the infrared spectra of AuNR and AuNR-PEG were scanned. The results are shown in , consistent with the characteristic peaks described in the literature (Liu et al., Citation2014). The infrared spectrum of AuNR-PEG shows a strong absorption peak of 1102.8 cm−1, representing the C-O stretching vibration absorption peak of -CH2O-CH2- on the mono terminal methoxy polyethylene glycol mercapto (mPEG-SH) ().
Figure 3. UV-vis spectrum of AuNRs and AuNR-PEG.

Figure 4. FT-IR spectrum of AuNR and AuNR-PEG.

Owing to the positive potential of the gold nanorods generated by CTAB and the certain negative charge of mPEG-SH itself, it can be seen from the potential diagram that after modification, the charge of the synthesized AuNR-PEG has been reversed (). It is proved by TEM that the synthesized AuNRs and AuNR-PEG have a relatively uniform rod-like structure (). Meanwhile, we also determined the photothermal heating effect in different solutions and at different concentrations, confirming that AuNR-PEG had a good photothermal heating effect ().
Figure 5. Morphological characterization of AuNRs and AuNR-PEG (A. The TEM images of AuNRs, B. The TEM images of AuNR-PEG, C. The particle size distribution of AuNR-PEG, D. Zeta potential for different solutions).

Figure 6. Photothermal capacity (A. different solutions, B. AuNR-PEG at different concentrations) (n = 3).

3.2. Cytotoxicity of AuNRs and AuNR-PEG
The cytotoxicity of AuNRs is due to CTAB, so suitable ligand modification of the AuNR surface is crucial to improve their biocompatibility. MTT assays were performed to evaluate the cytotoxicity of AuNR and AuNR-PEG in both standard cell line L929 and cancer cell line 4T1 cells (). After modification, the AuNR-PEG showed no significant cytotoxicity for both types of cells at all tested concentrations, while the AuNR exhibited much higher cytotoxicity. These results demonstrated that mPEG-SH ligand modification could significantly reduce the cytotoxicity of AuNRs, promising their application in vivo.
Figure 7. The cell cytotoxicity of AuNR-PEG and AuNR in (A. L929 cells, B. 4T1 cells) (n = 3, *p <.05; **p <.01; ***p < .001; ****p < .0001).

3.3. Preparation of the DMNs
The DMNs were fabricated through a two-step micro molding method. We chose 20% Gantrez S-97 as the tip material and 5% HPMC as the backing material (). The needles were well arranged with uniform sizes and morphologies. As shown in the SEM images (), the needles were 500 µm in height and were arranged into a 6 × 6 microneedle array with a 1000 µm in the center-to-center distance, which was precisely accordant with the master mold.
Figure 8. Mechanical property of Gantrez S-97 MNs at different concentrations (n = 3, *p < 0.05; **p < 0.01; ***p < 0.001; ****p < 0.0001).

Figure 9. The SEM images of DMNs, Scale bar represents 1.00 mm, 300 μm.

3.4. Experimental analysis of the flexibility of DMNs
The degrees of microneedle compression under different stresses are shown in . It can be seen that when the force on a single MN is 0.4 N, the compression ratio of the microneedle is only 10%. When the force reaches 2 N, the compression ratio of the microneedle is less than 30%. Combined with the optical pictures of the microneedle, it can be proved that it has extreme deformation resistance. To further verify the mechanical properties of the microneedle, the patch was cut into 3 × 3 MNs. It can be found when vibrated for 3 h, the DMNs made by 20% S-97 tip material were not broken or bent, which was consistent with the mechanical property test results. All microneedles in the 10% S-97 microneedle group were bent, and the bending/breaking rates of the 15% S-97 and 30% S-97 microneedle groups were both 33%, and the bending/breaking rate in the 15% S-97 microneedle group was 17% ().
Figure 10. The morphology and the reduction of the microneedle change under different stress conditions (n = 3).

Table 1. Bending/breaking rates of MNs prepared with different concentrations of S-97.
3.5 Dissolution behavior of DMNs
The dissolution process of microneedles was carried out in PBS (pH 5.5) buffer solution. It can be seen from that DMNs barely changed at 15 s and began to dissolve at 30 s. With the extension of dissolution time, the needle height gradually decreased, and microneedles slowly disappeared. At 180 s, the height of microneedles was about a half. As shown in , the dissolution of microneedles was faster at all time points under NIR irradiation, and the microneedles were almost dissolved at 180 s indicating the dissolution process of microneedles was accelerated under NIR irradiation. This experiment proved that the prepared Gantrez S-97 microneedle patches had good dissolution performance, which could dissolve and release drugs after penetrating the skin. NIR irradiation could accelerate the process to a certain extent.
Figure 11. The dissolution process of DMNs (A: without NIR irradiation; B: under NIR irradiation).

3.6. Skin penetration of DMNs
To verify the skin penetration performance of DMNs, the treated skin was dyed with trypan blue. Trypan blue could penetrate the cells whose cell membranes were damaged and dye them but were not able to enter the normal cells. As shown in , the array of neat pinholes can be seen after DMN penetration. shows the skin after trypan blue staining, and the pinholes of 36 needles can be seen clearly, indicating that DMNs successfully penetrated the skin.
Figure 12. A Skin penetration test (A: unstained skin pinhole; B: 0.4% trypan blue solution-stained skin pinhole).

OCT technology can intuitively observe whether microneedles penetrate the skin and the real-time depth of insertion into the skin. The results are shown in . A row of pinholes (6 needles) of DMNs can be clearly seen inserted into the skin. We used the imaging software Image J to calculate the penetration depth of DMNs into the skin. It was about 500 μm, consistent with the needle length of the microneedle itself, thus proving that the microneedle had successfully penetrated the skin.
Figure 13. The optical coherence tomography (OCT) images of DMNs (A: MNs-untreated skin; B: DMNs penetration into the skin).

3.7. Healing process of DMNs after penetrating skin
The healing of the skin after DMNs were inserted into the back of the mice is shown in . The needle holes of the skin barely changed in the first two minutes. The holes gradually disappeared in the 2 ∼ 6 min, indicating that the micro holes formed on the skin were slowly recovering. The trace of the needle hole of DMNs was completely invisible until the seventh minute. In addition, it could be seen that there was no redness and swelling in the whole healing process of the skin, which indicated that DMNs were safe and the skin damage was reversible.
Figure 14. The image of DMNs puncturing skin wound healing.

3.8. Photothermal heating effect of AuNR-PEG MNs
The blank MNs and AuNR-PEG MNs were irradiated with a laser for 5 min to observe the effect of photothermal heating. As shown in , the blank MNs almost did not raise the temperature within 5 min, while the AuNR-PEG MNs reached 50 °C in the center of the microneedle patch within 1 min, and the temperature also rose slightly within 3 ∼ 5 min, but the rise was not as rapid as the previous one. Compared with the blank microneedles without the photothermal agent, the photothermal heating effect of the AuNR-PEG MN group was very satisfactory, indicating that the microneedles with the photothermal agent could convert light energy into heat energy under laser irradiation and play the role of tumor ablation.
Figure 15. Thermal imaging of photothermal capacity of MNs (blank MNs and AuNR-PEG MNs).

3.9. The mass of anti-PD-1 Peptides is loaded in MNs
By establishing the fluorescence standard curve of SRB-anti-PD-1 peptide (), The equation for the linear fitting of this standard curve is y = 2050*x + 590.2, R2=0.9994, the content of anti-PD-1 peptide loaded in a microneedle patch was accurately calculated, and each microneedle could be loaded with 500.68 μg anti-PD-1 peptide (n ≥ 3).
Figure 16. The fluorescence standard curve of SRB-anti-PD-1 peptide.

3.10. Distribution of anti-PD-1 Peptides in DMNs
To show the distribution of polypeptides in MNs, CLSM was used for observation (). The red fluorescence represented anti-PD-1 peptide mixed with rhodamine B. For , polypeptides are mainly distributed in the tip of microneedles from different angles, with a height of about 150 μm. The rest is distributed primarily in the outer layer of the microneedles. It could also be seen from that the positions with high fluorescence intensity mainly concentrated in the microneedle tip. It may be due to the preparation centrifugation process of microneedles, drugs primarily distributed in the tip under centrifugal force. In addition, owing to the excellent water solubility of anti-PD-1 polypeptide, it was possible to mix it with the material of the microneedle in the preparation process to distribute polypeptides in the outer layer of the microneedles.
Figure 17. Distribution CLSM images of anti-PD-1 peptide in MNs (A: Three-dimensional distribution images; B: Two-dimensional distribution map).

3.11. In vitro photothermal ablation of tumor cells
To evaluate the cytotoxicity induced by the photothermal effect in vitro, 4T1 cells were incubated with the AuNRs and AuNR-PEG for 24 h with (2 W/cm2, 3 min) or without NIR laser irradiation. As shown in , compared with the PBS control group, the cell viability after laser irradiation of AuNRs and AuNR-PEG solution decreased, indicating that laser irradiation after coincubation of tumor cells with photothermal agents can cause photothermal ablation of tumor cells, inducing tumor cell death. And it could be found that the survival rate of cells after laser irradiation in the PBS control group did not decrease, indicating that laser irradiation alone would not cause cell apoptosis or necrosis. Meanwhile, it was also found that the AuNR-PEG solution group exhibited significantly increased cytotoxicity after laser irradiation, illustrating that the AuNR-PEG solution also possessed remarkable photothermal cytotoxicity after modification. It was also confirmed by the figure from qualitative examination of the photothermal ablation effect on tumor cells in vitro ().
Figure 18. Photothermal effect of AuNR-PEG and AuNR to 4T1 cells after 24 h incubation in vitro (n = 3, ****p < 0.0001; ns, no significant difference).

Figure 19. Photothermal ablation of tumor cells (live/dead cell staining images of tumor cells A: the group of negative control laser or not laser; B: the group of AuNR laser or not laser; C: the group of AuNR-PEG laser or not laser) Scale bar: 100 μm.

3.12. In vitro tumor immune effect
After extracting DC cells from the bone marrow of BALB/c mice, we measured the rate of positive expression of costimulatory factor CD11c on the surface of DCs, and the positive expression rate reached 95.0%, indicating that the extraction and culture of bone marrow-derived DCs successful ().
Figure 20. Morphological changes of DCs during culture (A: 1 day after culture (×10); B: 3 days after culture (×10); C: 5 days after culture (×10); D: 1 day after culture (×20); B: 3 days after culture (×20); C: 5 days after culture (×20)) Scale bar: 100 μm.

Figure 21. Flow cytometry image of the expression of costimulatory factors CD11c of DCs.

The surface of mature DCs highly expresses costimulatory molecules (CD80, CD86), which provide the necessary second signal for activating T cells, thus activating the body’s immune response. To verify that the immunogenic material produced by 4T1 cells treated with the photothermal agent and laser irradiation could promote DCs maturation, the DCs and supernatant of 4T1 tumor cells treated with the photothermal agent were cocultured for in vitro DC activation assay. Flow cytometry results were analyzed by flowjo software (). Compared with the negative control group, the positive expression of CD80 and CD86 in the negative control group treated with laser irradiation reached 75%. It was illustrated that laser irradiation increased the production of tumor-associated antigens by tumor cells to promote the maturation of DCs (). Moreover, the supernatant of tumor cells increased the DCs maturation rate to 81.6% in the AuNR-PEG group (). After the laser irradiation, in the AuNR-PEG group (), the tumor-associated antigen restimulated DCs’ activation, and the positive expression rate of CD80 and CD86 could be seen rising to 96.7%. It was demonstrated that tumor-associated antigens could be generated by 4T1 cells after being stimulated by two factors, laser and AuNR-PEG solution, thus allowing immature DCs to be activated, and the highest level of activation was observed after treatment with AuNR-PEG solution and laser irradiation.
Figure 22. Activation effect of DCs under different stimuli in vitro (A: the group of negative control without laser; B: the group of negative control + laser; C: the group of AuNR-PEG; D: the group of AuNR-PEG + laser; E: Positive expression rate of different experimental groups (n = 3, *p < 0.05; **p < 0.01; ***p < 0.001; ****p < 0.0001)).

3.13. In vivo anti-tumor effect of tumor immunotherapy combined with photothermal therapy
To analyze tumor growth after a two-week administration, as well as immune effects, tumors and spleens of mice were dissected and studied observably (). It could be seen from the weight of dissected tumor and the size graph the tumors in the anti-PD-1 + AuNR-PEG MN group were significantly reduced compared with those in the saline and anti-PD-1 + AuNR-PEG intratumoral injection group. On the other hand, the spleen is a vital immune organ of the body, and its weight reflects the strength of the immune response. It could be seen from the weight of spleen analysis in that the spleens of mice in the anti-PD-1 MN group received significantly more weight than those in the saline group and anti-PD1 + AuNR-PEG intratumoral injection group. Interestingly, the spleen weight of all MNs administration groups was greater than that of the injection group, indicating that the microneedle administration method could activate the immune response of mice.
Figure 23. Photographs of the tumors excised from euthanized mice on day 13.

Figure 24. Tumor and spleen weight of euthanized mice on day 13 (n = 3).

3.14. In vivo photothermal ablation properties of tumor
Near-infrared laser irradiation (808 nm, 2 W/cm2) was performed for 2 minutes in different experimental groups, and the temperature change of the tumor site was shown in , it can be found that the temperature of the mouse tumor site of the Blank MN group has unchanged within 2 minutes; The temperature changes of tumor sites in the AuNR MN group, AuNR-PEG MN group and anti-PD-1 + AuNR-PEG MN group were the same, all determined by body temperature 38 °C rises to about 45 ± 1 °C; It was indicated that the photothermal agent microneedle patch could cause the temperature of the tumor site to rise when applied to the tumor site of mice, which was conducive to photothermal ablation. In comparison with anti PD-1 + AuNR-PEG injection group, it can be seen that although the photothermal temperature increase in this group within 2 minutes is similar to the previous groups, the photothermal heating site of this group is smaller than that of the microneedle group, it is because the photothermal agent in the injection group circulates slowly at the tumor site, which is mainly concentrated at a certain point, resulting in the whole solid tumor site not all heating up, thus affecting the photothermal effect.
Figure 25. Tumor site heating diagram of tumor-bearing mice within 2 minutes after laser irradiation.

3.15. Mechanism of tumor immunotherapy combined with photothermal therapy
We measured the expression of immune factors TNF-α, IL-6, and IFN-γ in serum. As shown in , TNF-α, IL-6, and IFN-γ expression in the anti-PD-1 + AuNR-PEG MN group were significantly higher than in other groups. TNF-α expression in all MN-administrated groups could also be found to be more elevated than that in the intratumoral injection administration group. The expression of TNF-α and IL-6 in the anti-PD-1 MN group was higher than that of other groups. TNF-α can activate neutrophils and lymphocytes, and the IL-6 factor can stimulate the cells involved in the immune response to proliferate, differentiate and improve their function. It has been well documented that photothermal therapy can induce IFN-γ secretion, which in turn induces the expression of indoleamine 2,3-dioxygenase IDO by antigen-presenting cells (APCs) and tumor cells. Accordingly, our delivery system may enhance anti-tumor ability by promoting the expression of immune factors.
Figure 26. TNF-α, IL-6, and IFN-γ Levels in the serum of mice detected using ELISA assay (n = 3, *p < 0.05) (G1) Saline, (G2) anti-PD-1 + AuNR-PEG injection, (G3) blank MN, (G4) anti-PD-1 MN, (G5) AuNR-PEG MN group, (G6) anti-PD-1 + AuNR-PEG MN.

To explore the mechanism of immunotherapy in tumor-bearing mice, we performed flow cytometry analysis of T lymphocyte content in mice spleens. As shown in , it could be found that after the treatment of all MN groups, the proportion of CD3+ T lymphocytes in the spleen lymphocytes of mice was higher than that of the saline group. Remarkably, the proportion of CD3+ T lymphocytes in the blank MN group was about 10% higher than that of the saline group, which indicated that the transcutaneous immunization modality using microneedles could effectively activate T lymphocytes and enhance the infiltration of T lymphocytes in spleen tissue. It was further found that the mice of the anti-PD-1 MN group had the highest proportion of CD3+ T lymphocytes. This set of experimental results was consistent with the expression of TNF-α in the previously described ELISA analysis.
Figure 27. The amount of CD3+ T cells in spleen tissue isolated from mice with flow cytometry after 13 days of treatments.

In addition, we performed a flow cytometry analysis of the percentages of CD4+ T lymphocytes and CD8+ T lymphocytes in the CD3+ T lymphocytes, and the results are shown in . It could be seen the CD8+ T lymphocyte ratio reached 30.1% in the anti-PD-1 + AuNR-PEG MN group, 2.4% higher than the saline group, and also 1.6% higher than the intratumoral combined drug delivery group. Moreover, results of various experimental groups for microneedle delivery revealed that the proportion of CD8+ T lymphocytes in Blank MN, anti-PD-1 MN, and AuNR-PEG MN groups were lower than that of the anti-PD-1 + AuNR-PEG MN group. As for the expression in CD4+ T lymphocytes, the differences among various experimental groups were insignificant, and no regular conclusions could be drawn. Overall, the immune system of the mice subjected to the microneedle coadministration was responded to and activated.
Figure 28. The amount of CD4+ CD8+ T cells in spleen tissue isolated from mice with flow cytometry after 13 days of treatments.

4. Conclusion
In conclusion, we constructed a drug delivery system based on a microneedle carrier with satisfactory biocompatibility and can effectively inhibit the growth of early tumors. Owing to the favorable photothermal response of the gold nanorods, the drug delivery system was imparted with the feature of tumor ablation, thereby facilitating the tumor treatment effect of the immune checkpoint blocker anti-PD-1 polypeptide. When encapsulated in MNs, the drug delivery system could promote the transdermal delivery of drugs more accurately and deeply. Additionally, it has been demonstrated that the novel microneedle system combining photothermal therapy and tumor immunotherapy can strongly promote the tumor-killing ability of cytotoxic T lymphocytes and alleviate tumor immune escape. Thus, such photothermal therapy and immunotherapy combined anti-tumor microneedle patch is expected for excellent application prospects in tumor treatments.
Authors’ contributions
Jiaqi Weng, Gensuo Zheng, Jiaoli Wen, Qinying Yan – supported with synthesis, characterization, molecular and biochemical analysis, data curation, formal analysis, and validation. Jing Yang, Xi Zheng – supported with synthesis, characterization, formal analysis, and validation. Qingliang Yang – review and editing. Qinying Yan, Qingliang Yang – helped with supervising the research. The manuscript was written through the contributions of all authors and was approved by all authors.
Consent for publication
All authors consent for publication.
Ethics approval and consent to participate
The goal of the current study was to eliminate tumors by stimulating the body’s immune system. There are no substitutes for mimicking the immune system at the moment because of its complexity. The most efficient and necessary method in this investigation to confirm the therapeutic effect of the microneedle delivery device on tumor immunity is therefore animal model validation. In our study, 80 4 ∼ 6-week BALB/c mice were supplied by the Zhejiang Academy of Medical Sciences (Zhejiang, China) and carefully housed in the Laboratory Animal Center of Zhejiang University of Technology (Zhejiang, China) under constant temperature and humidity. All mice were utilized in vivo experiments after being given Isoflurane anesthesia.These experiments were approved by Zhejiang University of Technology Laboratory Animal Ethics Committee, affiliated to Zhejiang University of Technology (Approval number, 20211018081), and at the conclusion of the study, all mice were decollated and put to death. All animal experiments were performed following the ARRIVE guidelines.
Availability of data and materials
All data generated or analyzed during this study are included in this submitted article. The raw data will be made available on request.
Disclosure statement
No potential conflict of interest was reported by the authors.
Additional information
Funding
References
- Carreno BM, Magrini V, Becker-Hapak M, et al. (2015). A dendritic cell vaccine increases the breadth and diversity of melanoma neoantigen-specific T cells. Science 348:1–19. doi: 10.1126/science.aaa3828.
- Chen MC, Ling MH, Wang KW, et al. (2015). Near-infrared light-responsive composite microneedles for on-demand transdermal drug delivery. Biomacromolecules 16:1598–607. doi: 10.1021/acs.biomac.5b00185.
- Chevolet I, Speeckaert R, Schreuer M, et al. (2015). Characterization of the in vivo immune network of IDO, tryptophan metabolism, PD-L1, and CTLA-4 in circulating immune cells in melanoma. Oncoimmunology 4:e982382. doi: 10.4161/2162402X.2014.982382.
- Courtenay AJ, McCrudden MTC, McAvoy KJ, et al. (2018). Microneedle-mediated transdermal delivery of bevacizumab. Mol Pharm 15:3545–56. doi: 10.1021/acs.molpharmaceut.8b00544.
- Deng ZT, Jiang C, Younis MR, et al. (2021). Mild hyperthermia-enhanced chemo-photothermal synergistic therapy using doxorubicin-loaded gold nanovesicles. Chin Chem Lett 32:2411–4. doi: 10.1016/j.cclet.2021.03.080.
- Dholaria B, Hammond W, Shreders A, et al. (2016). Emerging therapeutic agents for lung cancer. J Hematol Oncol 9:138. doi: 10.1186/s13045-016-0365-z.
- Gao P, Wang H, Cheng YY. (2022). Strategies for efficient photothermal therapy at mild temperatures: progresses and challenges. Chin Chem Lett 33:575–86. doi: 10.1016/j.cclet.2021.08.023.
- Hamdan IMN, Tekko IA, Matchett KB, et al. (2018). Intradermal delivery of a near-infrared photosensitizer using dissolving microneedle arrays. J Pharm Sci 107:2439–50. doi: 10.1016/j.xphs.2018.05.017.
- Hao Y, Dong ML, Zhang TY, et al. (2017). Novel approach of using near-infrared responsive PEGylated gold nanorod coated poly(L-lactide) microneedles to enhance the antitumor efficiency of docetaxel-loaded MPEG-PDLLA micelles for treating an A431 tumor. ACS Appl Mater Interfaces 9:15317–27. doi: 10.1021/acsami.7b03604.
- Jiang N, Zhou ZG, Xiong W, et al. (2021). Tumor microenvironment triggered local oxygen generation and photosensitizer release from manganese dioxide mineralized albumin-ICG nanocomplex to amplify photodynamic immunotherapy efficacy. Chin Chem Lett 32:3948–53. doi: 10.1016/j.cclet.2021.06.053.
- Karande P, Mitragotri S. (2010). Transcutaneous immunization: an overview of advantages, disease targets, vaccines, and delivery technologies. Annu Rev Chem Biomol Eng 1:175–201. doi: 10.1146/annurev-chembioeng-073009-100948.
- Kennedy JC, Pottier RH, Pross DC. (1990). Photodynamic therapy with endogenous protoporphyrin.9. J Photochem Photobiol B 6:143–8. doi: 10.1016/1011-1344(90)85083-9.
- Lai BH, Chen DH. (2013). LaB6 nanoparticles with carbon-doped silica coating for fluorescence imaging and near-IR photothermal therapy of cancer cells. Acta Biomater 9:7556–63. doi: 10.1016/j.actbio.2013.03.034.
- Liu XS, Huang N, Li H, et al. (2014). Multidentate polyethylene glycol modified gold nanorods for in vivo near-infrared photothermal cancer therapy. ACS Appl Mater Interfaces 6:5657–68. doi: 10.1021/am5001823.
- Pardoll DM. (2012). The blockade of immune checkpoints in cancer immunotherapy. Nat Rev Cancer 12:252–64. doi: 10.1038/nrc3239.
- Park JH, von Maltzahn G, Xu MJ, et al. (2010). Cooperative nanomaterial system to sensitize, target, and treat tumors. Proc Natl Acad Sci U S A 107:981–6. doi: 10.1073/pnas.0909565107.
- Qin J, Wang X, Fan G, et al. (2022a). Recent advances in nanodrug delivery system for tumor combination treatment based on photothermal therapy. Adv Therapeut 6:200–18. doi: 10.1002/adtp.202200218.
- Qin J, Zhang J, Fan G, et al. (2022b). Cold atmospheric plasma activates selective photothermal therapy of cancer. Molecules 27:5941. doi: 10.3390/molecules27185941.
- Schumacher TN, Schreiber RD. (2015). Neoantigens in cancer immunotherapy. Science 348:69–74. doi: 10.1126/science.aaa4971.
- Sharma P, Allison JP. (2015). The future of immune checkpoint therapy. Science 348:56–61. doi: 10.1126/science.aaa8172.
- Syn NL, Teng MWL, Mok TSK, et al. (2017). De-novo and acquired resistance to immune checkpoint targeting. Lancet Oncol 18:E731–e741. doi: 10.1016/S1470-2045(17)30607-1.
- Tan SZ, Li DP, Zhu X. (2020). Cancer immunotherapy: pros, cons and beyond. Biomed Pharmacother 124:109821. doi: 10.1016/j.biopha.2020.109821.
- Tham HP, Xu KM, Lim WQ, et al. (2018). Microneedle-assisted topical delivery of photodynamically active mesoporous formulation for combination therapy of deep-seated melanoma. Acs Nano 12:11936–48. doi: 10.1021/acsnano.8b03007.
- Wang C, Ye YQ, Hochu GM, et al. (2016). Enhanced cancer immunotherapy by microneedle patch-assisted delivery of anti-PD1 antibody. Nano Lett 16:2334–40. doi: 10.1021/acs.nanolett.5b05030.
- Yagi H, Hashizume H, Horibe T, et al. (2006). Induction of therapeutically relevant cytotoxic T lymphocytes in humans by percutaneous peptide immunization. Cancer Res 66:10136–44. doi: 10.1158/0008-5472.CAN-06-1029.
- Yang YP. (2015). Cancer immunotherapy: harnessing the immune system to battle cancer. J Clin Invest 125:3335–7. doi: 10.1172/JCI83871.
- Ye YQ, Wang JQ, Hu QY, et al. (2016). Synergistic Transcutaneous Immunotherapy Enhances Antitumor Immune Responses through Delivery of Checkpoint Inhibitors. Acs Nano 10:8956–63. doi: 10.1021/acsnano.6b04989.
- Yu JC, Zhang YQ, Kahkoska AR, et al. (2017). Bioresponsive transcutaneous patches. Curr Opin Biotechnol 48:28–32. doi: 10.1016/j.copbio.2017.03.001.
- Zhao L, Jiang M, Xu Z, et al. (2022a). Selective thermotherapy of tumor by self-regulating photothermal conversion system. J Colloid Interface Sci 605:752–65. doi: 10.1016/j.jcis.2021.07.134.
- Zhao L, Wang X, Lou H, et al. (2022b). Buffet-style Cu(II) for enhance disulfiram-based cancer therapy. J Colloid Interface Sci 624:734–46. doi: 10.1016/j.jcis.2022.06.009.
- Zhao L, Zhang X, Wang X, et al. (2021). Recent advances in selective photothermal therapy of tumor. J Nanobiotechnology 19:335. doi: 10.1186/s12951-021-01080-3.
- Zhao ZM, Ukidve A, Dasgupta A, et al. (2018). Transdermal immunomodulation: Principles, advances and perspectives. Adv Drug Deliv Rev 127:3–19. doi: 10.1016/j.addr.2018.03.010.
- Zou WP, Wolchok JD, Chen LP. (2016). PD-L1 (B7-H1) and PD-1 pathway blockade for cancer therapy: mechanisms, response biomarkers, and combinations. Sci Transl Med 8:238–53. doi: 10.1126/scitranslmed.aad7118.