
 ?Mathematical formulae have been encoded as MathML and are displayed in this HTML version using MathJax in order to improve their display. Uncheck the box to turn MathJax off. This feature requires Javascript. Click on a formula to zoom.
Abstract
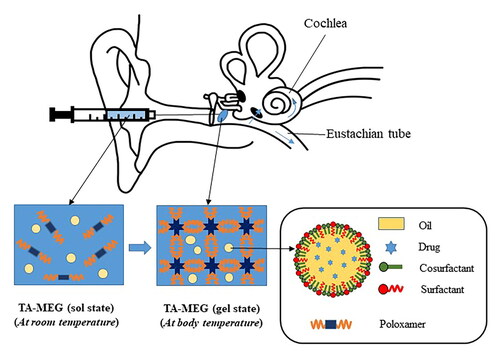
Intratympanic administration for the delivery of steroids has been extensively studied but limited because of low permeability of the drug through the row window membrane. Here, to effectively deliver poorly soluble triamcinolone acetonide (TA), microemulsions (ME) were prepared from Capmul MCM (oil), Cremophor RH40 (surfactant), and tetraglycol (cosurfactant) based on solubility studies, emulsifying ability test, and pseudoternary phase diagrams. Microemulsion gel (MEG) was prepared by mixing TA-ME with a poloxamer hydrogel base. The physicochemical properties of ME and MEG formulations were characterized, and the toxicity and oto-protective effectiveness were evaluated in vitro and in vivo. The ME-3 formulation showed a small droplet size (16.5 ± 0.2 nm), narrow PDI (0.067 ± 0.041), and enhanced TA solubility (2619.7 ± 57.6 μg/g). The optimized MEG demonstrated temperature-dependent gelation with a gelation time of 208 ± 10 sec at 37 °C. Slow degradation of the gel matrix sustained release of TA from MEG compared to the ME formulation. Both TA-ME and TA-MEG were found to be nontoxic to NIH3T3 cells at the test concentrations (0 to 5 µg/mL), and biocompatible after intratympanic administration to mice. The incorporation of ME into thermosensitive hydrogels prolonged retention of TA at the site of administration until 6 days. As a consequence, the enhanced drug absorption into the cochlea in TA-MEG group (approximately 2 times higher than other groups) protected hair cells, spiral ganglion neurons, and stria vascular cells from cisplatin-induced damage. Therefore, this injectable TA-loaded MEG is an effective and safe vehicle for the sustained delivery of triamcinolone acetonide into the inner ear.
Graphical Abstract
1. Introduction
Hearing is one of the most important senses, as it allows humans to be aware of surrounding airborne sounds. The cochlea is an organ dedicated to hearing that transfers mechanical stimuli as electrical signals and then transduces them to the brain, where they can be processed to cause auditory sensation (Brownell, Citation1997; Fettiplace, Citation2017; Sohmer, Citation1997). Any damage to the sensory hair cells or auditory nerves of the cochlea caused by external stimuli (such as excessive noise (Yang & Chung, Citation2016), infection (Cohen et al., Citation2014) or ototoxic drugs (Rizk et al., Citation2020)) or intrinsic causes such as genetic mutations (Vona & Haaf, Citation2016), aging (Cardin, Citation2016) and Meniere’s disease (Gacek, Citation2021) gives rise to sensorineural hearing loss (SNHL), the most frequent inner ear impairment in humans. However, the treatment of SNHL has been challenging, as it is difficult to achieve therapeutic drug concentrations in the inner ear due to anatomical and physiological barriers. Poor penetration of the blood-labyrinth barrier that separates the blood from the inner ear fluids and the limited blood supply to the inner ear leads to subtherapeutic concentrations of drugs after systemic administration (Nyberg et al., Citation2019). Compared to systemic administration, intratympanic (IT) administration not only offers higher levels of drug in the perilymph but also minimizes undesired systemic side effects (Bird et al., Citation2011). This makes drug delivery via the IT route more attractive in the treatment of inner ear disorders.
IT administration is the direct injection of a drug into the middle ear cavity for its diffusion into the inner ear through the round window membrane (RWM) and oval window membrane (OWM), two openings from the middle ear to inner ear (Dindelegan et al., Citation2022). To date, the diffusion of drug from middle ear into inner ear mainly attributed to RWM or OWM remains unclear. However, since RWM has been mainly studied in many publications, this study focused on RWM diffusion. Although IT administration has advantages over systemic drug administration in terms of perilymphatic concentration, drug levels in the inner ear fluid after a single IT injection of a conventional solution or suspension often remain below the therapeutic threshold due to the limited permeability of the drug through the RWM and drug drainage through the Eustachian tube (Salt & Plontke, Citation2018). This phenomenon usually requires repeated bolus applications 2–5 times per week (Alles et al., Citation2006), which induces perforation of the tympanic membrane as well as other typical, unpleasant side effects in treated patients (Rauch, Citation2011). Therefore, the development of drug delivery systems that improve the permeability of drugs through RWM as well as provide sustained release of the drugs into the inner ear has received much attention. To increase the retention time of drug in the RWM, hydrogels were investigated on the basis of their high viscosity that prolongs retention time (Hasan et al., Citation2021; Nguyen & Park, Citation2023). In addition, nanocarriers can be used to facilitate drug penetration through the RWM (Pyykkö et al., Citation2011). The incorporation of nanocarriers into hydrogels appears to be a promising strategy that allows a synergistic effect in the control of drug delivery because this combination takes the advantages of both hydrogel system and nanoparticle system as well as overcomes the drawbacks of each system used alone (Hasan et al., Citation2021; Szeto et al., Citation2020). In light of this hypothesis, we aimed to study a combined system composed of a microemulsion and an in situ thermosensitive hydrogel for the drug delivery into the inner ear.
Microemulsions (MEs) are transparent, isotropic, less viscous, and thermodynamically stable systems composed of an oil phase, a surfactant, a cosurfactant, and an aqueous phase in appropriate proportions. MEs are considered promising carriers for the transdermal delivery of poorly water-soluble drugs due to their small droplet size (ranging from 20 to 200 nm), long shelf life, high solubilization capacity, permeation-enhancing effect, and spontaneous formation suitable for large-scale production (Shah, Citation2021; Talegaonkar et al., Citation2008).
In situ thermosensitive hydrogels with unique temperature-dependent viscosity control properties make them more attractive for the development of injectable systems for intratympanic applications due to their easy injectability and prolonged retention time. These gelling systems can be formed from poloxamers, which are synthetic triblock copolymers composed of a central hydrophobic chain (polypropylene glycol) and two hydrophilic chains (polyethylene glycol). Upon heating, the critical micelle concentration and the critical gel concentration decrease, resulting in gelation of the thermosensitive copolymer solution (Fakhari et al., Citation2017; Gong et al., Citation2012; Russo & Villa, Citation2019). Hydrogels generated from poloxamer 407 (P407), which are liquid at room temperature and form a gel at body temperature, have been extensively investigated for intratympanic administration with several therapeutic agents (such as dexamethasone, methylprednisolone, triamcinolone, and N-acetyl cysteine) and have been reported to be oto-compatible (Engleder et al., Citation2014; Gausterer et al., Citation2020; Honeder et al., Citation2014; Piu et al., Citation2011; Wang et al., Citation2009, Citation2011a).
The incorporation of MEs into hydrogels to obtain microemulsion gels (MEGs) appears to be a promising strategy to overcome the obstacles posed by the low viscosity of MEs (Lawrence & Rees, Citation2000). When applied for inner ear drug delivery, MEs have the advantage of improving drug permeability through the RWM, and hydrogels can enhance the retention time of the MEs in the middle ear, thereby increasing the drug concentration in the cochlea and providing sustained drug delivery to the inner ear.
Due to the reduction in proinflammatory cytokines in cochlear hair cells (Kurabi et al., Citation2017) and modulation of the level of the enzyme Na+/K+-ATPase in the stria vascularis (Curtis et al., Citation1993; Ross et al., Citation1982; Takeda et al., Citation2020), corticoids have been used to treat hearing disorders since the 1950s, and to date, they have been the standard therapy for various forms of hearing loss (including autoimmune inner ear disease, sudden hearing loss, and Meniére’s disease) for over 70 years (Trune & Canlon, Citation2012). The effectiveness of intratympanic corticoid therapy for the treatment of SNHL patients was first reported in 1996 by Silverstein et al. (Silverstein et al., Citation1996). Since then, much evidence has reported about the efficacy of this administration route to deliver corticoids in both animal and clinical studies. To the best of our knowledge, the protective effect of triamcinolone acetonide (TA) against hearing loss is well established (Dahm et al., Citation2019; Guzman et al., Citation2006; Jumaily et al., Citation2017); however, studies related to the development of intratympanic drug delivery systems containing TA are still limited.
In the present study, we designed a drug delivery system to the inner ear based on the combination of a temperature-sensitive poloxamer hydrogel and a microemulsion containing TA, then evaluated its effectiveness and safety. In vitro studies were first performed to optimize the preparation of the microemulsion (ME) and microemulsion gel (MEG). Subsequently, we carried out in vitro and in vivo experiments to demonstrate the superior potential of the MEG to offer sustained delivery of TA to the inner ear versus the use of the ME or hydrogel alone. In addition, the biodistribution in the inner ear tissues and biocompatibility were examined. Finally, we investigated whether the designed drug delivery system exhibited the potential to protect the inner ear from cisplatin-induced hearing loss in mice.
2. Materials and methods
2.1. Materials
Triamcinolone acetonide (TA), linoleic acid, Span 85, tyloxapol, Tween 80, Cremophor RH40 (PEG-40 hydrogenated castor oil), propylene glycol (PG), Transcutol P (diethylene glycol ethyl ether), tetraglycol, 3-(4,5-dimethylthiazol-2-yl)-2,5-diphenyl tetrazolium bromide (MTT), cisplatin, and rhodamine B were purchased from Sigma-Aldrich (St. Louis, MO, USA). Capmul MCM (glyceryl caprylate/caprate) was obtained from Abitec Corporation (Columbus, OH, USA). Labrafil M1944 CS (oleoyl macrogol-6 glycerides) and Labrasol were purchased from Gattefossé (Saint-Priest, Cedex, France). Oleic acid, cotton oil, linseed oil, olive oil, castor oil, Tween 20, ethanol, and ether were provided by Samchun Chemical (Pyungtaek, South Korea). Glycerin, isopropanol, and polyethylene glycol 400 (PEG 400) were provided by Daejung Chemical (Siheung, South Korea). Poloxamer 407 (Kolliphor® P407) and poloxamer 188 (Kolliphor® P188) were purchased from BASF (Ludwigshafen, Germany). Phosphate-buffered saline (PBS), fetal bovine serum (FBS), antibiotics (penicillin/streptomycin), and Dulbecco’s modified Eagle’s medium (DMEM) were purchased from HyClone (Logan, UT, USA).
2.2. HPLC method for drug content determination
The TA content in all samples was determined by using reverse-phase high-performance liquid chromatography (HPLC, Shimadzu, Kyoto, Japan). The HPLC parameters for analyzing the concentration of TA referenced from USP43-NF38, with the stationary phase being a C18 column (150 × 4.6 mm, 5 μm particle size, Shiseido), and the mobile phase being a mixture of acetonitrile and water in a 30/70 v/v proportion. The column temperature was maintained at 40 °C, the mobile phase was pumped into the column at a flow rate of 1 mL/min, and the volume of the injected sample was 20 μL. TA was quantified by UV detection at 254 nm. The system suitability and standard curve of TA were determined to control the quality of the overall experiment.
2.3. Preparation of the microemulsion
2.3.1. Screening excipients
2.3.1.1. Solubility study
In the solubility tests, the saturated solubility of TA in various vehicles (oils, surfactants, and cosurfactants) was determined by adding an excess of TA to 1 g of each vehicle in an Eppendorf tube. After vortexing thoroughly, all samples were kept in an orbital shaker at 25 ± 0.5 °C at 100 rpm for 72 h. Then, the mixtures were removed from the shaker and centrifuged at 12,000 rpm for 10 min to separate the undissolved drug. After dilution with isopropanol, the supernatant was analyzed by the HPLC method described above. Experiments were performed in triplicate.
2.3.1.2. Emulsifying ability testing
Briefly, an isotropic mixture of oil and surfactant at a 1:1 weight ratio was prepared by homogenizing 300 mg of the selected oil and 300 mg of surfactant at room temperature with stirring. Then, 50 mg of the oil/surfactant mixture was accurately weighed and diluted with 50 mL of distilled water to obtain a fine dispersion system. After dilution, the size of the droplets from emulsion was measured, and surfactants were selected based on the smallest droplet size that represented the highest emulsifying capacity.
2.3.1.3. Pseudoternary phase diagrams
The construction of pseudoternary phase diagram of oil, surfactant, cosurfactant, and water was performed by water titration (Talegaonkar et al., Citation2008). First, a mixture of surfactant and cosurfactant was premixed in a weight ratio (Smix). Aliquots of the Smix mixture were combined with oil at various weight ratios (1:9, 2:8, 3:7, 4:6, 5:5, 6:4, 7:3, 8:2, and 9:1 (w/w)) in glass vials under gentle magnetic stirring at ambient temperature. Distilled water was added dropwise to the obtained oil mixture, followed by titration. When water was added, the mixture was visually evaluated for signs of phase separation, and the titration endpoint was the point at which the mixture transitioned from transparent to turbid (Sabale & Vora, Citation2012). The amounts of all three phases were taken as % (w/w), and pseudoternary diagrams were plotted using SigmaPlot 12.5 software. In the phase diagram, the single-phase region was identified as the ME region.
2.3.2. Preparation of TA-loaded microemulsions (TA-MEs)
After selecting an appropriate excipient, the optimum weight ratio of surfactant and cosurfactant (Smix) was determined based on the area of the ME region obtained from the pseudoternary phase diagram. From the results, 15 formulations with different composition ratios within the ME region were selected (). ME formulations were prepared from water and the selected oil (Capmul MCM), surfactant (Cremophor RH40), and cosurfactant (tetraglycol) as a result of the excipient screening experiments with the phase titration method or the spontaneous emulsification method (Mehta et al., Citation2015; Shafiq-un-Nabi et al., Citation2007). In brief, an oil mixture of Capmul MCM, Cremophor RH40, and tetraglycol was premixed prior to the dropwise addition of distilled water. The MEs were further evaluated for their appearance, droplet size, drug solubility, and thermodynamic stability for optimization.
Table 1. Composition of ME formulations.
TA-loaded ME was prepared by dissolving TA in a mixture of Capmul MCM, Cremophor RH40, and tetraglycol under magnetic stirring. Then, instead of water, an appropriate amount of PBS was added dropwise to the mixture with continuous stirring.
2.3.3. Characterization of TA-ME
2.3.3.1. Appearance
The appearances of the MEs prepared with or without TA loading were visually examined for transparency, homogeneity, and consistency.
2.3.3.2. Droplet size and distribution
The droplet sizes of the MEs were measured using a Zetasizer Nano S90 (Malvern Instruments, Malvern, UK) based on the principle of dynamic light scattering (DLS). To obtain the appropriate concentration for optimal measurement as recommended by the instrument manufacturer, 100 mg of each formulation was diluted in 10 mL of distilled water. After dilution, each sample was stored in a disposable cuvette and then measured at 25 °C in triplicate. The mean droplet size was determined and the polydispersity index (PDI) was used as a parameter of size distribution.
2.3.3.3. Drug solubility
The drug solubility of TA in the prepared ME was determined with a method similar to that used for the solubility testing. An excess amount of TA was added to 1 g of each ME in an Eppendorf tube and then was mixed for 24 h at room temperature using a rotator (Rotator AG, FinePCR, Gunpo, South Korea). Afterward, the sample was centrifuged at 12,000 rpm for 10 min and the concentration of TA in the supernatant was analyzed by HPLC. This test was performed 3 times with each ME formulation to obtain the mean value.
2.3.3.4. Thermodynamic stability
Thermodynamic stability was investigated for centrifugation, heating-cooling cycles, and freeze-thaw cycles. In the centrifugation study, the ME formulations were centrifuged at 10,000 rpm for 20 min, and then, the physical instability and droplet size of the formulations were determined (Freitas et al., Citation2021; Hajjar et al., Citation2018). For the heating-cooling cycle test, the ME formulations were treated three times by alternating the temperature between 4 °C and 40 °C with storage at each temperature for no less than 48 h. After each cycle, the ME appearance was observed for physical instability and droplet size was measured. The freeze-thaw cycle experiment was carried out similarly to the heating-cooling cycle test but with three cycles at temperatures between −20 °C and 25 °C (Hosny & Hassan, Citation2014; Thakkar et al., Citation2014).
2.4. Preparation of the microemulsion thermosensitive gels
2.4.1. Preparation of TA-MEG
After selecting the optimized weight ratio of ME and poloxamer gel base (40/60 w/w), and based on the effects of P188, Cremophor RH40, and tetraglycol on gel behavior, 15 MEG formulations () were prepared, and their gelation ability, gelation time and syringeability, and the gel degradation were evaluated to optimize the MEG formulation. Thermosensitive gels were prepared according to the cold method (Giuliano et al., Citation2018; Kim et al., Citation2017). Briefly, poloxamer was slowly added PBS (pH 7.4) at 4–8 °C with stirring. After stirring for 2 h, the mixtures were stored in a refrigerator at 4 °C until the solution became clear to obtain a poloxamer thermosensitive gel. Then, the MEG formulation and TA-MEG formulation were obtained by adding ME or TA-ME into the poloxamer gel base. The TA-MEG formulations were stored at 4 °C overnight prior to use (Engleder et al., Citation2014).
Table 2. Composition of MEG formulations.
2.4.2. Characterization of the MEG
2.4.2.1. Gelation ability
Gelation ability was tested to evaluate the ability of solution state thermosensitive gels to convert to a gel state after exposing to room temperature and body temperature. Here, a 15 mL conical tube containing 4 g of each test sample was placed in an orbital shaker, and the experiment was conducted without shaking. The temperature was set to 30 ± 0.5 °C and 37 ± 0.5 °C to evaluate the gelation ability at room temperature and body temperature, respectively. Each formulation was kept at each temperature to set for 15 min, and gelation was checked by inverting the tubes.
2.4.2.2. Gelation time
The tube inversion method was used to determine the gelation time of the samples (Engleder et al., Citation2014; Kim et al., Citation2021). First, 4 g of a precooled (4 °C) sample was placed in a 15 mL conical tube. Then the sample tube was kept in a water bath (VS-1250W, Vision Scientific, Daejeon, South Korea) set at 37 ± 0.5 °C, and gelation of the solution was visually observed by inverting the tube. By measuring with a stopwatch, the gelation time was determined as the time at which the solution was no longer fluid.
2.4.2.3. Syringeability
The syringeability test was designed to measure the time required to expel a fixed amount of sample through a syringe with a constant force (Augusthy et al., Citation2017; Casiraghi et al., Citation2020). Testing was performed using a 5 mL syringe and a weight of 370 g. After 1 mL of each gel sample was taken up into a syringe, a 2 P-clamp was used to fix the syringe, and then a weight was placed on the syringe piston. The time it took for the gel to be expelled through the syringe from the 1 mL line to the 0.5 mL line was measured and taken as the syringeability time.
2.4.2.4. Gel degradation
Exact amounts (0.25, 0.5, 0.75, and 1 g) of sample in liquid solution were weighed into 15 mL conical tubes. Then, the tubes were kept in an orbital shaker set at 37 ± 0.5 °C at 100 rpm. After each sample was converted into gel, 10 mL of prewarmed PBS was added to each tube, and the time required for the gel in each tube to completely decompose was measured.
2.5. In vitro release study
In vitro drug release was evaluated using a transdermal diffusion cell system (Logan Instruments, Somerset, NJ, USA). Experiments were performed in the optimal medium (PBS containing 5% Tween 80) and the optimal dialysis membrane (100 kDa MWCO) was selected for the condition optimization test. Briefly, after presoaking in DW and rinsing thoroughly, the dialysis membrane was fixed between the donor chamber and the receptor chamber. The acceptor chamber was filled with 12 mL of the selected medium, and 1 mL of the TA solution (TA-Sol), TA-ME or TA-MEG formulations was added to the donor chamber. The temperature of the medium was maintained at 37 °C by circulating water with stirring at 200 rpm. At predetermined times (1, 2, 4, 8, 12, 24, 48, 72, 96 h), 0.5 mL of sample was withdrawn and replaced with an equal volume of prewarmed fresh medium. All samples were analyzed using HPLC, and each experiment was repeated 3 times.
2.6. Stability study
For long-term stability, the initial characteristics of TA-MEG were analyzed immediately after production and this batch (in silanized glass vials) was stored in a refrigerator at 4 °C. Samples were withdrawn after 1 and 3 months to assess drug content, gelation time, syringeability, and in vitro drug release (the evaluation methods are described above).
2.7. Cell study
2.7.1. Cell culture
Immortalized embryonic mouse fibroblast NIH3T3 cells supplied by the Korean Cell Line Bank (KCLB No. 21658; KCLB, Seoul, Korea) were selected for the cell viability test. NIH3T3 cells were cultured in DMEM containing 10% fetal bovine serum (FBS) and 1% penicillin/streptomycin (100 IU/mL penicillin G sodium and 100 μg/mL streptomycin sulfate) in an incubator (BB15 CO2 incubator, Thermo Scientific, Waltham, MA, USA) at 37 °C in a humidified atmosphere with 5% CO2 supplement.
2.7.2. Cell viability
Cell viability was studied to investigate the safety of the test formulations, including the API and all excipients. In this study, the MTT assay was applied to evaluate the cytotoxicity of TA-Sol, TA-ME, and TA-MEG in the NIH3T3 cell line. First, 100 μL of cell suspension in growth medium was seeded into each well of a 96-well plate at a density of 104 cells per well. The plates were incubated in an incubator for 24 h to ensure that the cells were in an exponential phase of growth at the time of exposure to the drug. Second, a series of drug concentrations (0.02 to 5 μg/mL) were prepared by diluting TA-Sol, TA-ME and TA-MEG in culture medium and then added to the adhered NIH3T3 cells in the 96-well plates for 24 h. At the end of the drug exposure period, the medium from all wells was removed and replaced with fresh culture medium; cell culture was then continued for an additional 48 h. After incubation, 100 μL of MTT solution (1 mg/mL) was added to achieve a final MTT concentration of 0.5 mg/mL, followed by incubation for 4 h. Then, the MTT solution was removed from the wells and 200 μL of dimethyl sulfoxide (DMSO) was added to each well to dissolve the remaining MTT-formazan crystals. All samples were analyzed immediately by measuring the absorbance at 570 nm with a microplate reader (Sunrise; Tecan Group Ltd., Männedorf, Switzerland). The potential toxicity of each sample was investigated in three independent experiments performed in quadruplicate to calculate the mean and standard deviation.
2.8. Animal studies
2.8.1. Animals
Seven-to-eight-week-old Sprague-Dawley rats weighing 200-250 g were selected for the in vivo pharmacokinetics study, and six-to-eight-week-old C57BL/6 mice weighing 18-22 g were selected for the remaining animal studies, including in vivo retention time, in vivo toxicity, in vivo biodistribution, and in vivo oto-protective effect evaluations. All animals were obtained from Samtako (Osan, South Korea) and kept in a room at 22 °C with 55% relative humidity and controlled light for one week of acclimation before use in the experiments. All procedures were approved by the Ethics Committee of Chungnam National University (protocol no. 202103 A-CNU-041), and were carried out according to the ‘Guidelines in Use of Animal’ approved by Chungnam National University Institutional Animal Care and Use Committee (Daejeon, South Korea).
2.8.2. Intratympanic administration method
Animals were anesthetized with ether via inhalation. The tympanic membrane was perforated in the superior posterior quadrant using 1 mL syringes with 26 G 1/2” needles or micropipette tips, and a certain amount of each formulation was directly administered into the middle ear cavity using the syringes or micropipette tips depending on the injection volume. After application, the animals were held in their position for 10 min to allow the sol-gel transition of the in situ gelling system or to avoid sample clearance from the Eustachian tube (Gausterer et al., Citation2020; Honeder et al., Citation2016). The injection volume was determined based on the volume of the middle ear cavity of each experimental animal. The middle ear volume of an adult mice was reported to be approximately 8 μL (Richter et al., Citation2010), whereas that of an adult rat specimens was 61 μL (Zimmer et al., Citation1994). Therefore, the injection volume for mice and rats was 5 μL and 50 μL, respectively.
TA-Sol, TA-ME, and TA-MEG were prepared at the same TA concentration of 0.887 mg/mL to study in vivo toxicity, in vivo pharmacokinetics, and in vivo oto-protective effects. In addition, the in vivo retention time was measured using the fluorescent agent–rhodamine B (Rho). Rho solution (Rho-Sol), Rho-ME, and Rho-MEG with the same concentration of Rho (1 mg/mL) were also prepared according to the same preparation procedures for the TA-Sol, TA-ME and TA-MEG, respectively.
2.8.3. Fluorescence imaging for evaluation of the in vivo retention time
The retention times of the samples in the middle ear cavity were evaluated in vivo in C57BL/6 mice by fluorescence imaging using Rho as a fluorescent agent with an excitation peak at 549 nm and an emission peak at 576 nm (Moreau et al., Citation2015). A total of 9 mice were divided into 3 groups: Rho-Sol (n = 3), Rho-ME (n = 3), and Rho-MEG (n = 3). Five microliters of each formulation were applied intratympanically as described in Section 2.8.2, and mice were scanned at 6, 24, 48, 72, and 144 h postdose. Signals from Rho were detected using an in vivo imaging system (VISQUE® In Vivo Smart, Vieworks, Anyang, South Korea) and CleVueTM software (Vieworks). The imaging equipment was set up on a lens with an aperture of F2.4 and 1× zoom; the PE filters were an excitation filter of 530-570 nm and an emission filter of 575-640 nm; and a green light exerted middle light intensity. Imaging was focused on the heads of the mice.
2.8.4. In vivo biodistribution in the cochlea
Biodistribution was studied by determining the drug concentration in the cochlea after intratympanic administration to Sprague-Dawley rats. A total of 9 rats were randomly divided into 3 groups (3 rats per group): TA-Sol, TA-ME and TA-MEG. Drug administration was performed as described in Section 2.8.2, and each formulation was directly injected into the middle ear cavity with an equal volume of 50 μL. After 24 h, the cochleae were rapidly harvested from the animals after the rats were euthanized by using ether. To avoid the carry-over of the TA from the middle ear, the collected cochleae was washed 3 times with PBS right after harvested. Then, the collected cochleae were weighed and then divided into small fragments. The cochlear fragments were homogenized in 1 mL of PBS (pH 7.4) using a homogenizer (Omni mixer homogenizer, Omni International, Kennesaw, GA, USA). One milliliter of dexamethasone solution in methanol (1 μg/mL) was added to 1 mL of homogenate and well mixed for extraction. After vortexing for 5 min, the mixture was centrifuged at 4000 rpm for 10 min at 4 °C. The supernatant was centrifuged again at 4000 rpm for 10 min at 4 °C. After the second centrifugation, 1 mL of the supernatant was placed in an Eppendorf tube and dried in an oven at 50 °C to remove residual solvents. The residue was reconstituted by adding 200 μL of methanol, sonicating for 30 min in a bath-type sonicator, and then centrifuging. After centrifugation at 12,000 rpm for 20 min, the supernatant was analyzed by HPLC as described above to determine the TA concentration.
2.8.5. In vivo toxicity
The in vivo toxicity of the formulations after intratympanic administration was assessed using histological analysis. A total of twelve C57BL/6 mice were randomized into 4 groups; control group (saline solution injected): TA-Sol, TA-ME, and TA-MEG (3 mice per group). Mice were treated with 5 μL of each formulation (saline solution, TA-Sol, TA-ME, or TA-MEG). After 2 days of application, the mice were euthanized using ether, and then the cochleae were rapidly harvested and fixed in 4% buffered paraformaldehyde in PBS (pH 7.4) for 48 h at 4 °C and decalcified in 10% EDTA solution for 72–96 h. After softening, the cochleae were washed under running water for 24 h. Before being embedded in a paraffin block, the tissues were passed through a series of alcohol and liquid paraffin. Then, 4-μm-thick sections were cut, stained with hematoxylin and eosin (H&E), and examined under a light microscope (Olympus BX51, Tokyo, Japan) for histological analysis.
2.8.6. In vivo otoprotective effect
The protective effect of the TA formulations against cisplatin-induced ototoxicity was evaluated on the basis of the levels of lesions and deformation in inner ear structure. Fifteen C57BL/6 mice were divided into 5 groups: (1) control group, (2) cisplatin group (saline solution + cisplatin injection), (3) TA-Sol + cisplatin injection, (4) TA-ME + cisplatin injection, and (5) TA-MEG + cisplatin injection (each group contained 4-5 mice). The control group received no injection and was not established with cisplatin–induced ototoxicity model, whereas the other 4 groups received intratympanic injection of the formulations 2 h prior to cisplatin-induced ototoxicity. A cisplatin-induced ototoxicity model was established by intraperitoneal (IP) injection with multiple doses of 3 mg/kg cisplatin over 7 consecutive days (Cai et al., Citation2019; Guo et al., Citation2018; Yu et al., Citation2019). The day after the final injection of cisplatin, the cochleae were harvested by sacrificing the mice for histological analysis according to the procedure described in Section 2.8.5 (in vivo toxicity). Histopathological findings were confirmed in a blinded evaluation by two different pathologists. The lesions were evaluated in stria vascularis (SV) for hyperemia, degeneration and necrosis; in spiral ganglia (SG) for cellular degeneration, cytoplasmic vacuolization; and organ of Corti (OC) was assessed for the structural deformation. The severity of lesions was scored with the semiquantitative scale of none (0), minimal (1), moderate (2), and severe (3), as described in Table S2. The OC scale gives a score of 0 for no structural distortion, 1 for minimal structural deformation, 2 for moderate structural deformation, and 3 for severe structural deformation.
2.9. Statistical analysis
Statistical analysis was performed using SigmaPlot (version 12.0, Systat Software Inc., Palo Alto, CA, USA). The data represent the mean of each group and the standard deviation (SD). The statistical test was ANOVA with Tukey’s posthoc test, and conservative probability values of p < 0.05 (*), p < 0.01 (**), and p < 0.001 (***) were considered statistically significant.
3. Results and discussion
3.1. Optimization of the TA-ME formulation
3.1.1. Screening excipients
The o/w ME system is formed with different components such as the aqueous phase, oil phase, surfactant, and cosurfactant, in appropriate proportions. Therefore, the first thing to do when developing an ME formulation is to determine a suitable oil phase, surfactant, and cosurfactant. The choice of oil phase was based on maximum drug solubility. The surfactant was selected based on the maximum emulsifying capacity for the selected oil phase and the solubilization capacity for TA. In which, the drug solubility potential of the surfactant was considered a sub-criterion because the solvent capacity decreased according to the dilution. The choice of cosurfactant was mainly determined by the area of the ME region obtained from the pseudoternary phase diagrams consisting of the selected oil, surfactant, and different cosurfactants at a fixed weight ratio of surfactant/cosurfactant (Smix) = 1:1. In addition, similar to surfactant screening, drug solubility was also considered as an additional advantage (Shah, Citation2021). The excipient screening results are shown in .
Figure 1. Screening excipients. Solubility of TA in various oils (a), surfactants (B), and cosurfactants (C), respectively. (D) Droplet size of Capmul with different surfactants. (E) Pseudo-ternary phase diagrams for selecting cosurfactants.
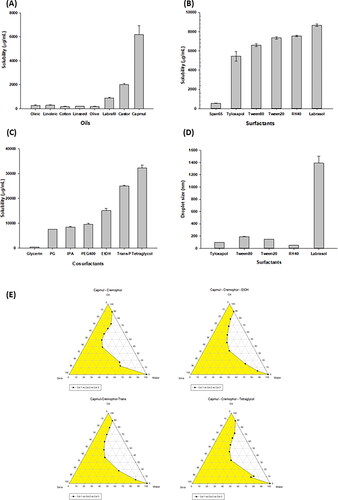
shows the solubility of TA in various oils. Among the 8 types of oil screened, Capmul MCM had the highest drug solubility (6191.8 ± 742.1 μg/g), followed by castor oil (2023.7 ± 90.3 μg/g; approximately 3-fold lower) and Labrafil M1944CS (891.6 ± 47.2 μg/g; approximately 7-fold lower). The 5 remaining oils showed a very low ability to solubilize TA, giving solubility values of less than 300 μg/g. The solubility results of TA in these various oils could be interpreted based on the solute-solvent interaction (Jain et al., Citation2015). The relationship between solute molecules and solvent molecules strongly affects the solubility of a solute in a solvent. A solute dissolves in a solvent when it forms a favorable interaction with the solvent, and the stronger the intermolecular forces between the solute and solvent molecules, the greater the solubility. Structures that contain both electron acceptor groups (-OH) and electron donor groups (-O- or C = O) tend to be soluble in solvents that have both electron donor and acceptor groups (castor oil and Capmul MCM). The highest solubility of TA was in Capmul MCM because of its more flexible structure and lower viscosity compared to castor oil. Therefore, Capmul MCM was chosen as the oil phase for TA-ME formulation development.
From the solubility results of TA in 6 nonionic surfactants (), TA solubility in a Span 85 was only 554.7 ± 18.8 μg/g, and the 5 remaining screened surfactants gave high TA solubility values greater than 5000 μg/g. Therefore, Span 85 was excluded from the evaluation of the surfactant effect. The surfactant effect was assessed by an emulsification ability study, and the droplet size results of the various obtained emulsion systems are shown in . Tyloxapol, Tween 80, Tween 20 and Cremophor RH40 gave transparent dispersion systems with droplet sizes below 200 nm, whereas Labrasol gave a turbid dispersion system with large droplets (1391.7 ± 109.7 nm). Among the surfactants investigated, Cremophor RH40 had the best ability to emulsify Capmul MCM by dispersing into droplets with the smallest size (51.6 ± 1.5 nm) in the aqueous phase. Therefore, Cremophor RH40 was chosen as a suitable surfactant for further study because of its superior emulsifying ability with the selected oil as well as its high potential to solubilize TA. Although Labrasol showed the highest drug solubility, it was not selected because of its poor ability to emulsify with Capmul MCM.
According to the solubility values of TA in the various cosurfactants presented in , the three types of cosurfactants that provided the highest drug solubility (i.e. ethanol, Transcutol P, and tetraglycol) were chosen for constructing a phase diagram with selected oil, surfactant, and water at a fixed Smix of 1:1. presents a pseudoternary phase diagram constructed from Capmul MCM (oil phase), water, and Cremophor RH40 with and without cosurfactant. Compared to the system without cosurfactant, the system with cosurfactant had a larger ME region because cosurfactant addition provides a further decrease in the interfacial tension and an increase in the fluidity of the interfacial surfactant film, which leads to an expansion in the area of the ME system. The three tested cosurfactants did not show significant differences in ME area. An additional selection criterion (drug solubility) was therefore considered, and tetraglycol was chosen due to its highest solubilization potential for TA (32,336.3 ± 1117.1 μg/g).
3.1.2. Determination of optimal Smix
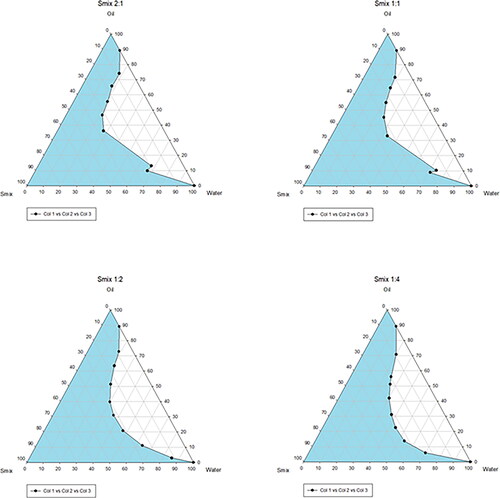
Pseudoternary phase diagrams of Capmul MCM, Cremophor RH40, tetraglycol, and water with various Smix values (1:4, 1:2, 1:1, and 2:1) are shown in . When the surfactant concentration in Smix increased from 1:4 to 1:2 and 1:1, the ME region area increased slightly due to the decrease in interfacial tension. These results are consistent with those obtained by Chiappisi and coworkers (Chiappisi et al., Citation2016). However, when the surfactant concentration was continuously increased (up to Smix 2:1), the ME region did not show significant changes compared to that obtained with Smix 1:1, indicating that optimum emulsification had been achieved (Lin et al., Citation1977). In addition, the use of a large amount of surfactant may cause skin irritation in the site of administration. Therefore, Smix 1:1 was selected for further studies.
Figure 2. Pseudo-ternary phase diagrams for selecting Smix.
3.1.3. Characterization of MEs
3.1.3.1. Appearance
Most of the drug-loaded MEs were transparent, liquids with a homogeneous appearance. Three ME formulations including ME-5, ME-6, and ME-9, were excluded from the study because of their turbidity and phase separation after centrifugation.
3.1.3.2. Droplet size and drug solubility
The results of the droplet size, PDI, and drug solubility studies are shown in . Regarding drug content, it was clear that at a fixed concentration of oil, the drug content decreases as the water content increases. For example, if the content of oil is fixed at 10%, the drug solubilities of ME-1, ME-2, ME-3, ME-15, ME-4, and ME-16 with increasing water content from 30% to 65% were 6630.0 ± 401.1, 4311.7 ± 24.9, 2619.7 ± 57.6, 1827.3 ± 46.5, 1716.0 ± 91.7, and 1323.0 ± 46.6 μg/g, respectively. This tendency is mainly attributed to the solubilization capacity of the cosurfactants. The solubility of TA in the oil–surfactant–cosurfactant–water mixture decreases as Smix decreases with increasing water content. A similar tendency was also observed for formulations using equal portions in Smix. When Smix was fixed, an increase in the water content resulted in a decrease in the drug content due to the reduced solubilization of TA in the oil. For example, when Smix was fixed at 30% for ME-7, ME-8, and ME-4, the drug content decreased from 2635.8 ± 103.7 to 1716.0 ± 91.7 μg/g when the water content increased from 50% to 60%. However, when the water content was fixed, drug solubility decreased and then increased as Smix increased. The reason for this change in drug content is that cosurfactants are also cosolvents and the dominant function of these substances in each formulation is dependent on their concentration.
Table 3. Drug solubility and droplet size of ME formulations (n = 3).
The effect of formulation composition on droplet size and PDI can be explained by phase behavior. According to Chiappisi et al., the phase behavior of oil–Smix–water was identified at five different phase regions including the (i) two-phase region, (ii) water-in-oil ME region (w/o ME), (iii) bicontinuous ME region (BC ME), (iv) oil-in-water ME region (o/w ME), and (v) molecular solution (Chiappisi et al., Citation2016). Changes in droplet size and PDI were observed in each region and in the transition between two different regions with changes in the composition of the mixture (Chiappisi et al., Citation2016; Morales et al., Citation2003).
In addition, the proportion of water in the formulation is critical because MEs with a high water content not only have a lower viscosity but also cause MEG preparation to be easier by adding a polymer to the ME system. Therefore, the formulations (ME-3 and ME-7) with high drug solubility, small droplet size, narrow PDI, and high water content were selected for further thermodynamic stability testing.
3.1.3.3. Thermodynamic stability
The thermodynamic stability of the blank ME-3 and blank ME-7 formulations are shown in . There were no significant changes in the physical appearance of both ME formulations (no phase separation, turbidity, creaming, cracking, or no precipitation) after centrifugation, 3 heating-cooling cycles or 3 freeze-thaw cycles. In addition, the PDIs of the two formulations did not change significantly. However, in the thermodynamic stability study, the droplet size of the ME-7 formulation increased with the number of testing cycles, while there was no significant change in the droplet size of the ME-3 formulation after all testing cycles completed. Therefore, the ME-3 formulation was considered to be physically more stable than the ME-7 formulation.
Table 4. Thermodynamic stability of ME-3 and ME-7 formulations.
The optimal ME formulation had the high drug solubility, a small droplet size, a narrow PDI, and the thermodynamic stability. Compared to ME-7, ME-3 has similar drug solubility but a smaller droplet size, narrower PDI, and greater thermodynamic stability. For this reason, ME-3 was chosen as the optimal ME formulation.
After selecting the optimized ME formulation, TA-ME with a TA concentration of 2 mg/g was prepared and evaluated for its appearance, droplet size, drug content, and thermodynamic stability. The optimized TA-ME formulation was stable after centrifugation, heating–cooling cycle and freeze–thaw cycle tests with a small droplet size (16.7 ± 0.1 nm) and narrow PDI (0.040 ± 0.003).
3.2. Optimization of the MEG formulation
3.2.1. Gelation ability and gelation time
From the results of gelation ability and gelation time shown in , it can be seen that P407 alone cannot form the desirable MEG. In detail, MEG formulations with a P407 concentration of less than 18% are unable to form a viscous gel at 37 °C (i.e. MEG-1 (P407 16%) and MEG-6 (P407 17%)), while MEG-11 with 18% P407 formed a system that exists in a gel state at room temperature. With regard to the control of gel behavior, the incorporation of P407 and P188 was needed. At the P407 concentrations of 16% and 17%, increasing the P188 concentration decreased the gelation time. This may be because the higher the P188 content is, the lower the fluidity. However, at a P407 concentration of 18%, the addition of different amounts of P188 did not significantly affect the gelation time of the system. Among these 15 formulations, 9 formulations that did not gel at 30 °C but did gel at 37 °C were selected for further study (syringeability test).
Table 5. Gelation ability and gelation time of MEG formulations.
3.2.2. Syringeability
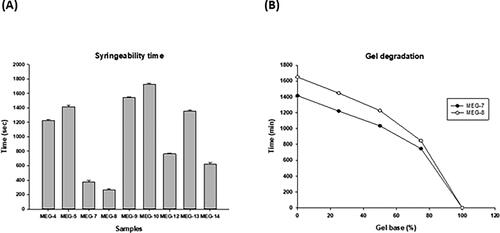
Syringeability, which indicates how easily a dosage form can be injected into the body, plays an important role in clinical application. The syringeability times of the above selected 9 MEG formulations are shown in . The shortest syringeability times belonged to MEG-7 (P407/P188 17%/2%) and MEG-8 (P407/P188 17%/5%), both of which were less than 7 min. The other 7 formulations had syringeability times longer than 10 min, indicating that the injection manipulation operation would be difficult. This result could be attributed to the high viscosity. Consequently, these 7 MEG formulations with long syringeability times were excluded from the following gel degradation study.
Figure 3. Syringeability time and gel degradation of MEG formulations. (A) Syringeability time and (B) gel degradation.
3.2.3. Gel degradation
Two MEG formulations (MEG-7 and MEG-8) with short syringeability times were used in the gel degradation study, and the relationship between gel degradation level and time is shown in . The results indicated that MEG-7, which contained a lower P188 concentration than MEG-8 (2% and 5% respectively), was degraded at a faster rate than MEG-8. The times required for the degradation of the 25%, 50%, 75%, and 100% gel matrix of MEG-7 were 746.7 ± 5.8, 1034.7 ± 5.5, 1221.7 ± 3.6, and 1415.3 ± 4.5 min, respectively, while those of MEG-8 were 846.3 ± 3.2, 1228.3 ± 5.8, 1448.3 ± 2.9, and 1649.3 ± 4.0 min, respectively. There were significant differences in the degradation times between the two formulations at all degradation proportions tested, with p values < 0.001 analyzed by using a T-test in SigmaPlot. A longer degradation time means prolonged retention of the gelling system at the site of administration as well as controlled drug release.
The optimal MEG formulation gelled immediately upon exposure to body temperature without gelation at room temperature due to the appropriate gelation time, short syringeability time, and slow gel degradation. From the in vitro data obtained, a system formed by mixing ME and poloxamer solutions (containing 17% P407 and 5% P188) at a weight ratio of 40/60 (w/w) was selected as the optimal MEG formulation.
After selecting the optimized MEG formulation, TA-MEG was prepared by adding 2 mg/g TA-ME to the hydrogel base to form TA-MEG with a final concentration of 0.8 mg/g. The optimized TA-MEG has many advantages that that would be acceptable to patients: (i) good appearance (transparent and homogeneous); (ii) easy production because it does not gel at room temperature and is in a liquid state; (iii) ease of intratympanic administration via injection due to high fluidity, which was demonstrated by the short syringeability time (270 ± 13 sec); and (iv) prolonged retention in the middle ear cavity because of gelation in a short time (208 ± 10 sec) after exposure to body temperature, leading to increased therapeutic efficiency and reduced frequency of administration.
3.3. In vitro release
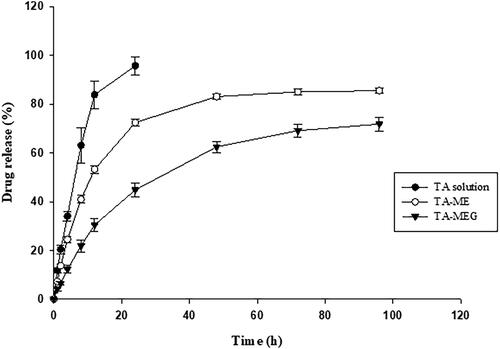
The in vitro release profiles of different formulations (TA-Sol, TA-ME, and TA-MEG) are illustrated in . Drug release values from TA-ME and TA-MEG were compared, and TA-Sol was also included to demonstrate the ability of ME and MEG to control the release. TA-Sol showed the fastest release, which was complete within 24 h, whereas TA-ME and TA-MEG showed sustained release behavior, releasing 85.6 ± 0.9% and 71.9 ± 2.8% over 96 h, respectively. The percentages of drug release after 24 h from the three tested formulations were significantly different, with p values < 0.001 using one-way ANOVA with Tukey’s posthoc test. There was significantly lower drug release from TA-MEG at 96 h compared to TA-ME (p < 0.001 using T test), demonstrating more prolonged release from MEG compared to ME. These comparative release profiles are consistent with the results of Chen et al. (Chen et al., Citation2019) and Wang et al. (Wang et al., Citation2016). The sustained release properties of ME have been reported to be due to their resistance to the oil phase (Tenjarla, Citation1999), whereas this property of poloxamer hydrogels is facilitated by the entrapment of hydrophobic drugs into the inner core of the gelling matrix (Russo & Villa, Citation2019). When ME was entrapped in the hydrogel base of poloxamer to form MEG, the combination of the properties of these two systems resulted in a greater sustained release of the drug.
Figure 4. Drug release profiles of TA-Sol, TA-ME, and TA-MEG (mean ± SD, n = 3).
To study the TA release mechanism from the optimized formulations, experimental data were fitted to some mathematical models describing different release kinetics, such as the zero-order, first-order, Higuchi, Korsmeyer-Peppas, and Hixson-Crowell models. A suitable mathematical model can be selected based on the correlation coefficient (R2). However, the values of R2 increases as the number of parameters increases. Therefore, R2 can only be used for comparing different models with the same number of parameters. The adjusted correlation coefficient (R2adjusted) should therefore be used to select the best-fitting model. In addition to R2adjusted, the Akaike information criterion (AIC) also widely used for evaluating release models, and the mathematical model with the smallest AIC value is the best model for the experimental data.
Equations for calculations:
where n is the number of data points, p is the number of parameters in the model, WSS is the weighted sum of the squared deviations, yiobs and yipre are the observed and predicted amounts of drug released over time, respectively, and wi is the weighting factor for the kth data point.
Fitting was performed using Excel software and the parameters of each model are shown in . As indicated, zero-order, first-order, and Hixson-Crowell kinetics were not adequate to describe the release profile of TA from ME and MEG because of the low R2adjusted and the high AIC values. The remaining two kinetic models tested (Higuchi and Korsmeyer-Peppas) had high R2adjusted and low AIC values, namely, 0.934 and 66.268, and 0.950 and 63.132 for the TA-ME formulation, respectively, and 0.983 and 51.053, and 0.983 and 51.007 for the TA-MEG formulation, respectively. The adjusted correlation coefficients and AIC values for the Higuchi and Korsmeyer-Peppas models are very close. Therefore, the release profiles of both formulations could be best explained by both the Higuchi and Korsmeyer-Peppas models, which is consistent with the results obtained in a previous study by Scomoroscenco et al. (Scomoroscenco et al., Citation2021).
Table 6. Parameters of each model applied to selected samples.
In the Korsmeyer-Peppas model, the exponent of TA-ME was 0.363, which was less than 0.45, indicating that the release mechanism of TA from the ME drug delivery system follows pseudo-Fickian diffusion (Bruschi, Citation2015). Furthermore, according to the Higuchi model, the release of drug from the ME system is achieved by pure diffusion without erosion or swelling of the matrix, which has been confirmed in some previous studies investigating kinetic models of therapeutic agent release from microemulsions (Scomoroscenco et al., Citation2021; Shukla et al., Citation2018). The most frequently used model for drug release from hydrogel systems is the Korsmeyer-Peppas model (Vigata et al., Citation2020). The exponent of TA-MEG in this study was 0.492 (0.45 < n < 0.89) according to the Korsmeyer-Peppas equation, indicating an abnormal transport mechanism in which the drug is released by a combination of diffusion and swelling (Bruschi, Citation2015).
3.4. Stability testing
A stability study was carried out to evaluate the stability of the final formulation (MEG) under storage conditions. This test was conducted for 3 months by evaluating the gelation behavior, drug content, and in vitro release of TA-MEG. Visual inspection showed no evidence of phase separation or precipitation throughout the evaluation period. As shown in and Figure S1, the drug content, gelation time, syringeability, and in vitro release of TA-MEG were evaluated at the different time intervals of 1 month and 3 months. It was clearly shown that there were no significant differences in gelation time, syringeability time, or in vitro release profile. In the case of drug content, no difference was observed after 1 month (the drug content at both time points was approximately 100%), but there was a significant drop to 94.8 ± 4.7% with a p value < 0.05 after 3 months in the stability test. Despite this decline, TA-MEG was considered stable for up to 3 months in the refrigerator as the drug content was still higher than 90% at this point of time.
Table 7. Characteristics of optimized TA-MEG on stability test.
3.5. Cell viability
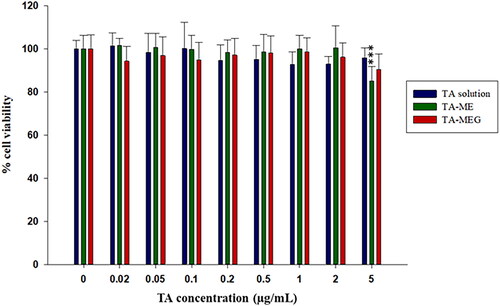
The viability of NIH3T3 cells treated with TA-Sol, TA-ME, and TA-MEG were investigated, and the cell viability values are shown in . In general, all three formulations showed similar trends, and cell viability decreased with increasing concentration. According to Doktorovova et al., cell viability above 70% is generally considered to be nontoxic (Doktorovova et al., Citation2014). After treatment with various concentrations of TA (0 to 5 µg/mL) in the different formulations for 24 h, cell viability at the highest concentration of TA-Sol, TA-ME, and TA-MEG were 95.6 ± 6.9%; 85.0 ± 6.7% and 90.4 ± 7.2%, respectively, indicating that the three TA preparations were not cytotoxic at the experimental concentrations. Data were analyzed using ANOVA with Tukey’s posthoc test, and there was no significant difference between the TA-MEG group and TA-Sol group at all concentrations tested. However, when comparing of TA-ME and TA-Sol, there was a significant difference at the highest TA concentration (p < 0.001).
Figure 5. Cell viability of TA-Sol, TA-ME, and TA-MEG on NIH-3T3 cells (mean ± SD, n = 3).
The NIH3T3 cell line was chosen in this study for several reasons. First, it is an easy-to-obtain immortalized embryonic mouse primary fibroblast cell line. Second, fibroblasts can be reprogrammed to become neuronal cells by several different approaches using neural progenitor markers (Oct4, Sox2, cMyc, KIf4, and Brn4/Pou3f4) (Wang et al., Citation2011b; Zhou & Tripathi, Citation2012). In addition, HC-like cells can also be obtained by direct conversion from fibroblasts by the overexpression of GFI1, Pou4f3, and ATOH1, which play critical roles in the development of HCs (Duran Alonso et al., Citation2018). On the other hand, fibroblasts are also a structural component of the intermediate layer of the RWM (Duan & Zhi-qiang, Citation2009). NIH3T3 cells were also used for cytotoxicity testing in the study of Wissel et al. (Wissel et al., Citation2018). However, since the examined cells are not differentiated HCs, the translate of these findings to cells in the inner ear is limited. In the other words, it is unlikely that a single in vitro viability test or cell line model would be sufficient to make a final decision regarding toxicity. Therefore, it is necessary to reconfirm the toxicity of the sample after intratympanic administration in animal studies.
3.6. Animal studies
3.6.1. In vivo retention time evaluation
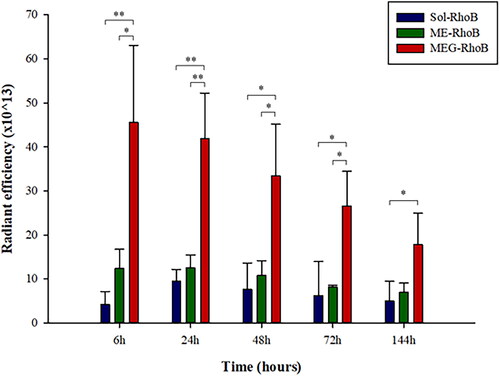
Following administration of the formulation containing a fluorescent agent (all three formulations were prepared with the same concentration of Rho (1 mg/mL) and applied in the same volume), in vivo fluorescence imaging was carried out at various time points (6, 24, 48, 72, and 144 h postdose), as shown in and . From the fluorescence image (), it is clear that the areas and intensities of the fluorescence signals in the Rho-MEG group were the greatest, followed by the Rho-ME group, while the smallest belonged to the Rho-Sol group at all tested time points. This result comes from differences in the viscosity of the formulations. Rho-Sol and Rho-ME are low viscosity liquids that rapidly dissipate through the Eustachian tube, significantly reducing the drug retention time at the adsorption site (Plontke et al., Citation2008). Here, the fluorescence signals of Rho-ME, with a slightly higher viscosity, showed a slightly larger area and intensity compared to the Rho-Sol. On the other hand, when exposed to body temperature, thermosensitive Rho-MEG undergoes a sol-gel transition process to form a semisolid gel at the application site, so a greater amount of Rho-MEG remained in the middle ear cavity for a longer time. From , it is also evident that the overall fluorescence intensity for all three formulations tends to decrease over time. The fluorescence signals of Rho-MEG remained high after 144 h (or 6 days), whereas the fluorescence signal of Rho-Sol was very low after 48 h. For a more specific evaluation, the radiant efficiency values were calculated from the in vivo fluorescence images after selecting appropriate ROIs and are displayed in . According to , the radiant efficiency decreased in all three groups over time, and the Rho-MEG group had the highest radiant efficiency among them. At 6 h postinjection, the radiant efficiency of Rho-MEG was 45.6 ± 17.5 × 10¹³ ((p/sec/cm2/s)/(μW/cm2)), which is 3.67-fold and 10.86-fold greater than that of Rho-ME and Rho-Sol, respectively. The radiant efficiency of Rho-MEG was significantly higher than that of Rho-ME and Rho-Sol at all designate time points, with p values < 0.01 (**) at the first two time points (6 h and 24 h after application) and p values < 0.05 (*) at the following three time points. At 144 h post-dose, Rho-MEG retained approximately 40% of the radiant efficiency that was measured at 6 h, and the signal was approximately 3 times higher than that of Rho-ME and Rho-Sol. However, this decrease in radiant efficiency with time in all experimental groups and the difference in radiant efficiency between Rho-MEG and Rho-ME at 144 h were not statistically significant. This is due to the large deviations in the data derived from many factors (animal posture, equipment, and difficulty in applying very small amounts of formulation (5 μL)). Despite these limitations, the in vivo fluorescence imaging results confirmed that the in situ gelling system (MEG) significantly improved the retention time of the drug in the middle ear cavity (more than 6 days) compared to the conventional solution (less than 2 days).
Figure 6. In vivo fluorescence images of mice after intratympanic administration of Rho-Sol, Rho-ME, and Rho-MEG.
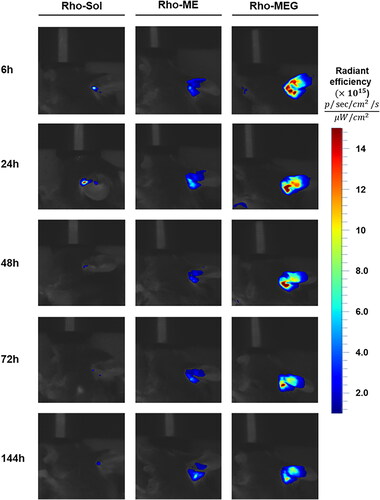
Figure 7. The radiant efficiency calculated from in vivo fluorescence imaging after selecting appropriate ROIs using CleVueTM software (mean ± SD, n = 3).
3.6.2. In vivo distribution
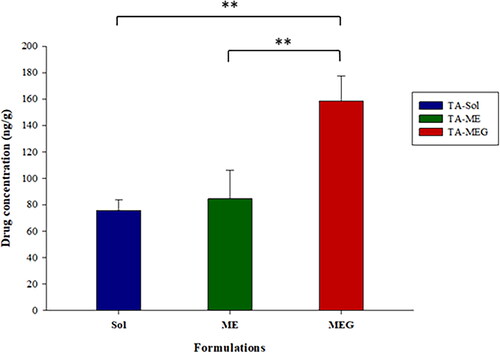
According to Plontke et al., the amount of drug penetrating the cochlea depends primarily on the retention time of the drug in the round window membrane (Plontke et al., Citation2008). This is consistent with data obtained from the distribution study in the present study. In , at 24 h postinjection, the cochlear drug concentration in the TA-MEG group (158.9 ± 18.7 ng/g) was the highest, which also had the most prolonged retention time in the middle ear cavity, as indicated from the in vivo fluorescence imaging study. The prolonged retention time of MEG resulted in a considerably significant increase in drug concentration in the inner ear compared to ME and the solution with p values less than 0.01 (**). In contrast, the TA concentrations in the cochlea of the TA-ME and TA-Sol groups were 84.8 ± 21.5 and 76.0 ± 7.8 ng/g, respectively. The slightly higher of TA concentration in the TA-ME group versus the TA-Sol group might be due to the slightly longer retention time of ME compared to the solution formulation, although this difference was not significant. Importantly, TA was completely dissolved in both ME and the solution formulation, with the support of oil, surfactant and cosurfactant in ME and the presence of 40% (w/w) ethanol in the solution formulation. The presence of these excipients not only increased the solubility of TA but also enhanced the ability of TA to penetrate through the RWM, leading to significantly similar amounts of drug in the inner ear in the TA-ME and TA-sol groups (Patra et al., Citation2006; Shah, Citation2021).
Figure 8. The cochlear distribution profiles of TA after intratympanic administration of TA-Sol, TA-ME, and TA-MEG in SD rats (mean ± SD, n = 3).
3.6.3. In vivo toxicity
Histological evaluations were performed to evaluate the biocompatibility of the prepared drug delivery system after administration. On day 2 after intratympanic injection, the morphological structure of the inner ear was evaluated, focusing on the state of the organ of Corti (OC), spiral ganglion neuron (SGN), and stria vascularis (SV) after the surfaces of the cochleae were prepared. The results obtained after the intratympanic administration of saline (control), TA-Sol, TA-ME, and TA-MEG are shown in . Overall, the histological examination revealed no histopathological changes in cochlear structure after treatment with the various formulations. In fact, there were no inflammatory cells in the SGN or OC. Assessment of the SGN revealed heterogeneous nuclei in the spiral ganglion cells in all four groups. However, spiral ganglion cell evaluation did not reveal any treatment-related alterations in cell size, morphology or number in the three treated groups compared to the control group. Additionally, there were no morphological differences between the four groups regarding hair cells and supporting cells in OC. The stria vascularis in all four groups indicated the presence of blood cells, as the SV are composed of numerous capillary loops and small blood vessels that are responsible for producing endolymph for the scala media as well as maintaining the ionic composition of endolymph. There was no inflammatory response observed in the SV regions after the application of TA-Sol, TA-ME, or TA-MEG. Therefore, all formulations were considered biocompatible with the inner ear.
Figure 9. Histological sections of inner ear samples of mice after intratympanic injection. H&E staining was performed on inner ear sections from mice of (A) control group, (B) TA-Sol group, (C) TA-ME group, and (D) TA-MEG (n = 3 each group). OC, organ of Corti; SGN, spiral ganglion neuron; SV, stria vascularis. In each of the low-magnification images (right panel), a dotted-line rectangle shows where a high-magnification image of the spiral ganglion cells (right panel).
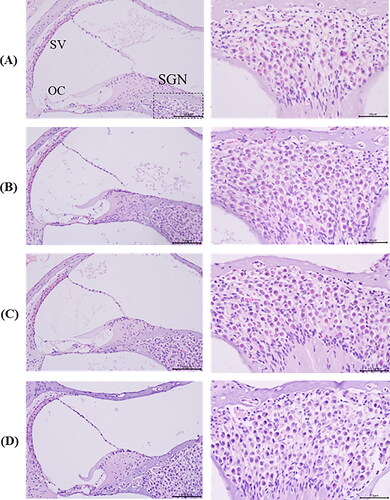
The in vivo toxicity results were consistent with those obtained from the in vitro cell viability and in vivo distribution studies. Although all formulations were prepared at the TA concentration of approximately 0.887 mg/mL, the amount of drug reaching the cochleae was at the nanogram level, which is consistent with the safe concentration range of the TA preparation in terms of cell viability (0 to 5 µg/mL). This phenomenon may be attributed to the protective ability of the RWM, the barrier that separates the middle ear cavity from the inner ear compartment. In addition, the safety of the poloxamer hydrogel system for local administration to the inner ear has been demonstrated in previous studies by histological examination as well as the auditory brainstem response (ABR) test (Honeder et al., Citation2014; Piu et al., Citation2011; Wang et al., Citation2009).
3.6.4. In vivo otoprotective effect
In the present study, cisplatin was chosen as the agent that caused animal hearing loss. The molecular mechanism of cisplatin-induced ototoxicity is due to the ability of cisplatin to promote the generation of reactive oxygen species (ROS) through upregulation of the NADPH oxidase NOX3. Elevated ROS levels result in decreased levels of protective antioxidant molecules (glutathione and antioxidant enzymes) in cochlear tissues, and this redox homeostasis triggers cell death pathways (both caspase-dependent and intrinsic apoptosis cascades) in the cochleae. As a result, cisplatin induces alterations in cochlear histological structure, including the loss of hair cells in the organ of Corti and the reduction of spiral ganglion cells as well as damage to stria vascular cells (Hodge et al., Citation2021; van Ruijven et al., Citation2005). Depletion of the cochlear structure begins in the hair cells of the basal cochlea due to their inherently higher susceptibility to ROS (Schacht et al., Citation2012). Therefore, histological analysis of the basal region of the cochlea was conducted to evaluate the efficiency in the cisplatin-induced ototoxic model and the otoprotective capability of the preparations. The obtained results are shown in and Table S1.
Figure 10. Oto-protective effect outcomes afforded by TA-Sol, TA-ME and TA-MEG intratympanic administration in a mouse cisplatin-induced ototoxicity model. (A)–(E). Photomicrographs of stria vascularis (SV), spiral ganglion neurons (SGN) and organ of Corti (OC) in the cross sections of the whole cochleae, H&E staining. (A) Control group, (B) Cisplatin group, (C) TA-Sol group, (D) TA-ME group, and (E) TA-MEG group (n = 4-5 each group). In each of the low-magnification image (upper panel), a dotted-line rectangle shows where a high-magnification image of the spiral ganglion cells (lower panel). (F) Lesion level of cochlear tissues (stria vascularis, spiral ganglion neurons and organ of Corti) evaluated on semi-quantitative scale (mean ± SD, n = 4-5).
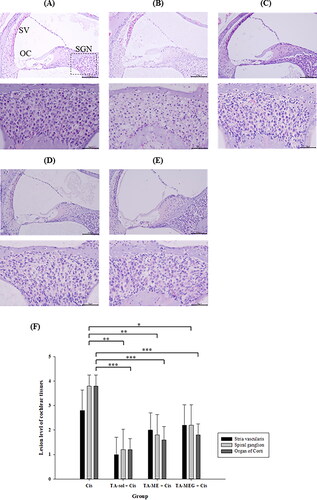
Morphological observations of the control samples showed normal histopathological structures in the OC, SGN, and SV (). In a comparison of cochlear cross-sections between the cisplatin group and control group, the micrographs of the cisplatin group showed deterioration of the general structure of the cochlea, and the impaired structural integrity focused on three regions (including the OC, SGN, and SV) (). This was consistent with the results of previous studies (Choi et al., Citation2019; Hodge et al., Citation2021; Kuduban et al., Citation2013; van Ruijven et al., Citation2005). These changes can be attributed to the high accumulation of cisplatin in these three targeted regions after IP injection (Breglio et al., Citation2017). In particular, increased hyperemia and some number of degenerative cells were observed in the SV. The structure of the OC collapsed, the tunnel of the OC disappeared, and few sensory epithelial cells remained. The SGN showed distinct necrotic changes. The nuclei of SGN were observed to be slightly pycnotic, and the cytoplasm showed vacuolization. Detrimental changes in the morphology of the SGN appeared to be secondary to the disintegration of the OC (Schindler et al., Citation1995; Zhang et al., Citation2021).
In contrast, samples from mice dosed with cisplatin and TA preparations (including TA-Sol, TA-ME, and TA-MEG) had fewer microstructural changes in the cochlear tissues than those in the samples from mice dosed with cisplatin alone. Evaluation of the micrographs obtained by histological analysis () showed minimal histopathological changes in the cochleae in the TA-Sol + cisplatin group; minimal hyperemia in the SV and a decreased number of spiral ganglion cells in the TA-ME + cisplatin group; and minimal hyperemia in the SV, a moderate decrease with structural alteration of the OC, and a decrease in the number of spiral ganglion cells in the TA-MEG + cisplatin group. The lesion levels in SV, SGN, and OC were evaluated and scored according to a semiquantitative scale, and the results are presented in and Table S1. The semiquantitative results showed that the lesion scores of the cisplatin group were significantly higher in the SGN and OC than those of the rest of the drug treatment groups in all three targeted regions. It was demonstrated that intratympanic administration was effective in terms of oto-protective effects (TA from TA-Sol, TA-ME, and TA-MEG penetrated through the RWM and reached therapeutic concentrations in the inner ear). In addition, there were no significant differences in the degree of lesion levels between the TA-Sol + cisplatin group, the TA-ME + cisplatin group, and the TA-MEG + cisplatin group. This could be explained by the fact that the drug was released from the carrier, and the manufacture of ME and MEG provided sustained release of the drug (approximately 85% and 70% TA release from TA-ME and TA-MEG after 4 days under sink conditions in the in vitro release study). Consequently, although the oto-protective effect was evaluated after 7 days, no significant differences were found between the three TA-treated groups.
Single-dose injection of cisplatin has been commonly used in studies involving drug delivery systems for the treatment of hearing loss because of the ototoxicity induction effect and the advantage in terms of experimental time, but this model does not reflect clinical cisplatin administration. Typically, cisplatin is administered via multiple cycles over several weeks with intervening recovery periods without cisplatin injection (Fernandez et al., Citation2019). Furthermore, cisplatin has been demonstrated to remain long-term (for months to years) in the cochlea of both mice and humans after treatment (Breglio et al., Citation2017). Therefore, in conventional delivery systems such as solutions, repeated injections are frequently required for this long-term protective effect due to rapid clearance. With the characteristics of sustained release and prolonged retention time in the middle ear cavity that were demonstrated in the above in vitro and in vivo studies, TA-MEG is expected to have better efficacy to protect against cisplatin-induced hearing damage with a single dose than TA-Sol alone. In this study, the 7-day experimental period was not long enough to show the superior effect of the resultant formulation. To demonstrate superior efficacy of TA-MEG in oto-protection, a multicycle model of cisplatin administration over a long period of time needs to be conducted.
4. Conclusion
In the present study, we developed an injectable, biodegradable TA-loaded microemulsion thermosensitive hydrogel for the treatment of inner ear disease. With the temperature-dependent sol-gel transition characteristic, this drug delivery system tends to decrease drug clearance and prolong retention time to facilitate the absorption of drugs into the inner ear. On the other hand, the application of the microemulsion preparation improved the penetration capacity of the drug through the RWM. Incorporation of microemulsions into poloxamer gel provided a system that could remain in the middle ear cavity for at least 6 days to more effectively deliver TA into the inner ear, protecting hair cells, spiral ganglion neurons, and stria vascular cells against cisplatin-induced damage. Due to the properties of microemulsions and in situ poloxamer hydrogels, the resulting system could be a promising approach for the sustained delivery of drugs into the perilymph.
Author contributions
Thu Nhan Nguyen: Conceptualization, Methodology, Formal Analysis, Investigation, Writing-Original Draft, Writing – Review & Editing. So-Yeol Yoo: Methodology, Formal Analysis, Investigation. Warisraporn Tangchang: Methodology, Formal Analysis, Investigation. Jae-Young Lee: Formal Analysis, Investigation, Data Curation, Visualization. Hwa-Young Son: Formal Analysis, Investigation, Data Curation, Writing-Original Draft, Visualization. Jeong-Sook Park: Conceptualization, Writing – Review & Editing, Supervision, Project administration, Funding acquisition.
Date availability statement
The data that support the findings of this study are available from the corresponding author upon reasonable request.
Supplemental Material
Download MS Word (39.3 KB)Disclosure statement
No potential conflict of interest was reported by the authors.
Additional information
Funding
References
- Alles MJRC, der Gaag MA, Stokroos RJ. (2006). Intratympanic steroid therapy for inner ear diseases, a review of the literature. Eur Arch Otorhinolaryngol 263:1–20. doi: 10.1007/s00405-006-0065-3.
- Augusthy AR, Chandran S, K.V V. (2017). Design and evaluation of an in situ forming implant system of an anti-inflammatory drug. Indo Am J Pharm Sci 4:983–94.
- Bird PA, Murray DP, Zhang M, Begg EJ. (2011). Intratympanic versus intravenous delivery of dexamethasone and dexamethasone sodium phosphate to cochlear perilymph. Otol Neurotol 32:933–6. doi: 10.1097/MAO.0b013e3182255933.
- Breglio AM, Rusheen AE, Shide ED, et al. (2017). Cisplatin is retained in the cochlea indefinitely following chemotherapy. Nat Commun 8:1654. doi: 10.1038/s41467-017-01837-1.
- Brownell WE. (1997). How the ear works - natures’s solution for listening. Volta Rev 99:9–28.
- Bruschi ML. (2015). Mathematical models of drug release. In: Strategies to modify the drug release from pharmaceutical systems. Sawston, CA: Woodhead Publishing.
- Cai J, Wu X, Li X, et al. (2019). Allicin protects against cisplatin-induced stria vascularis damage: possible relation to inhibition of caspase-3 and PARP-1-AIF-mediated apoptotic pathways. ORL J Otorhinolaryngol Relat Spec 81:202–14. doi: 10.1159/000500557.
- Cardin V. (2016). Effects of aging and adult-onset hearing loss on cortical auditory regions. Front Neurosci 10:199. doi: 10.3389/fnins.2016.00199.
- Casiraghi A, Gennari CG, Musazzi UM, et al. (2020). Mucoadhesive budesonide formulation for the treatment of eosinophilic esophagitis. Pharmaceutics 12:211. doi: 10.3390/pharmaceutics12090822.
- Chen Y, Cheng G, Hu R, et al. (2019). A nasal temperature and pH dual-responsive in situ gel delivery system based on microemulsion of huperzine A: formulation, evaluation, and in vivo pharmacokinetic study. AAPS PharmSciTech 20:301. doi: 10.1208/s12249-019-1513-x.
- Chiappisi L, Noirez L, Gradzielski M. (2016). A journey through the phase diagram of a pharmaceutically relevant microemulsion system. J Colloid Interface Sci 473:52–9. doi: 10.1016/j.jcis.2016.03.064.
- Choi M-J, Kang H, Lee YY, et al. (2019). Cisplatin-induced ototoxicity in rats is driven by RIP3-dependent necroptosis. Cells 8:409. doi: 10.3390/cells8050409.
- Cohen BE, Durstenfeld A, Roehm PC. (2014). Viral causes of hearing loss: A review for hearing health professionals. Trends Hear 18:233121651454136.
- Curtis LM, ten Cate WJ, Rarey KE. (1993). Dynamics of Na,K-ATPase sites in lateral cochlear wall tissues of the rat. Eur Arch Otorhinolaryngol 250:265–70. doi: 10.1007/BF00186223.
- Dahm V, Nieratschker M, Riss D, et al. (2019). Intratympanic tiamcinolone acetonide as treatment option for idiopathic sudden sensorineural hearing loss. Otol Neurotol 40:720–7. doi: 10.1097/MAO.0000000000002283.
- Dindelegan MG, Blebea C, Perde-Schrepler M, et al. (2022). Recent advances and future research directions for hearing loss treatment based on nanoparticles. J Nanomater 2022:1–15. doi: 10.1155/2022/7794384.
- Doktorovova S, Souto EB, Silva AM. (2014). Nanotoxicology applied to solid lipid nanoparticles and nanostructured lipid carriers – a systematic review of in vitro data. Eur J Pharm Biopharm 87:1–18. doi: 10.1016/j.ejpb.2014.02.005.
- Duan M, Zhi-Qiang C. (2009). Permeability of round window membrane and its role for drug delivery: our own findings and literature review. J Otol 4:34–43. doi: 10.1016/S1672-2930(09)50006-2.
- Duran Alonso MB, Lopez Hernandez I, de la Fuente MA, et al. (2018). Transcription factor induced conversion of human fibroblasts towards the hair cell lineage. PLoS One 13:e0200210. doi: 10.1371/journal.pone.0200210.
- Engleder E, Honeder C, Klobasa J, et al. (2014). Preclinical evaluation of thermoreversible triamcinolone acetonide hydrogels for drug delivery to the inner ear. Int J Pharm 471:297–302. doi: 10.1016/j.ijpharm.2014.05.057.
- Fakhari A, Corcoran M, Schwarz A. (2017). Thermogelling properties of purified poloxamer 407. Heliyon 3:e00390. doi: 10.1016/j.heliyon.2017.e00390.
- Fernandez K, Wafa T, Fitzgerald TS, Cunningham LL. (2019). An optimized, clinically relevant mouse model of cisplatin-induced ototoxicity. Hear Res 375:66–74. doi: 10.1016/j.heares.2019.02.006.
- Fettiplace R. (2017). Hair cell transduction, tuning, and synaptic transmission in the mammalian cochlea. Compr Physiol 7:1197–227. doi: 10.1002/cphy.c160049.
- Freitas LM, Antunes FTT, Obach ES, et al. (2021). Anti-inflammatory effects of a topical emulsion containing Helianthus annuus oil, glycerin, and vitamin B3 in mice. J Pharm Investig 51:223–32. doi: 10.1007/s40005-020-00508-6.
- Gacek RR. (2021). On the nature of hearing loss in Méniere’s disease. ORL J Otorhinolaryngol Relat Spec 83:144–50. doi: 10.1159/000511113.
- Gausterer JC, Saidov N, Ahmadi N, et al. (2020). Intratympanic application of poloxamer 407 hydrogels results in sustained N-acetylcysteine delivery to the inner ear. Eur J Pharm Biopharm 150:143–55. doi: 10.1016/j.ejpb.2020.03.005.
- Giuliano E, Paolino D, Fresta M, Cosco D. (2018). Mucosal applications of poloxamer 407-based hydrogels: an overview. Pharmaceutics 10:159. doi: 10.3390/pharmaceutics10030159.
- Gong C, Qi T, Wei X, et al. (2012). Thermosensitive polymeric hydrogels as drug delivery systems. CMC 20:79–94. doi: 10.2174/0929867311302010009.
- Guo X, Bai X, Li L, et al. (2018). Forskolin protects against cisplatin-induced ototoxicity by inhibiting apoptosis and ROS production. Biomed Pharmacother 99:530–6. doi: 10.1016/j.biopha.2018.01.080.
- Guzman J, Ruiz J, Eshraghi AA, et al. (2006). Triamcinolone acetonide protects auditory hair cells from 4-hydroxy-2,3-nonenal (HNE) ototoxicity in vitro. Acta Otolaryngol 126:685–90. doi: 10.1080/00016480500492018.
- Hajjar B, Zier K-I, Khalid N, et al. (2018). Evaluation of a microemulsion-based gel formulation for topical drug delivery of diclofenac sodium. J Pharm Investig 48:351–62. doi: 10.1007/s40005-017-0327-7.
- Hasan N, Cao J, Lee J, et al. (2021). Development of clindamycin-loaded alginate/pectin/hyaluronic acid composite hydrogel film for the treatment of MRSA-infected wounds. J Pharm Investig 51:597–610. doi: 10.1007/s40005-021-00541-z.
- Hodge SE, Lopez IA, Ishiyama G, Ishiyama A. (2021). Cisplatin ototoxicity histopathology. Laryngoscope Investig Otolaryngol 6:852–6. doi: 10.1002/lio2.608.
- Honeder C, Engleder E, Schöpper H, et al. (2014). Sustained release of triamcinolone acetonide from an intratympanically applied hydrogel designed for the delivery of high glucocorticoid doses. Audiol Neurootol 19:193–202. doi: 10.1159/000358165.
- Honeder C, Zhu C, Schöpper H, et al. (2016). Effects of sustained release dexamethasone hydrogels in hearing preservation cochlear implantation. Hear Res 341:43–9. doi: 10.1016/j.heares.2016.08.001.
- Hosny KM, Hassan AH. (2014). Intranasal in situ gel loaded with saquinavir mesylate nanosized microemulsion: preparation, characterization, and in vivo evaluation. Int J Pharm 475:191–7. doi: 10.1016/j.ijpharm.2014.08.064.
- Jain S, Patel N, Lin S. (2015). Solubility and dissolution enhancement strategies: current understanding and recent trends. Drug Dev Ind Pharm 41:875–87. doi: 10.3109/03639045.2014.971027.
- Jumaily M, Faraji F, Mikulec AA. (2017). Intratympanic triamcinolone and dexamethasone in the treatment of Ménière’s syndrome. Otol Neurotol 38:386–91. doi: 10.1097/MAO.0000000000001311.
- Kim DH, Nguyen TN, Han YM, et al. (2021). Local drug delivery using poly(lactic-coglycolic acid) nanoparticles in thermosensitive gels for inner ear disease treatment. Drug Deliv 28:2268–77. doi: 10.1080/10717544.2021.1992041.
- Kim SH, Kim SR, Yoon HY, et al. (2017). Poloxamer 407 hydrogels for intravesical instillation to mouse bladder: gel-forming capacity and retention performance. Korean J Urol Oncol 15:178–86. doi: 10.22465/kjuo.2017.15.3.178.
- Kuduban O, Kucur C, Sener E, et al. (2013). The Role of thiamine pyrophosphate in prevention of cisplatin ototoxicity in an animal model. Sci World J 2013:1–5. doi: 10.1155/2013/182694.
- Kurabi A, Keithley EM, Housley GD, et al. (2017). Cellular mechanisms of noise-induced hearing loss. Hear Res 349:129–37. doi: 10.1016/j.heares.2016.11.013.
- Lawrence MJ, Rees GD. (2000). Microemulsion-based media as novel drug delivery systems. Adv Drug Deliv Rev 45:89–121. doi: 10.1016/s0169-409x(00)00103-4.
- Lin TJ, Kurihara H, Ohta H. (1977). Prediction of optimum o/w emulsification via solubilization measurements. J Soc Cosmet Chem Japan 11:32–42. doi: 10.5107/sccj1976.11.2_32.
- Mehta DP, Rathod HJ, Shah DP, Shah CN. (2015). A review on microemulsion based gel: a recent approach for topical drug delivery system. *** 8:118. doi: 10.5958/0974-360X.2015.00021.9.
- Morales D, Gutiérrez JM, García-Celma MJ, Solans YC. (2003). A Study of the relation between bicontinuous microemulsions and oil/water nano-emulsion formation. Langmuir 19:7196–200. doi: 10.1021/la0300737.
- Moreau D, Lefort C, Burke R, et al. (2015). Rhodamine B as an optical thermometer in cells focally exposed to infrared laser light or nanosecond pulsed electric fields. Biomed Opt Express 6:4105–17. doi: 10.1364/BOE.6.004105.
- Nguyen TN, Park JS. (2023). Intratympanic drug delivery systems to treat inner ear impairments. J Pharm Investig 53:93–118. doi: 10.1007/s40005-022-00586-8.
- Nyberg S, Abbott NJ, Shi X, et al. (2019). Delivery of therapeutics to the inner ear: the challenge of the blood-labyrinth barrier. Sci Transl Med 11:eaao0935. doi: 10.1126/scitranslmed.aao0935.
- Patra M, Salonen E, Terama E, et al. (2006). Under the influence of alcohol: the effect of ethanol and methanol on lipid bilayers. Biophys J 90:1121–35. doi: 10.1529/biophysj.105.062364.
- Piu F, Wang X, Fernandez R, et al. (2011). OTO-104: a sustained-release dexamethasone hydrogel for the treatment of otic disorders. Otol Neurotol 32:171–9. doi: 10.1097/MAO.0b013e3182009d29.
- Plontke SK, Mikulec AA, Salt AN. (2008). Rapid clearance of methylprednisolone after intratympanic application in humans versus intravenous delivery of methylprednisolone to cochlear perilymph. Otol Neurotol 29:732–3; author reply 733. doi: 10.1097/MAO.0b013e318173fcea.
- Pyykkö I, Zou J, Zhang W, Zhang Y. (2011). Nanoparticle-based delivery for the treatment of inner ear disorders. Curr Opin Otolaryngol Head Neck Surg 19:388–96. doi: 10.1097/MOO.0b013e32834aa3a8.
- Rauch SD, Halpin CF, Antonelli PJ, et al. (2011). Oral vs intratympanic corticosteroid therapy for idiopathic sudden sensorineural hearingloss. JAMA 305:2071–9. doi: 10.1001/jama.2011.679.
- Richter CA, Amin S, Linden J, et al. (2010). Defects in middle ear cavitation cause conductive hearing loss in the Tcof1 mutant mouse. Hum Mol Genet 19:1551–60. doi: 10.1093/hmg/ddq028.
- Rizk HG, Lee JA, Liu YF, et al. (2020). Drug-induced ototoxicity: a comprehensive review and reference guide. Pharmacotherapy 40:1265–75. doi: 10.1002/phar.2478.
- Ross MD, Ernst SA, Kerr TP. (1982). Possible functional roles of Na+, K+-ATPase in the inner ear and their relevance to Ménière’s disease. Am J Otolaryngol 3:353–60. doi: 10.1016/s0196-0709(82)80010-0.
- Russo E, Villa C. (2019). Poloxamer hydrogels for biomedical applications. Pharmaceutics 11:671. doi: 10.3390/pharmaceutics11120671.
- Sabale V, Vora S. (2012). Formulation and evaluation of microemulsion-based hydrogel for topical delivery. Int J Pharm Investig 2:140–9. doi: 10.4103/2230-973X.104397.
- Shah B. (2021). Microemulsion as a promising carrier for nose to brain delivery: journey since last decade. J Pharm Investig 51:611–34. doi: 10.1007/s40005-021-00528-w.
- Salt AN, Plontke SK. (2018). Pharmacokinetic principles in the inner ear: Influence of drug properties on intratympanic applications. Hear Res 368:28–40. doi: 10.1016/j.heares.2018.03.002.
- Schacht J, Talaska AE, Rybak LP. (2012). Cisplatin and aminoglycoside antibiotics: hearing loss and its prevention. Anat Rec (Hoboken) 295:1837–50. doi: 10.1002/ar.22578.
- Schindler RA, Gladstone HB, Scott N, et al. (1995). Enhanced preservation of the auditory nerve following cochlear perfusion with nerve growth factors. The American Journal of Otology 16:304–9. http://www.ncbi.nlm.nih.gov/pubmed/8588623
- Scomoroscenco C, Teodorescu M, Raducan A, et al. (2021). Novel gel microemulsion as topical drug delivery system for curcumin in dermatocosmetics. Pharmaceutics 13:505. doi: 10.3390/pharmaceutics13040505.
- Shafiq-Un-Nabi S, Shakeel F, Talegaonkar S, et al. (2007). Formulation development and optimization using nanoemulsion technique: A technical note. AAPS PharmSciTech 8:Article 28. doi: 10.1208/pt0802028.
- Shukla T, Upmanyu N, Agrawal M, et al. (2018). Biomedical applications of microemulsion through dermal and transdermal route. Biomed Pharmacother 108:1477–94. doi: 10.1016/j.biopha.2018.10.021.
- Silverstein H, Choo D, Rosenberg SI, et al. (1996). Intratympanic steroid treatment of inner ear disease and tinnitus (preliminary report). Ear Nose Throat J 75:468–71, 474, 476 passim. passim. doi: 10.1177/014556139607500806.
- Sohmer H. (1997). Pathophysiological mechanisms of hearing loss. J Basic Clin Physiol Pharmacol 8:113–25. doi: 10.1515/jbcpp.1997.8.3.113.
- Szeto B, Chiang H, Valentini C, et al. (2020). Inner ear delivery: Challenges and opportunities. Laryngoscope Investig Otolaryngol 5:122–31. doi: 10.1002/lio2.336.
- Takeda T, Takeda S, Kakigi A. (2020). Effects of glucocorticoids on the inner ear. Front Surg 7:596383. doi: 10.3389/fsurg.2020.596383.
- Talegaonkar S, Azeem A, Ahmad F, et al. (2008). Microemulsions: a novel approach to enhanced drug delivery. Recent Pat Drug Deliv Formul 2:238–57. doi: 10.2174/187221108786241679.
- Tenjarla S. (1999). Microemulsions: an overview and pharmaceutical applications. Crit Rev Ther Drug Carr Syst 16:461–521.
- Thakkar PJ, Madan P, Lin S. (2014). Transdermal delivery of diclofenac using water-in-oil microemulsion: formulation and mechanistic approach of drug skin permeation. Pharm Dev Technol 19:373–84. doi: 10.3109/10837450.2013.788658.
- Trune DR, Canlon B. (2012). Corticosteroid therapy for hearing and balance disorders. Anat Rec (Hoboken) 295:1928–43. doi: 10.1002/ar.22576.
- van Ruijven MWM, de Groot JCMJ, Klis SFL, Smoorenburg GF. (2005). The cochlear targets of cisplatin: an electrophysiological and morphological time-sequence study. Hear Res 205:241–8. doi: 10.1016/j.heares.2005.03.023.
- Vigata M, Meinert C, Hutmacher DW, Bock N. (2020). Hydrogels as drug delivery systems: a review of current characterization and evaluation techniques. Pharmaceutics 12:1188. doi: 10.3390/pharmaceutics12121188.
- Vona B, Haaf T. (Eds.). (2016). Genetics of Deafness (Vol. 20). Basel: S. Karger AG.
- Wang L-L, Huang S, Guo H, et al. (2016). In situ delivery of thermosensitive gel-mediated 5-fluorouracil microemulsion for the treatment of colorectal cancer. Drug Des Devel Ther 10:2855–67. doi: 10.2147/DDDT.S111351.
- Wang X, Dellamary L, Fernandez R, et al. (2009). Dose-dependent sustained release of dexamethasone in inner ear cochlear fluids using a novel local delivery approach. Audiol Neurootol 14:393–401. doi: 10.1159/000241896.
- Wang X, Dellamary L, Fernandez R, et al. (2011a). Principles of inner ear sustained release following intratympanic administration. Laryngoscope 121:385–91. doi: 10.1002/lary.21370.
- Wang Z, Sugano E, Isago H, et al. (2011b). Differentiation of neuronal cells from NIH/3T3 fibroblasts under defined conditions. Dev Growth Differ 53:357–65. doi: 10.1111/j.1440-169X.2010.01235.x.
- Wissel K, Brandes G, Pütz N, et al. (2018). Platinum corrosion products from electrode contacts of human cochlear implants induce cell death in cell culture models. Plos ONE 13:e0196649. doi: 10.1371/journal.pone.0196649.
- Yang CJ, Chung JW. (2016). Pathophysiology of noise induced hearing loss. Audiol Speech Res 12:S14–S16. doi: 10.21848/asr.2016.12.S1.S14.
- Yu X, Man R, Li Y, et al. (2019). Paeoniflorin protects spiral ganglion neurons from cisplatin-induced ototoxicity: Possible relation to PINK1/BAD pathway. J Cell Mol Med 23:5098–107. doi: 10.1111/jcmm.14379.
- Zhang L, Chen S, Sun Y. (2021). Mechanism and prevention of spiral ganglion neuron degeneration in the cochlea. Front Cell Neurosci 15:814891. doi: 10.3389/fncel.2021.814891.
- Zhou Q, Tripathi P. (2012). How to remake a fibroblast into a neural stem cell. Cell Stem Cell 10:347–8. doi: 10.1016/j.stem.2012.03.005.
- Zimmer WM, Rosin DF, Saunders JC. (1994). Middle-ear development VI: Structural maturation of the rat conducting apparatus. Anat Rec 239:475–84. doi: 10.1002/ar.1092390413.