
 ?Mathematical formulae have been encoded as MathML and are displayed in this HTML version using MathJax in order to improve their display. Uncheck the box to turn MathJax off. This feature requires Javascript. Click on a formula to zoom.
Abstract
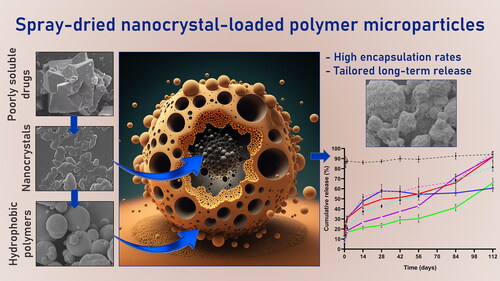
Nano- and micro-technologies can salvage drugs with very low solubility that were doomed to pre-clinical and clinical failure. A unique design approach to develop drug nanocrystals (NCs) loaded in extended release polymeric microparticles (MPs) for local treatments is presented here through the case of a potential osteoarthritis (OA) drug candidate for intra-articular (IA) administration. Optimizing a low-shear wet milling process allowed the production of NCs that can be subsequently freeze-dried (FD) and redispersed in a hydrophobic polymer-organic solvent solution to form spray-dried MPs. Results demonstrated a successful development of a ready-to-upscale formulation containing PLGA MPs with high drug NC encapsulation rates that showed a continuous and controlled drug release profile over four months. The screenings and procedures described allowed for identifying and overcoming common difficulties and challenges raised along the drug reduction to nano-size and spray-drying process. Above all, the technical knowledge acquired is intended for formulation scientists aiming to improve the therapeutic perspectives of poorly soluble drugs.
Graphical Abstract
1. Introduction
The paradigm of solubility challenges remains stalled for new small molecules in the drug discovery pipeline. Many of these are categorized under Biopharmaceutics classification system (BCS) class 2 or 4 (Amidon et al., Citation1995). This is the case of the investigational small molecule compound GLPG0555, a Janus kinase 1 inhibitor which was in clinical development for osteoarthritis (OA) treatment. In an OA joint, the cartilage breaks down, inducing inflammation, pain, swelling, and reduced joint mobility (Hunter & Bierma-Zeinstra, Citation2019). Current treatments are only symptomatic or ineffective due to the low irrigation of the knee joint and the local and progressive nature of this disease, so arthroplasty remains the last opportunity for these patients in many cases. For that reason, intra-articular (IA) injections of disease-modifying OA drugs (DMOAD) or potential OA drugs, such as GLPG0555, have been proposed as an alternative therapy (Maudens et al., Citation2018a,Citationb,Citationc; Gonzalez-Fernandez et al., Citation2022). Still, their therapeutic perspectives in the clinic are, in most cases, limited not only by their very low solubility but also by a rapid drug clearance from the joint.
GLPG0555 (Log p = 2.85) is practically insoluble in aqueous media and in most organic solvents used in pharmaceutical technology, according to Ph. Eur. solubility definitions. In recent years, the formulation and development of nanocrystal (NC)–polymer extended delivery microparticles (MPs) for OA treatment was reported by the group of Jordan and Allémann (Maudens et al., Citation2018a,Citationb,Citationc). This strategy enables the potential micro-encapsulation of very low soluble drugs at very high drug loading rates via nanoscale particle size reduction. The technological approach results from the combination of two sequential techniques: (i) size reduction of the API by wet milling, followed by freeze-drying, and (ii) spray-drying (SP) of the NCs within a poly(DL lactic acid) (PLA) or poly(DL lactic-co-glycolic) (PLGA) matrix to produce NCs embedded MPs. SP is a single-step, batch-driven, fast manufacturing process that converts a feed liquid solution into a powder with tailor-made characteristics. It is an established technique in the pharmaceutical and food industry due to its cost-effectiveness, upscaling potential, and reproducibility (Sosnik & Seremeta, Citation2015; Wan & Yang, Citation2016; Maudens et al., Citation2018a,Citationb,Citationc). In fact, SP is nowadays much accounted in the formulation of amorphous solid dispersions, which is a well-known approach to deliver poorly water-soluble drugs mainly in the presence of a hydrophilic polymer matrix (Singh & van den Mooter, Citation2016). Contrary to the majority of these procedures, the main challenge of this study was to investigate the encapsulation of GLPG0555 as dispersed NCs, and not molecularly dispersed or dissolved, in a hydrophobic polymer matrix.
This report describes the research work performed to encounter a realistic scenario that allows to effectively load this API into polymeric MPs using the above-mentioned technology. In order to anticipate the hurdles arising from the bench to the clinic, a semi-industrial roller miller and spray dryer have been employed. In addition, FDA-approved biodegradable and biocompatible PLA/PLGA polymers and other excipients have been used. This drug delivery system was delineated to exhibit: (i) an adequate particle size distribution (PSD) with particle size diameters ranging from 1 to 60 μm (a size compatible with an IA administration that also delays clearance from the joint space) (Pradal et al., Citation2016); (ii) an effective and high GLPG0555 loading; and (iii) a controlled drug release profile that ensures its therapeutic activity over an extended period (e.g. ≥ 3 months) after an IA injection.
We have proposed a systematic and rational design protocol to optimize and develop NCs-loaded polymeric MPs. All the insights gathered were supported by in-depth characterizations, such as laser diffraction, dynamic light scattering (DLS), scanning electron microscopy (SEM), differential scanning calorimetry (DSC), or in vitro cumulative drug release monitoring. The methodologies and analysis performed have permitted to identify common SP difficulties and other conundrums, such as selecting the best stabilizers, organic solvents, or even an optimal concentration and PLA/PLGA ratio of the polymers, among others.
2. Materials and methods
2.1. Materials
Analytical grade acetone (ACE) was purchased from Acros Organics (Geel, Belgium). Carboxymethylcellulose sodium salt was obtained from Fluka Analytical (Buchs, Switzerland). Analytical grade solvents dichloromethane (DCM) and ethanol (EtOH) were acquired from Fisher Scientific (Waltham, MA). Dimethylsulfoxide, D-α-Tocopherol polyethylene glycol (PEG) 1000 succinate (TPGS), methanol (MeOH, analytical grade), acetonitrile (analytical grade), phosphate buffer saline tablets, poloxamer 407 (P407), Resomer® RG 503 H, Poly(D,L-lactide-co-glycolide), Resomer® RG 653 H, Poly(D,L-lactide-co-glycolide) (see more information about all the polymers used in the Supplementary material [SM], Table S1), sodium azide, sodium dodecyl sulfate and Tween®80 (polysorbate 80, T80) were supplied by Sigma-Aldrich (Sant Louis, MO). Resomer® RG 753 H, PLGA and Resomer® R 203 H, PLA were procured from Evonik (Essen, Germany). The investigational active pharmaceutical ingredient (API) GLPG0555 (MW: 410.43) was provided by Galapagos NV (Mechelen, Belgium). Lutrol® F68 (poloxamer 188, P188) was adquired from BASF (Ludwigshafen am Rhein, Germany). Trifluoroacetic acid was acquired from Alfa Aesar (Ward Hill, MA). Yttrium-stabilized Zirconium oxide (ZrO2) Ø 0.5-mm grinding beads were purchased from Next Advance (Troy, NY).
2.2. Wet milling and freeze drying of nanocrystals
Size reduction of GLPG0555 was performed using a Peira Roller Mill (Beerse, Belgium) for different wet milling times (i.e. 16, 48, and 72 h). The milling speed was set at a fixed rate 47 rpm (central cylinder), measured with a tachometer. Components were added to a clear glass vial in the following order: the stabilizers at different API-to-stabilizer w/w (API/s) ratios (i.e. 1/0.1 and 1/0.05), the API substance GLPG0555, 18 g ZrO2 0.5-mm beads and 5 mL of Milli-Q water to obtain a final drug concentration of 100 mg/mL. Once separated and washed from the sedimented ZrOx beads with Milli-Q water, nano drug suspensions were frozen at −80 °C for 24 h in a freezer. Lyophilization was performed using a Christ Alpha 2–4 LD Plus or Christ Alpha 2–4 LSC (Kuhner, Basel, Switzerland) automatic freeze-dryer. A main drying cycle of 72 h was carried out with a vacuum pressure set at 0.01 mBar whereas the ice condenser temperature was set at −85 °C. Freeze-dried (FD) vials were then sealed and kept at 2–8 °C.
2.3. Spray-drying of polymeric microparticles
MPs were formulated using a 4 M8-TriX semi-industrial spray dryer (ProCepT, Zele, Belgium). A set of variable and fixed process parameters ranges selected along all the studies is listed in . Briefly, the polymers (i.e. PLA or PLGA) were dissolved in an organic solvent solution in continuous agitation at room temperature and immediately spray-dried under a known feed solution flow rate using an external peristaltic pump Minipuls 3 (Gilson, Middletown, NY). In the case of the loaded MPs, the GLPG0555 NCs were added together with the polymer to an organic solvent solution and redispersed for around 1 min helped with 10 s of sonication using a standard ultrasonic bath. Dried particles separated in the cyclone finally accumulated in the collector. MPs were kept at 2–8 °C for further characterization.
Table 1. Spray-drying set-up parameters.
2.4. Particle characterization
PSD was determined using a Mastersizer 3000 (Malvern, Worcestershire, UK) laser diffraction equipment. Spray-dried MPs were redispersed in a resuspension medium solution (0.5% w/w carboxymethylcellulose sodium salt and 0.1% w/w P407 in Milli Q-water) during 1 min of vortex followed by 10 s of sonication bath. FD NCs were redispersed in Milli-Q water. The Hydro MV sample dispersion module (Malvern Worcestershire, UK) with a stirring rate of 1400–1500 rpm was used to disperse the samples in Milli-Q water until a laser obscuration of approximately 1–5% was reached. Each analysis consisted of five consecutive measurements on the same sample. The particle size measurements were expressed as the volume diameter (Dv) using ‘Mastersizer v3.60.’ software (Malvern, Worcestershire, UK). The optical parameters used for the particles were 1.59 and 1.33 for the dispersant (Milli-Q water).
The mean particle size diameter expressed in mean Z-average and the polydispersity index (PDI) of the NCs was also determined by DLS (Zetasizer Nano ZS Malvern; Malvern Instruments SA, UK) after dilution of the samples in Milli-Q water. Likewise, the zeta potential of NCs was characterized after sample dilution in Milli-Q water with laser Doppler velocimetry (Zetasizer Nano ZS Malvern; Malvern Instruments SA, Malvern, UK) and using the Smoluchowski equation.
Particle’s morphology was visualized using a JSM-7001F emission scanning electron microscope (SEM) (JEOL, Tokyo, Japan). NCs were previously washed and diluted with Milli-Q water to remove the excess of stabilizer. Then, one drop of the suspension was placed in a glass holder and evaporated under vacuum. Spray-dried MPs were directly deposited onto carbon tape-covered metal studs and dried under vacuum. Frozen MPs previously embedded in an OCT (CellPath, Newtown, England) matrix were cross-sectioned using a CryoStar NX70 microtome (Thermo Fisher Scientific; Waltham, MA). Prior to analysis, studs were sputter-coated with gold with a Leica EM SCD005 (Leica Microsystems, Wetzlar, Germany). All micrographs were acquired at a 5 kV voltage for MPs and 15 kV for NCs.
2.5. Differential scanning calorimetry
NCs, MPs, and bulk materials were analyzed using a Mettler Toledo DSC 3 Stare System differential scanning calorimeter (Columbus, OH). Sealed 100 µL aluminum crucibles were used for all measurements. Samples were submitted to one heating cycle, with a heating ramp of 5 K/min from 25 °C to 300 °C to analyze the melting point and enthalpy of transition (ΔH) of the GLPG0555. Crystallinity was calculated considering that the crystallinity of the initial GLPG0555 is 100%:
2.6. Drug quantification by ultra-high-performance liquid chromatography
Drug quantification was performed using an Acquity™ Ultraperformance LC (UHPLC) coupled to a photodiode array (PDA) detector (Waters Corp, Milford, MA). Samples were chromatographically separated using an Acquity UPLC® BEH C18 column (2.1 mm × 50 mm, 1.7 µm, Waters, Milford, MA) coupled to a C18 1.7 µm 2.1 × 5 mm VanGuard™ pre-column (Acquity UPLC®), equilibrated at 40 °C. A 2-min gradient elution at a constant flow rate of 0.35 mL/min was performed using a mobile phase starting from 75% of a 0.05% (v/v) trifluoroacetic acid aqueous solution and 25% of 0.05% (v/v) trifluoroacetic acid acetonitrile. Sample volume injection was 4 µL and wavelength PDA detection was set at 305 nm. Lower limit of quantification values was determined according to signal/noise ratio >10 and linearity R2> 0.990, obtained in independent experiments. Thus, calibration curves ranged from 0.1 to 100 μg/mL (a representative peak chromatogram is shown in Figure S1). All samples were analyzed in triplicate.
Drug content of all microparticulate systems and NCs formulated was quantified using the UHPLC methodology described above. GLPG0555 was extracted from 5 mg of MPs vortexed/mixed with 100 μL of dimethylsulfoxide followed by the addition of 900 µL of acetonitrile. The amount of encapsulated drug (drug loading [DL]) and the encapsulation efficiency (EE) were calculated by the following equations:
2.7. In vitro dissolution/drug release on nanocrystals and microparticles
In vitro dissolution studies of GLPG0555 NCs were performed over 24 h both in PBS (pH 7.2–7.4) and in the same saline buffer containing 1% w/v of T80, 1% w/v of sodium dodecyl sulfate and 0.025% w/v of sodium azide (the later called ‘MPs release study’ medium). Suspensions were placed in an orbital shaker at 100 rpm at 37 °C. At allotted time points, each tube was centrifuged at 14,000 rpm at 37 °C for 20 min to recover the supernatants. Samples were then filtered using 0.20 µm disposable syringe filters and kept at −20 °C prior to quantification using the above-described methodology. Experiments were performed in triplicates.
In vitro drug release studies of MPs loaded with GLPG0555 NCs were performed over four months. Tubes were correctly capped to avoid the evaporation of water and placed in an orbital shaker at 100 rpm at 37 °C. At allotted time points, 1 mL of sample supernatant was withdrawn after smooth homogenization and centrifugation of the tubes at 3000 rpm and 20 °C for 5 min. This volume was then replaced by fresh release medium. At the time points 48 h, 28, 56, and 84 d, 24 mL of the sample supernatant was also withdrawn and replaced with fresh release medium in order to ensure ‘sink’ conditions during all the experiment (Phillips et al., Citation2012). Withdrawn samples were kept at −20° C and then quantified using the methodology previously described. Experiments were performed in triplicates.
2.8. Statistical analysis
Statistical analysis was performed using GraphPad Prism version 8.0.1 software (San Diego, CA). Statistical comparison between different groups was performed using an ANOVA one-way analysis (Tukey’s multiple comparison test) or an unpaired t-test after confirming normal distribution and homogeneity of variances. Data were reported as mean ± s.d., considering a 95% confidence interval at significance level *p < 0.05.
3. Results
3.1. The effect of stabilizers on the size reduction of API and subsequent freeze-drying
Low-shear wet milling was performed to reduce the size of GLPG0555 as a preparatory formulation step prior to SP to be able to incorporate the NCs into micron-sized polymer MPs. Various conditions and stabilizers were initially screened, pursuing for a unimodal PSD and laser diffraction Dv50 and Dv90 values for these suspensions in the nanosize range. For instance, the wet milling time points 16 h and 32 h and 48 h failed for this goal (see SM Figure S2 and Table S2 for further details). However, a complete particle reduction to nanoscale size was observed at 72 h only in the presence of certain stabilizers. Under these conditions, a milky white suspension with no sedimentation events could be observed. Dv90 values were below 0.5 μm, and laser diffraction PSD graphs showed a unimodal distribution (see SM Figure S3, Table S3 for further information). illustrates the API/s ratio optimization for four selected stabilizers in order to determine failure boundaries along the wet milling process of GLPG0555. This ratio was reduced from the starting API/s ratio 1/0.1 down to 1/0.05. Whereas a high milling efficiency (with Dv90 values below 1 µm) was observed for TPGS and P407, a rather intermediate (Dv90 > 10 µm) or low milling efficiency (Dv50 and Dv90 > 1 µm) was observed for P188 and T80, respectively.
Figure 1. Wet milling screening and API/s ratio optimization. (A) PSD Dv50 and Dv90 values after 72 h wet milling of formulations containing TPGS, P407, P188, and T80 at API/s ratio 1/0.05. (B) PSD Dv50 and Dv90 values results after wet milling + resuspension of FD formulations containing TPGS and P407 at 2 API/s ratios. n = 1.

A drying process (i.e. freeze-drying) is also required to obtain a resuspendable NC powder for the SP process. The strategy here was to bypass a previous stabilizer-washing step and take advantage of its presence to act as a NC cryo/lyo-protectant to avoid particle agglomeration or recrystallization during the freeze-drying process. This experiment consisted of a second downward API/s ratio optimization only for P407 and TPGS to determine failure boundaries along the wet milling and subsequent freeze-drying process. Dv50 and Dv90 values corresponding to the P407 NCs in revealed that only the API/s ratio 1/0.05 was able to maintain similar PSD values after freeze-drying. For the TPGS formulation, the API/s ratio 1/0.05 did not succeed, as both Dv50 and Dv90 values were above 5 µm. Nevertheless, the starting API/s ratio 1/0.1 was again tested, showing a Dv90 value just below 1.5 µm.
3.2. Complementary characterization of nanocrystals
Independent formulated batches of two previously optimized NCs formulations were characterized in depth to load the API into polymeric MPs adequately. It was observed that particle reduction to nanoscale size of GLPG0555 was effectively complete for the TPGS API/s ratio 1/0.1 and P407 API/s ratio 1/0.05 NCs (). In that sense, freshly prepared formulations showed laser diffraction Dv90 values of 0.28 ± 0.09 and 0.37 ± 0.12 µm, respectively. DLS measurements showed a monodisperse population of particles () with mean particle sizes of 185 ± 0.6 and 218 ± 1.1 nm for TPGS and P407 NCs, respectively. As observed in , NCs displayed negative zeta potentials (−8.9 ± 9.0 mV for TPGS vs. −13.3 ± 2.3 mV for P407 NCs). The morphology of the NCs was evaluated by SEM. The micrographs confirmed the particle size reduction of GLPG0555 from the starting material (). Initial GLPG0555 presented a heterogeneous population of ‘crystal rock’ particles, some of them reaching particle sizes above 100 µm. On the contrary, NCs () showed a vast population of particles below 1 µm in agreement with laser diffraction. Images showed that the majority of particles presented an irregular or four sided-polygon or rhombohedral shape. Aqueous resuspension of NCs after freeze-drying results depicted in showed a higher Dv90 value for TPGS-NCs than in the previous screening (7.3 ± 5 µm instead of 1.4 µm), showing also more variability between batches in comparison with the FD P407 NCs. The presence of some particles in the micron-size range could be observed in the laser diffraction PSD graph (). The percentages of sample recovery over the initial amount of GLPG0555 were significantly higher for the TPGS NCs (37.5 ± 3.0%) in comparison with the P407 formulation (26.8 ± 2.0%) (). A UHPLC method was developed to quantify the total amount of GLPG0555 in the FD formulations. The drug loading for the TPGS NCs was slightly lower but still very similar than for P407 NCs (83.1 ± 1.7 vs. 85.5 ± 3.7%, respectively) (). shows representative fusion enthalpy curves for both FD formulations analyzed by DSC. Melting temperature ranges were close to the ones found for the initial material (220 − 230 °C). When compared to the initial material, calculated crystallinity indicated that TPGS NCs presented a slightly more amorphous content than the P407 NCs (81.3 vs. 90.5%, respectively).
Figure 2. Complete characterization for the two selected GLPG0555 NCs (TPGS API/s ratio 1/0.1 and P407 API/s ratio 1/0.05 formulation conditions are shown in red and green, respectively). (A) Dv50 and Dv90 PSD values of fresh formulations measured by laser diffraction. (B) Particle population distribution by intensity representative peak curves of fresh formulations measured by DLS. (C) Representative zeta potential distribution curves of fresh formulations. (D) SEM representative micrographs of the initial GLPG0555, washed TPGS-stabilized NCs (E), and P407-stabilized NCs (F). Magnification is 10,000x. (G) Dv50 and Dv90 PSD values were measured by laser diffraction of FD NCs after resuspension in Milli-Q water. (H) PSD representative graphs by volume density obtained by laser diffraction of FD NCs after resuspension in Milli-Q water. (I) Total GLPG0555 recoveries after wet milling, sample harvesting, and freeze-drying. (J) Total GLPG0555 content of the NCs quantified by UHPLC. (K) Representative thermograms of the initial GLPG0555 and the NCs measured by DSC. Fusion transition events occurred around 220–230 °C. (L) Dissolution profile of GLPG0555 in both PBS (dotted lines) and in the ‘MPs release study’ medium (continuous lines). GLPG0555 was quantified by UHPLC. All results are represented by the mean ± sd (n ≥ 3, *p < 0.05, **p < 0.01, ***p < 0.001, and ****p < 0.0001); ns means non-significant.

The concentration in solution of initial (i.e. not wet-milled) GLPG0555 was not quantifiable (< 0.1 µg/mL) in the medium containing PBS. A considerable dissolution rate enhancing effect was observed using a high concentration of surfactants (i.e. ‘release study medium’), reaching a concentration plateau around 8 µg/mL after 24 h (, continuous line). Compared with the initial compound, the dissolution profile for the NCs depicted a decay. In both cases, NCs increased the dissolution rate of the API due to their larger specific surface area. The concentration values observed at equilibrium (24 h) were significantly higher in the PBS buffer (, dotted lines) especially in the case of the TPGS NCs (0.70 ± 0.16 µg/mL vs. 0.27 ± 0.18 for the P407 NCs). These values increased by 15 and 35-fold in the release medium (, continuous lines) for the TPGS and P407 NCs, respectively. In both cases, TPGS (API/s ratio 1/0.1) NCs enhanced the dissolution of GLPG0555 compared to P407 (API/s ratio 1/0.05) NCs.
3.3. Interaction of the nanocrystals with the spray-drying feed solution
A preliminary SP step is the preparation of the SP feed solution. The goals of this study were to examine the stability and redispersibility of the 2 previously characterized NCs and to screen a suitable organic solvent composition for SP. Three organic solvent binary mixtures were screened. First, the interaction between NCs and a realistic polymer/solvent mixture was evaluated by measuring variations in the enthalpies of fusion (ΔH) of the FD NCs after their redispersion. Taking ΔH values of both GLPG0555 NCs alone as controls, results in showed that the physical mixture NCs + polymer 753H considerably reduced the endothermic peak area of the GLPG0555 from −90/−100 to −65/−55 Jg−1 for TPGS and P407 NCs, respectively. These values were reduced to a greater extent in the presence of the organic solvents, except for ACE-EtOH (9:1 v/v), which maintained similar values. The mixture with DCM-MeOH (85:15 v/v) showed the lowest ΔH values, these ones being around 30 Jg−1 for both NCs.
Figure 3. Interaction of the FD TPGS (API/s ratio 1/0.1) and P407 (API/s ratio 1/0.05) GLPG0555 NCs, in red and green, respectively, with the SP feed solution. (A) Normalized enthalpies of fusion (ΔH) of the NCs were analyzed by DSC. Polymer reference used was PLGA 753H (concentration 7.5% w/v) and TDL for NCs was 25% w/w. Results are the mean ± s.d. (n = 3). (B) PSD was analyzed by laser diffraction after resuspension of the FD NCs formulations in two different ACE mixtures. Resuspension of NCs in Milli-Q water was used as a reference control. For PSD only D[3;2] (µm) values are shown. Results are the mean ± s.e.m. (n = 3).
![Figure 3. Interaction of the FD TPGS (API/s ratio 1/0.1) and P407 (API/s ratio 1/0.05) GLPG0555 NCs, in red and green, respectively, with the SP feed solution. (A) Normalized enthalpies of fusion (ΔH) of the NCs were analyzed by DSC. Polymer reference used was PLGA 753H (concentration 7.5% w/v) and TDL for NCs was 25% w/w. Results are the mean ± s.d. (n = 3). (B) PSD was analyzed by laser diffraction after resuspension of the FD NCs formulations in two different ACE mixtures. Resuspension of NCs in Milli-Q water was used as a reference control. For PSD only D[3;2] (µm) values are shown. Results are the mean ± s.e.m. (n = 3).](/cms/asset/aad1fe13-1d10-463c-9995-03712e48f1bb/idrd_a_2284683_f0003_c.jpg)
In order to provide a more solid interpretation of the previous results, particle size changes after NCs reconstitution in the SP feed solution were assessed by laser diffraction. In this experiment, resuspension of the NCs in Milli-Q water, characterized in previous points, was used as a reference control. To help understanding of the results, only shows the surface moment mean diameter D[3;2] to observe direct distribution changes of the finest particles. Measurements were taken after both NCs formulation concepts were redispersed only in the binary organic solvent mixtures containing ACE. The mixture NCs + ACE-EtOH (9:1 v/v) showed better redispersion and/or a less particle growth. D[3;2] values were around 2–3 µm in ACE-EtOH (9:1 v/v) and around 6–7 µm in ACE-MeOH (85:15 v/v) for both NCs. These results showed a similar trend and correlated with the DSC experiments so that the organic solvent binary mixture ACE-EtOH (9:1 v/v) was selected for the following steps.
3.4. The effect of stabilizers on the properties of spray-dried nanocrystals loaded into polymeric microparticles
With the SP set-up shown in , yields of 75% for blank 753H MPs were achieved and Dv50 and Dv90 values were 7 and 52 µm, respectively. Using these same parameters, we integrated in the study the two GLPG0555 NCs (TPGS and P407 API/s ratio 1/0.1 and 1/0.05, respectively) optimized and selected in previous sections. A yield decrease was observed after NCs loading, these percentage values being 47% and 33% for the TPGS NCs-753H MPs and the P407 NCs-753H MPs, respectively. The particle size of the SP MPs increased for both formulations after NCs loading (). The Dv50 and Dv90 values were 15 and 35 µm for the TPGS NCs and 24 and 93 µm for the P407 NCs (see SM, Table S5 for further information). The efficiencies of encapsulation were around 80–90%, confirming the successful encapsulation of the GLPG0555 using this technique.
Figure 4. (A) PSD representative graphs of MPs by volume density obtained by laser diffraction. SEM representative micrographs of (B) blank 753H MPs, (C) TPGS NCs-753H MPs, (D) P407 NCs-753H MPs, and (E) TPGS NCs-753H MP cross section. Magnifications are 4500x and 9000x for the cross-section MP. (F) Representative thermograms of the TPGS and P407 NCs loaded in the 753H MPS analyzed by DSC. Fusion transition events occurred around 200–230 °C. (G) Efficacies of encapsulation (EE), expressed as a percentage. Values are the mean ± s.d. (n = 3). (H) Yields expressed as a percentage (100% is the initial mass weighted). n = 1. (I) PSD measured by laser diffraction after MPs resuspension. Only Dv50 and Dv90 (dotted) values are shown, n = 1. For F–H, three polymers (653H, 753H, and 203H) and two GLPG0555 NCs (TPGS API/s ratio 1/0.1, in red and P407 API/s ratio 1/0.05, in green) are shown.

Table 2. SP parameters for the formulations of MPs.
When these MPs were visualized by SEM (), we could state that the majority of particle size diameters were between 1 and 10 µm and not bigger than 40 µm in agreement with laser diffraction measurements, with the expected particle heterogeneity since using a bi-fluid nozzle (Wan & Yang, Citation2016). Particle size diameters above this value were probably particle clusters or agglomerates. In any case, it has to be kept in mind that PSD curves in are depicted as a percentage of volume density and that the number of MPs between 1 and 10 µm is predominant as observed by SEM. Regarding particle morphology, SEM micrographs revealed that the MPs were spherical and showed smooth surfaces. In that sense, particles conserved their integrity after the NCs encapsulation, and API-free NCs were not observed. More irregular shapes and surfaces were found in the loaded NCs, especially in the P407 NCs-753H MPs (). The cross section image of a TPGS NCs-753H MP in showed that the entrapment of the NCs mainly occurs in the particle core matrix. In addition, DSC analysis revealed remarkable differences in the thermograms of the NCs after their encapsulation, using 753H again as reference polymer. Enthalpies normalized to API amount were −98.6 ± 4.7 and −75.5 ± 1.5 Jg−1 for the TPGS and P407 NCs, respectively. Representative curves depicted in revealed an earlier temperature onset and a higher enthalpy of fusion for the TPGS NCs, whereas P407 NCs exhibited a striking recrystallization peak.
Instead of replicating NCs loaded 753H MPs formulations, it was decided to introduce the 653H and 203H polymers to base our optimization on a stronger foundation. All these polymers display a biodegradation around 2–6 months, similar characteristics (e.g. MW and viscosity) but different lactic to glycolic acid ratio (SM, Table S1). Regarding E.E. results (), no remarkable differences were observed among the polymers nor the two NCs, these values being around 80–90% for all the formulations. Results in showed a trend for higher yields for TPGS NCs-753H and −203H MPs (40–50% vs. 30%, approximately), compared with their P407 counterparts. Importantly, PSD measured by laser diffraction revealed considerable differences. Briefly, as observed in , Dv90 values were above 90 µm for all the P407 NCs-MPs and below 70 µm for all the TPGS NCs-MPs (see SM, Table S5 for further details). This indicated that the TPGS MPs exhibited not only a smaller particle size but also less agglomeration, independently of the polymer used and using the same SP conditions. For all these assets, the majority of the release tests performed in the next sections focused on the TPGS NCs concept formulations.
3.5. The effect of polymer concentration and theoretical drug loading on drug release profile of microparticles
An optimal polymer concentration and TDL was screened by evaluating mainly their controlled drug release behavior over four months. Although yields were drastically improved selecting polymer concentrations below 5%, the optimal polymer concentration used for the blank MPs, these MPs presented high porosity when visualized by SEM (). Regardless of that, EE were around 80–90% for all the formulations () so that this response was not considered pivotal here. Yields and Dv90 values were also plotted () to monitor the reproducibility (yields > 30%) and particle resuspension (Dv90 < 60 µm). This threshold set was surpassed with polymer concentrations and TDLs above 7.5% w/v and 25% w/w, respectively. Cumulative release profiles for each formulation in the course of four months are represented in . Polymer concentrations below 5% w/v induced a massive burst release, and almost all the drug content was released over one month or less (grey, red, and light blue lines). This uncontrolled drug release was prevented when the polymer concentration was raised up to 7.5% w/v. Initial burst release values for these MPs reached only around 5–10%, and are attributed to the rapid dissolution of the NCs deposited on the surface of the MPs. A polymer concentration of 7.5% w/v and TDL of 25 (green line) or 37.5% w/w (pink line) released around 50–60% of its drug content over three months. A lower TDL (i.e. 12.5%, in dark blue) resulted in a very low initial (burst) release but only 35% of total drug content, approximately, was released over three months. A similar effect, attributed to a densification of the de MP matrix, was observed when the polymer concentration was increased up to 10% w/v (purple line), in this case cumulative drug release values reaching values close to 50% over three months.
Figure 5. Optimization of SP 753H polymer MPs loaded with TPGS (API/s ratio 1/0.1) GLPG0555 NCs: polymer concentration (% w/v) vs. TDL (% w/w). (A) SEM representative micrographs. Magnification is 4500x. (B) Efficacies of encapsulation (EE) expressed as a percentage. Data is the mean ± s.d. (n = 3). (C) Yields vs. dv90. Yields are expressed as a percentage (100% is the initial mass weighted). Dv90 values are measured by laser diffraction after MPs resuspension. (D) Cumulative drug release profiles (%) over four months. Data is the mean ± s.d. (n = 3). (E) Summary of fit plot (partial least squares regression model) for seven responses. Only R2 and Q2 values are shown. (F) Sweet spot plot. Met criteria response value limits were: yield > 30, Dv90 < 60 µm, burst release < 20%, 28 d release 10–50%, 56 d release 35–70%, 84 d release 50–90% and 112 d release > 80%. Data was plotted with MODDE 12.1. (Sartorius, Göttingen, Germany), using a ‘full factorial 2 levels’ orthogonal (balanced) design with all combinations of the factor levels. Main effects and all interactions are clear of each other (not confounded). n° experiments = 7 and n = 1.

Previous data was fed into a ‘full factorial 2 levels’ orthogonal design to define a potential tentative working space for developing GLPG0555 NCs-MPs made of polymers of similar characteristics. Residuals normality was used to identify outliers, resulting in the exclusion of 4 specific responses out of 49, corresponding to 7 formulations (SM, Table S6 and Figure S6). The quadratic model generated was fitted against the data and the response is shown in the summary of fit plot (), which provides information on the strength and robustness of the model. The R2 values close to 1 indicates a low variation in the responses and a strong fit between the data and the model. The Q2 values, ideally >0.25–0.5, demonstrated a modest to high predictive power, allowing for prediction of the effect of changing process parameters. Responses for each formulation established for the two factors (i.e. polymer concentration and TDL) included yields, Dv90 and cumulative release values at four time points: burst release, one, two, three months and four months, approximately. A sweet spot graph was plotted in as a function of delimited minimum and maximum values tolerated. Greener areas were translated into a narrow spectrum for the x-axis factor (polymer concentration), starting above 6.75% w/v. In the case of the y-axis factor (TDL), the possibilities were broader but always constrained to a polymer concentration between 6.5% and 9% w/v. Formulating TPGS NCs-753H MPs, we were able to explore a suitable work space in terms of polymer concentration and TDL, mainly focusing on the MPs cumulative release as an outcome.
3.6. The effect of polymer type on drug release profile of microparticles
This approach mainly included testing of three polymers with similar MWs and viscosities but with different PLA/PLGA compositions (i.e. 653H, 753H, and 203H). All MPs batches were prepared under the same conditions () and were majorly loaded with TPGS GLPG0555 NCs (see SM, Table S5 for further details). Cumulative release profiles of the formulations over four months are depicted in . Formulated MPs exhibited a low burst release and a controlled release profile, whereas the NCs (grey dotted lines) released all their content from the beginning of the experiment. Here, drug concentration values remained steady and with no apparent chromatographic changes during all the study, indicating that GLPG0555 was not sensitive to the study conditions. TPGS NCs-753H (red line) and TPGS NCs-203H MPs (dark blue line) MPs displayed a similar release during the first month of the study, reaching cumulative release values around 50% over 28 d. TPGS NCs 203H MPs reached a plateau at day 28 and a steady release state until the end of the experiment. The TPGS NCs-753H MPs had a slowed-down release during the second month but released almost all their content (90%) over four months. Interestingly, a physical mixture of two 753H MPs formulations of different polymer concentrations (pink dotted lines), slightly accelerated the previous release rate values. Of note, the P407 NCs-753H MPs (green line) exhibited a different behavior compared to its TPGS counterpart. Here, drug release was continuous but slower and finally, only a 60% of the total drug content was released over four months. The TPGS NCs-653H MPs (violet line) presented a little burst release (≤ 10%) and a constant drug release close to a zero-order release profile (R2: 0.97) for four months, when almost all the total drug content (90%) was released. However, when equal amount ratios of 503H and 753H polymers in the same MPs were introduced in the formulation (light blue dotted lines), a very similar release profile in comparison with the 753H MPs was obtained. The best-fit drug release function models are indicated in the legend of for all the formulations tested.
Figure 6. GLPG0555 cumulative release in percentage vs. time for seven MPs formulations containing different polymers. Data is the mean ± s.d. (n = 3). The resulting curves were fitted using different models: zero and first order, Higuchi, Hixson, and Korsmeyer–Peppas (K.P). Best model fits calculated according to the higher R2 values are shown.

In parallel, the main four MPs formulations (, continuous lines) were evaluated by SEM every month to monitor the physic-chemical degradation of the particles. Micrographs in show the progressive hydrolysis, erosion, and swelling of the particles along four months, in agreement with their release profile. It was observed that the MPs containing polymers 653H () and 753H () lost their particle integrity and/or sphericity between three and four months. Instead, the initial particle morphology of the MPs was better preserved in the case of the P407 NCs-753H () MPs, and especially TPGS NCs-203H MPs ().
Figure 7. SEM representative micrographs of four MPs formulations kept under the same conditions of the release studies. Day 0 corresponds to the freshly prepared MPs. At days 28, 56, 84, and 112, samples were withdrawn, FD and kept at 2–8 °C before SEM sample preparation. (A) TPGS NCs-653H MPs; (B) TPGS NCs 753H MPs; (C) P407 NCs-753H MPs, and (D) TPGS NCs-203H MPs. Magnification is 4500x.

4. Discussion
Top-down methods to produce NCs with low soluble drugs are commonly proposed across the industry due to their ease of implementation and scalability (van Eerdenbrugh et al., Citation2008; Malamatari et al., Citation2018). Here, the optimization of a low shear wet milling semi-industrial process allowed the formulation of stable GLPG0555 nanosuspensions at a 5-g scale at 100 mg/g GLPG0555. Stabilizer selection required experimental screening to identify nanosuspension formulations with sufficient stability to avoid Ostwald ripening and agglomeration, among other events (Malamatari et al., Citation2018). The intent was to screen a range of nonionic stabilizers or surfactants compatible with clinical use (e.g. T80, TPGS, P188, and P407) (van Eerdenbrugh et al., Citation2008). Others, such as Tween20, LipoidS100, or PEG3355 or some adsorption-steric combinations, failed in previous screenings (SM, Figures S2 and S3). Their distinct hydrophilicity/hydrophobicity (HLB) value, chain morphology, and MW are the main driving forces for physical adsorption on the particle surface that explain the differences encountered among them () (Bonhoeffer et al., Citation2022). Following the approach proposed by Ferrar et al., a downward API/s ratio optimization allowed us to determine the most promising stabilizers and their minimum amount required for GLPG0555 (Ferrar et al., Citation2020). Best results were obtained with the FDA-approved excipients TPGS and P407.
In order to obtain a redispersable NCs powder, freeze-drying was chosen instead of SP to avoid secondary drying and yield loss. In both cases, common drying protectants include sugars (van Eerdenbrugh et al., Citation2008; Jermain et al., Citation2018). These molecules are not soluble in organic solvents, thus affecting the SP process. Therefore, the challenge consisted of repurposing the wet milling stabilizers as cryoprotectants, with the advantage of avoiding a tedious washing step. Interestingly, TPGS and P407 showed cryoprotectant abilities. PSD measurements confirmed that particle growth or agglomeration was prevented, most probably by taking advantage of the principles of steric hindrance of the stabilizers and maintaining a total drug loading of around 83 and 85% w/w along the process. Results indicated that the stabilizer P407 possessed better protective ability than TPGS (), but it was not clear if it was related only to a lower milling efficacy in terms of total mass (). It is convenient to have in mind that the MW of this poly(ethylene oxide)-poly(propylene oxide) block copolymer is 8-fold higher than TPGS, meaning that the molar ratio was considerably lower (Bodratti & Alexandridis, Citation2018). This suggests that a better surface adsorption of the wet milling stabilizer (TPGS) may ameliorate the wet milling perspectives and that a higher steric hindrance of this stabilizer (with P407) could confer a higher cryo/lyo-protection.
Due to their higher specific surface area, both GLPG0555 NCs formulations displayed a significantly increased dissolution rate compared to the initial material (which was negligible in the physiologic release medium, i.e. PBS), per se representing a therapeutic advantage. In this case, TPGS triggered higher drug dissolution rates than P407 (). In fact, the solubility enhancement effect of this synthetic surfactant, derived from the esterification of vitamin E succinate with PEG 1000, is well acknowledged (Sotthivirat et al., Citation2020). The previous dissolution rate values were considerably increased in the ‘release study medium’ containing surfactants (see the Methodology section for further details). Importantly for our study, this increased solubility allowed analyzing the MPs’ cumulative release profile properly in the following sections.
The previous NCs powders obtained were intended to be correctly reconstituted or redispersed in an organic-polymer feed solution, to be subsequently spray-dried. Thus, a pre-requisite should be to study the physical state and chemical stability of the API in the regularly used volatile organic solvent (Paudel et al., Citation2013). Solid-state analysis by DSC is a common procedure performed before and after SP; however, it is not frequently applied for the preparation/optimization of the feed solution (Kojima et al., Citation2013). In this case, the analysis was performed once the organic solvent was evaporated, as it happens in the SP process. This allowed comparing the different phase behaviors of the GLPG0555 NCs depending on the surrounding polymer-organic solution. DCM was introduced in the experiment since it is the standard solvent used, but non-halogenated less toxic, and less apolar solvents, such as ACE were also explored/considered. In order to obtain binary mixtures, EtOH and/or MeOH were selected as anti-solvents (poor solvents) for PLGA/PLA, taking advantage that they also lower the surface tension of the atomized droplets (Wan et al., Citation2013). In order to simulate completely the characteristics of the SP feed solution, the polymer 753H was also incorporated. Reduction of the initial enthalpy peak area of the NCs found () was associated to a particle integrity loss in contact with the SP feed solution. In the case of DCM, this could be triggered by a stronger solute-solvent affinity, in all cases boosted by the presence of a hydrophobic polymer in the solution. One foreseen and undesired consequence is an eventual particle aggregation or growth, translating into a poor redispersion or stability of the NCs in the SP feed solution (). In the context of the encapsulation of redispersed NCs in a supersaturated solution, this was expected to affect the robustness, reproducibility, and yield of the SP process. For that reason, NCs redispersion in the previous binary solvent mixtures was analyzed by laser diffraction and allowed to support this affirmation. It could be fruitful to optimize a DLS method to enable introduction of the polymer and halogenated solvents (i.e. DCM) as well. X-rays diffraction analysis but also other alternatives, like the nucleation and crystal growth protocols proposed by Lindfors et al., might be also valuable here (Lindfors et al., Citation2008). On the other hand, precipitation inhibitors, mainly used for hydrophilic formulations such as cellulose derivatives, should be further investigated for implementation in hydrophobic matrices (Singh & van den Mooter, Citation2016; Ting et al., Citation2023). For instance, a potential reported stabilizer for this task and compatible with PLGA proposed is the polymer polyvinylpyrrolidone (Meeus et al., Citation2012; Kojima et al., Citation2013). As previously mentioned for the particle solid-state analysis by DSC, size measurement by laser diffraction is also rarely performed after particle redispersion. Yet, as shown in our study, this approach allows to understand the fate of the NCs in the feed solution and also to select the organic solvent that preserved more the native characteristics of the NCs (here, ACE-EtOH (9:1 v/v)).
MPs containing copolymers with similar viscosity and MW (SM, Table S1) but different percentage of PLA (i.e. 653H, 753H, and 203H) were loaded with two standardized NCs formulations for comparison. In all the cases, the efficacy of the encapsulation was very high, confirming that the microencapsulation of GLPG0555 was very efficient with this technique, independently of the polymer and NCs used. High yields around 75% were reached with blank MPs, considered as an optimal result since the yields for SP PLGA/PLA MPs hardly surpass the 80%. However, keeping constant system flows and temperatures, thus maintaining the same energy balance (), the introduction of the NCs in the system reduced these yield values. This was more pronounced in the case of P407 formulations (). This was not expected in the context of yield loss associated to particle stickiness because P407 was supposed to induce less polymer plasticity. It is thought that longer stabilizer chains restrain intermolecular movements, which consequently decreases the glass transition temperature of the polymer (Singh & van den Mooter, Citation2016).
The lower Dv90 values and, therefore, better particle resuspension observed with the TPGS MPs might be linked to a different particle surface rearrangement. For instance, TPGS, with a lower HLB value than P407, could be displaced to the outer layers of the particle in the presence of EtOH during droplet drying. Nevertheless, MPs mean particle size was still compatible with an IA injection, this being expected to avoid clearance from the knee and not trigger inflammation. In that sense, an efficient retention for MPs of 10 μm, independently of the joint inflammatory status, was reported (Pradal et al., Citation2016). Also, as a proof concept, the marketed triamcinolone PLGA microspheres for intraarticular injection in OA (Zilretta®) have a reported particle size of around 45 μm (Paik et al., Citation2019).
The study shows in an optimization approach according to polymer concentration and TDL with the aim of obtaining appropriate yields and Dv90 values, with a controlled and continuous release over four months. Using the TPGS NCs-753H MPs as our formulation concept of reference, results indicated that this technique conferred certain freedom when fixing a TDL of interest. For instance, we were able to obtain a controlled release over four months with a TDL of 37.5% w/w, which represents a very high drug loading for PLGA MPs (Han et al., Citation2016). In a similar study, it was reported a TDL of the 50% with celecoxib NCs-205S MPs, without compromising their controlled release over at least three months (Salgado et al., Citation2020). Due to the limited joint space, large volumes are not allowed for IA injections so that very high drug-loaded sustained-release drug delivery systems represent a real asset. Conversely, meeting an appropriate polymer concentration (e.g. > 6% w/v) threshold is crucial for the successful design of the controlled drug delivery system. These data also showed that the MPs release profile can be tailored to a great extent by understanding the role of the NCs and excipients as pore-forming agents (Nandiyanto & Okuyama, Citation2011). By including the yield and Dv90 responses, we added relevant information about the scalability potential and flexibility of the factors used. The sweet plot graph () delineated an area of interest to work that furthermore matched with the polymer concentration (7.5% w/v) and TDL (25% w/w) used in the study. Even if these delimitations could be improved by repeating experiments (i.e. 7 formulations); they are beneficial to predict the long-term drug release behavior of MPs of similar characteristics. The knowledge acquired in this section might expedite further optimizations or escalations to improve yields or particle resuspension while diminishing risks of affecting their release behavior.
All the polymers selected in this study presented a theoretical biodegradation between 2 and 6 months. Release studies were performed to characterize the profile of the MPs according to their different PLA percentages. shows either a biphasic release or the so-called 3-phase release (burst, plateauing, and bulk swelling-induced final increase of the release) of the MPs (Xu et al., Citation2016). Results indicated that the yields and/or PSD differences could have an impact on the first phases (during the first month) of the release. TPGS NCs-753H and −203H MPs, with higher yields and lower mean particle size than other formulations presented a faster release over that period. Moreover, the different profiles observed for the P407 NCs-753H MPs confirmed once again that the nature of the stabilizer used impacts directly (swelling/erosion) or indirectly (yield, PSD) the release profile of the MPs. In vitro results confirmed that PLA percentages should be under 100% in favor of PGA for a continuous release over 3–4 months. In this study, the release profile corresponding to the formulation containing 65% of PLA and 35% of PGA (SM, Figure S5) was considered optimal since it followed a zero-order model (i.e. a reservoir with constant opening area-like behavior) (Siepmann & Siepmann, Citation2008). Under this statement, it was intended to obtain a progressive polymer degradation () to warrant a local therapeutic activity/bioavailability for a compound with very low solubility, such is the case of the GLPG0555. It is important to keep in mind that an IA compartment may not display ‘sink’ conditions. However, major particle degradation in vivo is expected. This, together with a formulation sterilization by gamma irradiation may accelerate the drug release observed in vitro (Barbosa-Alfaro et al., Citation2021). In this section, the scalability potential of this concrete formulation was not taken into account, having in mind that yield and PSD perspectives are normally ameliorated during SP escalation (Sosnik & Seremeta, Citation2015). Encouragingly, with the proposed approach it was demonstrated that it is feasible and realistic to tailor the release behavior of the GLPG0555 NCs. Among other advantages, this reduces the need of repeated administrations, which increases the therapeutic chances with a view to a pre-clinical and clinical assessment.
5. Conclusion
The implementation of nano- and micro-technologies can provide a second opportunity to drugs with very low solubility to improve their therapeutic perspectives in the clinic. We have presented the case study of the potential OA drug GLPG0555, including a rational design for the construction of a NCs-polymer microparticulate system for long-term release IA delivery. This guide combines wet milling, freeze-drying, and SP as a unique strategy to efficiently microencapsulate this drug at very high loading under the form of NCs in a hydrophobic polymeric matrix. Working in parallel with two NCs containing TPGS and P407 and testing different PLGA and PLA polymers, permitted to identify and elucidate crucial points and the emerging questions along the development of this kind of formulations.
Dealing with local delivery systems, there is a stringent need for a highly loaded system occupying the least volume while enabling a long-term treatment to avoid frequent, repeated injections. Results showed a successful, ready to upscale formulation containing NCs embedded in MPs with a significant API encapsulation load of 25%, that exhibited a continuous and controlled drug release profile over four months. This formulation strategy has allowed us to overcome the limitations of a practically insoluble drug that was intended for an IA administration in OA. Moreover, it holds promise for other local administration routes, such as for intravitreal or intrathecal ones. This framework also provides knowledge of interest supported by robust and reproducible data to encourage formulation scientists to apply this concept not only to new drugs (e.g. GLPG0555) but also to classic insoluble drugs such can be the case of itraconazole or indomethacin.
Ethical approval statement
NA.
CRediT authorship contribution statement
Rodríguez-Nogales C.: Methodology, Investigation, Data curation, Formal analysis, Writing-original draft. Meeus J.: Methodology, Investigation, Resources, Validation, Writing – review and editing. Thonus G.: Methodology, Investigation, Validation, Writing – review and editing. Corveleyn S.: Resources, Validation, Supervision, Writing – review and editing. Allémann E.: Conceptualization, Resources, Validation, Writing – review and editing, Supervision. Jordan O.: Conceptualization, Supervision, Validation, Writing – review and editing. All authors have approved the submitted final version. All authors have read and agreed to the published version of the manuscript. All authors listed from Galapagos have substantially contributed to the design of the work and interpretation of the data.
Supplemental Material
Download MS Word (981.2 KB)Disclosure statement
No potential conflict of interest was reported by the authors. Gaby Thonus owns subscription rights of Galapagos. Sam Corveleyn and Joke Meeus are employee of Galapagos and own subscription rights in the company.
Data availability statement
The data presented in this study are available on request from the corresponding author.
Additional information
Funding
References
- Amidon GL, Lennernäs H, Shah VP, Crison JR. (1995). A theoretical basis for a biopharmaceutic drug classification: the correlation of in vitro drug product dissolution and in vivo bioavailability. Pharm Res 12:1–14. doi: 10.1023/A:1016212804288.
- Barbosa-Alfaro D, Andrés-Guerrero V, Fernandez-Bueno I, et al. (2021). Dexamethasone PLGA microspheres for sub-tenon administration: influence of sterilization and tolerance studies. Pharmaceutics 13:228. doi: 10.3390/PHARMACEUTICS13020228.
- Bodratti AM, Alexandridis P. (2018). Formulation of poloxamers for drug delivery. J Funct Biomater 9:11. doi: 10.3390/JFB9010011.
- Bonhoeffer B, Kordikowski A, John E, Juhnke M. (2022). Numerical modeling of the dissolution of drug nanocrystals and its application to industrial product development. Admet DMPK 10:253–87. doi: 10.5599/ADMET.1437.
- Ferrar JA, Sellers BD, Chan C, Leung DH. (2020). Towards an improved understanding of drug excipient interactions to enable rapid optimization of nanosuspension formulations. Int J Pharm 578:119094. doi: 10.1016/J.IJPHARM.2020.119094.
- Gonzalez-Fernandez P, Rodríguez-Nogales C, Jordan O, Allémann E. (2022). Combination of mesenchymal stem cells and bioactive molecules in hydrogels for osteoarthritis treatment. Eur J Pharm Biopharm 172:41–52. doi: 10.1016/J.EJPB.2022.01.003.
- Han FY, Thurecht KJ, Whittaker AK, Smith MT. (2016). Bioerodable PLGA-based microparticles for producing sustained-release drug formulations and strategies for improving drug loading. Front Pharmacol 7:185. doi: 10.3389/FPHAR.2016.00185.
- Hunter DJ, Bierma-Zeinstra S. (2019). Osteoarthritis. Lancet 393:1745–59. doi: 10.1016/S0140-6736.(19)30417-9.
- Jermain SV, Brough C, Williams RO. (2018). Amorphous solid dispersions and nanocrystal technologies for poorly water-soluble drug delivery – An update. Int J Pharm 535:379–92. doi: 10.1016/J.IJPHARM.2017.10.051.
- Kojima Y, Ohta T, Shiraki K, et al. (2013). Effects of spray drying process parameters on the solubility behavior and physical stability of solid dispersions prepared using a laboratory-scale spray dryer. Drug Dev Ind Pharm 39:1484–93. doi: 10.3109/03639045.2012.692378.
- Lindfors L, Forssén S, Westergren J, Olsson U. (2008). Nucleation and crystal growth in supersaturated solutions of a model drug. J Colloid Interface Sci 325:404–13. doi: 10.1016/J.JCIS.2008.05.034.
- Malamatari M, Taylor KMG, Malamataris S, et al. (2018). Pharmaceutical nanocrystals: production by wet milling and applications. Drug Discov Today 23:534–47. doi: 10.1016/J.DRUDIS.2018.01.016.
- Maudens P, Jordan O, Allémann E. (2018a). Recent advances in intra-articular drug delivery systems for osteoarthritis therapy. Drug Discov Today 23:1761–75. doi: 10.1016/J.DRUDIS.2018.05.023.
- Maudens P, Seemayer CA, Pfefferlé F, et al. (2018b). Nanocrystals of a potent p38 MAPK inhibitor embedded in microparticles: therapeutic effects in inflammatory and mechanistic murine models of osteoarthritis. J Control Release 276:102–12. doi: 10.1016/J.JCONREL.2018.03.007.
- Maudens P, Seemayer CA, Thauvin C, et al. (2018c). Nanocrystal–polymer particles: extended delivery carriers for osteoarthritis treatment. Small 14:1703108. doi: 10.1002/SMLL.201703108.
- Meeus J, Chen X, Scurr DJ, et al. (2012). Nanoscale surface characterization and miscibility study of a spray-dried injectable polymeric matrix consisting of poly(lactic-co-glycolic acid) and polyvinylpyrrolidone. J Pharm Sci 101:3473–85. doi: 10.1002/JPS.23131.
- Nandiyanto ABD, Okuyama K. (2011). Progress in developing spray-drying methods for the production of controlled morphology particles: From the nanometer to submicrometer size ranges. Adv Powder Technol 22:1–19. doi: 10.1016/j.apt.2010.09.011.
- Paik J, Duggan ST, Keam SJ. (2019). Triamcinolone acetonide extended-release: a review in osteoarthritis pain of the knee. Drugs 79:455–62. doi: 10.1007/s40265-019-01083-3.
- Paudel A, Worku ZA, Meeus J, et al. (2013). Manufacturing of solid dispersions of poorly water soluble drugs by spray drying: formulation and process considerations. Int J Pharm 453:253–84. doi: 10.1016/J.IJPHARM.2012.07.015.
- Phillips DJ, Pygall SR, Cooper VB, Mann JC. (2012). Overcoming sink limitations in dissolution testing: a review of traditional methods and the potential utility of biphasic systems. J Pharm Pharmacol 64:1549–59. doi: 10.1111/J.2042-7158.2012.01523.X.
- Pradal J, Maudens P, Gabay C, et al. (2016). Effect of particle size on the biodistribution of nano- and microparticles following intra-articular injection in mice. Int J Pharm 498:119–29. doi: 10.1016/J.IJPHARM.2015.12.015.
- Salgado C, Guénée L, Černý R, et al. (2020). Nano wet milled celecoxib extended release microparticles for local management of chronic inflammation. Int J Pharm 589:119783. doi: 10.1016/J.IJPHARM.2020.119783.
- Siepmann J, Siepmann F. (2008). Mathematical modeling of drug delivery. Int J Pharm 364:328–43. doi: 10.1016/j.ijpharm.2008.09.004.
- Singh A, van den Mooter G. (2016). Spray drying formulation of amorphous solid dispersions. Adv Drug Deliv Rev 100:27–50. doi: 10.1016/J.ADDR.2015.12.010.
- Sosnik A, Seremeta KP. (2015). Advantages and challenges of the spray-drying technology for the production of pure drug particles and drug-loaded polymeric carriers. Adv Colloid Interface Sci 223:40–54. doi: 10.1016/J.CIS.2015.05.003.
- Sotthivirat S, Ramesh R, Wasylaschuk W, et al. (2020). Effect of TPGS surfactant on dissolution sensitivity of a poorly water-soluble drug using high-shear wet granulation. Powder Technol 375:302–9. doi: 10.1016/j.powtec.2020.07.093.
- Ting JM, Tale S, Purchel AA, et al. (2023). High-throughput excipient discovery enables oral delivery of poorly soluble pharmaceuticals. ACS Cent Sci 2:748–55. doi: 10.1021/acscentsci.6b00268.
- van Eerdenbrugh B, van den Mooter G, Augustijns P. (2008). Top-down production of drug nanocrystals: nanosuspension stabilization, miniaturization and transformation into solid products. Int J Pharm 364:64–75. doi: 10.1016/J.IJPHARM.2008.07.023.
- Wan F, Bohr A, Maltesen MJ, et al. (2013). Critical solvent properties affecting the particle formation process and characteristics of celecoxib-loaded plga microparticles via spray-drying. Pharm Res 30:1065–76. doi: 10.1007/S11095-012-0943-X.
- Wan F, Yang M. (2016). Design of PLGA-based depot delivery systems for biopharmaceuticals prepared by spray drying. Int J Pharm 498:82–95. doi: 10.1016/J.IJPHARM.2015.12.025.
- Xu Y, Kim CS, Saylor DM, Koo D. (2016). Review Article Polymer degradation and drug delivery in PLGA-based drug-polymer applications: A review of experiments and theories. J Biomed Mater Res B Appl Biomater 105:1692–716. doi: 10.1002/jbm.b.33648.