
 ?Mathematical formulae have been encoded as MathML and are displayed in this HTML version using MathJax in order to improve their display. Uncheck the box to turn MathJax off. This feature requires Javascript. Click on a formula to zoom.
Abstract
The present study was designed to develop a self-micellizing solid dispersion (SMSD) containing Thymoquinone (TQM), a phytonutrient obtained from Nigella sativa seeds, aiming to improve its biopharmaceutical and nephroprotective functions. The apparent solubility of TQM in polymer solutions was used to choose an appropriate amphiphilic polymer that could be used to make an SMSD system. Based on the apparent solubility, Soluplus® was selected as an appropriate carrier, and mixing with TQM, SMSD-TQM with different loadings of TQM (5–15%) was made by solvent evaporation and freeze-drying techniques, respectively, and the formulations were optimized. The optimized SMSD-TQM was evaluated in terms of particle size distribution, morphology, release characteristics, pharmacokinetic behavior, and nephroprotective effects in a rat model of acute kidney injury. SMSD-TQM significantly improved the dissolution characteristics (97.8%) of TQM in water within 60 min. Oral administration of SMSD-TQM in rats exhibited a 4.9-fold higher systemic exposure than crystalline TQM. In a cisplatin-induced (6 mg/kg, i.p.) acute kidney-damaged rat model, oral SMSD-TQM (10 mg/kg) improved the nephroprotective effects of TQM based on the results of kidney biomarkers and histological abnormalities. These findings suggest that SMSD-TQM might be efficacious in enhancing the nephroprotective effect of TQM by overcoming biopharmaceutical limitations.
1. Introduction
Noncommunicable diseases, particularly hypertension and kidney disease, contribute significantly to global morbidity and mortality (Dera et al., Citation2020). Chronic kidney disease (CKD) is a paramount public health concern, with an overall prevalence in Bangladeshi people of 22.48%, which is higher than the global prevalence of CKD (Banik & Ghosh, Citation2021). Thymoquinone (TQM) is one of the most pharmacologically active constituents obtained from Black Cumin seeds (Nigella sativa), which is widely used in traditional medicine as a holistic treatment option (Goyal et al., Citation2017). TQM possesses anticancer, antischistosomal, antifungal, antibacterial, anticonvulsant, hepatoprotective, and neuroprotective activities (Shaterzadeh-Yazdi et al., Citation2018). In addition, the drug exerts its nephroprotective effects through anti-inflammatory and antioxidant activities (Farooqui et al., Citation2017). The LD50 of TQM in rats was reported to be 794.3 mg/kg after oral administration, reflecting TQM’s safety in clinical practices (Al-Ali et al., Citation2008). However, poor aqueous solubility and the consequent inferior oral bioavailability of the drug limit its clinical effect (Elmowafy et al., Citation2016). Solubility of TQM in water was reported to be <1.0 mg/mL at room temperature; therefore, high doses are required in clinical application as a nutraceutical agent (Fahmy et al., Citation2020). Improvement of the dissolution behavior of TQM can enhance oral bioavailability, which, in turn, may increase the therapeutic efficiency of TQM. Only a small number of studies have been reported that employ liposomes, suspensions, solutions, micelle nanoparticles, chitosan nano-vesicles, and chitosan nanoparticles to enhance the therapeutic potential of TQM by increasing the solubility and bioavailability of TQM. However, compared to the solid state, the TQM in these liquid-based formulations was more prone to degradation (Shire, Citation2015).
Additionally, there is little information about the physical stability of TQM-loaded amorphous solid dispersions (ASDs) in the literature. It was claimed that ASD formulations were not thermodynamically stable, which resulted in recrystallization during storage and poor dissolving capabilities (Yoshioka et al., Citation1994). These findings led us to develop a TQM formulation to ensure better dissolution and oral bioavailability.
The solubility of a poorly water-soluble drug can be enhanced by employing various formulation strategies such as a surfactant, pH modification, nano-suspension technology, hydrotrophy, solid dispersion, and salt formation. However, among these techniques, Solid dispersion (SD) technology is widely used to increase the water solubility, dissolution rate, and bioavailability of drugs with poor water solubility (Sareen et al., Citation2012). SD involves the molecular dispersion of one or more APIs in an inert hydrophilic carrier, which helps improve the drug’s solubility (Alam et al., Citation2012). Drugs in solid dispersions can either be crystalline or amorphous in solid form. When a drug is amorphous, it can be incorporated into a solid dispersion as particles or molecularly spread over the carrier (Rodriguez-Aller et al., Citation2015; Huang et al., Citation2020). However, when the drug is crystalline, it is incorporated as particles only where it can form mixed crystals with the carrier (Chavan et al., Citation2016).
Self-micellizing solid dispersion (SMSD), a recent promising formulation strategy has attracted considerable attention since it can increase the bioavailability of drugs while reducing the inconsistency of oral absorption under various pathophysiological situations (Onoue et al., Citation2014). By using an amphiphilic block copolymer, SMSD technology is a solid dispersion system that can achieve high dissolution characteristics of poorly water-soluble drugs (Onoue et al., Citation2014; Suzuki et al., Citation2016; Halder et al., Citation2019). In brief, SMSD’s usually consist of an amphiphilic carrier and the drug mixed in a suitable solvent. Then the solvent evaporation approach will remove the solvent from the mixture (Shi et al., Citation2017). Then the dried powder undergoes micellization when it comes in contact with the gastric fluid. An amphiphilic polymer consists of a hydrophobic unit and a hydrophilic unit; the self-micellization by the polymer occurs with the encapsulation of a lipophilic drug through hydrophobic interaction when introduced in dissolution media (Avsar et al., Citation2019). Therefore, SMSD system might be beneficial to improve the biopharmaceutical properties of TQM and enhance the nephroprotective effects even at a lower dose. However, little is known about the feasibility of SMSD system incorporating TQM in ameliorating the nephroprotective properties.
The present study aims to develop an SMSD of TQM (SMSD-TQM) employing an amphiphilic polymer to enhance biopharmaceutical and improve nephroprotective function. The developed formulations were examined for the physicochemical properties, particle size distribution, morphology, crystallinity, and dissolution behavior. The Pharmacokinetics of TQM was also evaluated in rats after oral administration of TQM and SMSD-TQM. Finally, the nephroprotective effects of TQM samples were investigated in cisplatin-induced acute kidney injury rat models.
2. Materials and methods
2.1. Materials
TQM (purity: 98.6%) was purchased from Sigma-Aldrich (USA). BASF, Dhaka, Bangladesh kindly donated Soluplus®, Kolliphor® P188, and Kolliphor® P407. All other chemicals and reagents were purchased commercially.
2.2. Standard curve preparation and TQM content analysis
By dissolving 10 mg of TQM with 10 mL methanol in a volumetric flask to achieve a final concentration of 1 mg/mL, a 10 mL stock solution of TQM was created. TQM follows the Beer-Lambert equation in the 8–30 µg/mL concentration range, and TQM provides a suitable absorbance value at 257 nm (Noor et al., Citation2021). Therefore, the stock solutions were diluted sequentially at various concentrations before use. The amount of TQM was determined using an ultraviolet (UV) spectrophotometric method by a UV-vis spectrophotometer (UV-1800, Shimadzu Corporation, Japan) at 257 nm. The TQM amount was determined using the equation derived from the standard curve. A validation study was conducted to determine the TQM concentration using the UV spectrophotometric method (Supplementary Table 1). TQM exhibited linearity within the concentration range of 5–30 μg/ml, as evidenced by a correlation coefficient value of 0.999. The accuracy of the method was assessed by performing recovery experiments at three distinct levels: 80, 100, and 120%. The percentage of the recovery as determined was within the range of 99.91–101.2%. The limits of detection and quantification were 3.2 and 9.8 µg/mL, respectively.
2.3. Phase solubility study
To select an appropriate carrier, the apparent solubility of TQM in polymer solutions was assessed in triplicate using a proven method established by Higuchi and Connors (Higuchi & Connors, Citation1965).
An excess of TQM (about 1 g) was added to the aqueous solutions of Soluplus®, Kolliphor® P188, and Kolliphor® P407 at a 5–25 mg/mL polymer concentration. The tubes were sealed and shaken for 48 hours at 75 rpm at 37 °C in a thermostatically controlled water bath (WBS-C1, Wincom, China). The resulting suspension was centrifuged at 10,000×g for 10 min after 48 hours, and the supernatant was filtered. The resultant supernatants were then filtered, and the approach stated in the preceding section was used to determine the TQM content.
The stability constant (Ks) and complexation efficiency (C.E.) were calculated using the equations below:
So is the equilibrium aqueous solubility of TQM, and the slope is attained by plotting TQM concentration versus different polymer concentrations.
2.4. Preparation of SMSD-TQM
The SMSD-TQM was prepared via a solvent evaporation process. In the selection step of the polymer ratio, crystalline TQM and a chosen polymer was dissolved in methanol based on their apparent solubility and complexation behavior. The solution was then dried using a rotary vacuum-dryer (RVD) (Heidolph Rota-Vap, Germany). The freeze-drying (FD) procedure was also used in preparing SMSD-TQM to compare the impact of drying on the physicochemical behavior of the approach. Accurately weighed crystalline TQM (10% w/w) and polymer were dissolved in 1, 4-dioxane and then frozen at −80 °C. The frozen samples were subsequently lyophilized using an Eyela FD-1000 freeze dryer for 24 h at a pressure of 15 Pa. (Tokyo Rikakikai, Tokyo, Japan).
2.5. Encapsulation efficiency (EE)
The EE (%) was calculated using a modified membrane filtration method with slight modifications (Bergonzi et al., Citation2020). Briefly, SMSD-TQM samples were filtered with a 0.22 µm filter membrane. The non-encapsulated TQM was kept on the membrane. The UV spectrophotometric approach discussed earlier measured the amount of TQM contained within polymeric micelles. The following formula was then used to determine the EE (%):
2.6. Dissolution study
To provide insight into the enhanced release of TQM over time, the in vitro dissolution test on TQM samples was carried out under the stirrer beaker method with a small volume to maintain semi-sink conditions. Due to the poor aqueous solubility of TQM, the dissolution study was performed in semi-sink condition rather than a sink condition. Dissolution studies conducted under semi-sink conditions can provide valuable insights into the dissolution behavior of poorly soluble drugs and help in the formulation development process, optimization of dissolution methods, and bioavailability assessment. Maintenance of semi-sink conditions is frequently required to evaluate the dissolution characteristics of drugs with low solubility effectively. This approach offers a more accurate depiction of in vivo applications whereby the drug is not fully absorbed. The methodology for attaining semi-sink conditions may differ based on the drug’s attributes and the dissolution investigation’s objectives. To achieve a semi-sink condition, it is necessary to maintain a drug concentration inside the release medium that is below the drug’s maximum solubility. This ensures that the drug does not undergo total dissolution throughout the dissolution test. To achieve this objective, a volume of 1 mL of release medium was periodically withdrawn at predefined time intervals, and the sampled dissolution media were not replaced. The dissolution investigation was conducted in 50 mL of distilled water at 37 ± 0.5 °C with continuous stirring of 50 rpm by a magnetic stirrer for 60 min. Each powder sample (ca. 250 mg of TQM) was weighed in 50 mL of distilled water, and the final concentration of TQM in the dissolution vessel was 2.5 mg/mL, corresponding to ca. 5-times higher concentration than the equilibrium solubility of TQM (500 µg/mL) in water (Bergonzi et al., Citation2020). At regular intervals, samples (1 mL) were withdrawn and centrifuged at 10,000×g for 5 min before being filtered through a 0.45 µm membrane filter and having the supernatant diluted with 50% methanol. The sampled dissolution medium was not replenished. At 257 nm, the amount of TQM in the medium was measured spectrophotometrically.
2.7. Surface morphology
The scanning electron microscopy (SEM) method was used to study the surface morphology of TQM samples (JEOL JSM-7600F, Tokyo, Japan) (Amidon et al., Citation2009). Double-sided carbon tape was used to secure the samples to an aluminum sample holder before a magnetron sputtering apparatus was used to cover the samples with platinum.
2.8. X-ray powder diffraction (XRPD)
Using a Mini Flex II (Rigaku, Tokyo, Japan), XRPD patterns of TQM samples were captured using Cu Kα radiation produced at 40 mA and 35 kV. Samples were scanned at a speed of 4°/min and a step size of 0.2° over a range of 2 angles from 10° to 35° (Vogt & Williams, Citation2011).
2.9. Differential scanning calorimetry (DSC)
A Simultaneous Thermal Analyzer (NETZSCH STA 449F5TA Instruments, USA) was used to measure the thermal behavior of TQM samples (Amarachi, Citation2020). The samples (3 mg) were heated at a rate of 5 °C/min while purging the sample with nitrogen gas (50 mL/min). Indium was the calibration standard (8–10 mg, 99.999% pure, onset at 156.6 °C).
2.10. Dynamic light scattering (DLS)
Using the DLS method, a Zetasizer was used to evaluate the average particle size and Zeta potential of SMSD-TQM samples suspended in water (MALVERN, Worcestershire, UK) (Bhattacharjee, Citation2016). All measurements were made at 25 °C, and a measurement angle of 90°, and the mean diameter was estimated using photon correlation from light scattering.
2.11. Transmission electron microscopy (TEM)
10 mg TQM equivalent SMSD-TQM was dissolved in 1 mL of distilled water for the TEM experiment, and an aliquot (5 µL) was spread out on a 200-mesh copper grid covered with carbon. The sample was left to stand for 60 seconds before any extra solution was blotted away. The samples were then visualized under a high-resolution transmission electron microscope (F200X Talos, Thermo Fisher, Waltham, MA, USA) operating at 200 kV (Malatesta, Citation2021).
2.12. Fourier transform infrared spectroscopy (FT-IR)
The compatibility and potential interactions between the SMSD-TQM components were evaluated using FT-IR analysis (Song et al., Citation2020). The samples were individually placed on the sample platform of the instrument (Shimadzu, IR Spirit, Japan), and IR spectra were acquired using LC Solution software in the wavenumber range of 4000–600 cm−1. For each sample, the baseline was normalized and corrected during the analysis.
2.13. Storage stability study
About 10 mg of each TQM sample was put into a 10 mL amber glass bottle for the storage stability study. The samples were kept in a stability chamber for four weeks at 40 °C or 40 °C/75 ± 0.5% relative humidity (RH) and two weeks at 60 °C (SRH–15VEVJ2, Nagano Science Co. Ltd., Osaka, Japan). The humidity was controlled by sealing the glass vials so they were only exposed to the outside world at accelerated temperatures (40 °C and 60 °C).
2.14. Animals
In vivo, animal models are crucial for assessing basic pharmacokinetic and pharmacodynamic parameters such as drug metabolism, efficacy, safety, and toxicological research before human trials. Choosing a suitable animal model can be challenging and often relies on assumptions and the practicality of the investigation (Singh & Seed, Citation2021). Among animals, rodents play a crucial role in biomedical research. Over 95% of animals utilized in biomedical research are mice and rats. Due to their near similarity to humans in physiology and genetic composition, they are a logical selection for biomedical study (Bryda, Citation2013). Despite some distinctions between humans and rats, the commonalities are more significant, making them a valuable and adaptable tool for studying human diseases. Thus, the rat model was chosen for investigating the nutraceutical impacts of SMSD-TQM in this investigation. Male Wister rats weighing 220 ± 24 g (8–9 weeks old) were selected in all animal experiments were obtained from the animal center of North South University (Dhaka, Bangladesh). The sample size was calculated using the power equation, keeping a 90% power with an E value between 10 and 20. Based on the power calculation, our study used 4 to 6 rats in each group to confine the analysis and reduce and refine the experimental animals according to ARRIVE guidelines. The rats were kept in a laboratory with free food and water access. The Animal Care and Ethical Committee of the Faculty of Biological Sciences at the University of Dhaka approved the study’s procedures (Ref. No. 97/Biol. Scs./23.08.2020). All animal experiments were carried out between 01 October 2020 and 30 June 2021.
2.15. Pharmacokinetic studies
2.15.1. Monitoring plasma TQM levels
Before administering TQM samples, experimental rats fasted for the previous night while still being given free access to water. According to some previous reports, TQM with a dose of 5 − 10 mg/kg exerts better clinical effects; therefore, we have selected this dose in this study (Hosseinzadeh et al., Citation2007; Ahmad et al., Citation2015). For the pharmacokinetic assessment after oral administration, rats were randomly assigned into four groups; each group consisted of six rats, as follows: group I: administered a single dose of crystalline TQM (10 mg/kg) dispersed in 0.25% suspension of carboxy methyl cellulose; group II: administered a single dose of SMSD-TQM/RVD (5 mg-TQM/kg) dispersed in distilled water; group III: administered a single dose of SMSD-TQM/FD (5 mg-TQM/kg) dispersed in distilled water; group IV: a single dose of crystalline TQM (1 mg-TQM/kg) was administered intravenously. The suspension/dispersion of TQM samples was then administered to the experimental rats through oral gavage. To calculate the oral BA of the TQM samples, TQM was dissolved in dimethyl sulfoxide (10 mg/mL), and a dose of 1 mg/kg was administered intravenously (iv) to rats to calculate absolute BA. Then, 300 µL of heparinized blood samples were collected from the unanesthetized tail veins of each rat at the specified time intervals of 0.25, 0.5, 1, 2, 4, and 6 h. The blood samples were then centrifuged at 10,000×g for 10 min, and 400 µL of acetonitrile and an internal standard (diclofenac at a fixed concentration of 10 µg/mL) were added. The mixture was then kept in an ice bath for one minute before being vortexed for one minute and kept in an ice bath for another time. The samples were then centrifuged for 5 minutes at 3,000× g.
2.15.2. Determination of TQM in plasma
The filtrate was then analyzed by an internal standard method using a Shimadzu HPLC system composed of a SCL-20Avp system controller, an LC-20AD vp solvent delivery pump, a DGU-14A degasser, a CTO-20A vp column oven, and an SPD-20A Prominence UV-vis detector. A binary gradient mobile phase made up of Milli-Q (A) and methanol (B) delivered at a flow rate of 1.0 mL/min was used in a Phenomenex, reversed-phase C18, 150 mm × 4.6 mm, 5 µm column maintained at 35 °C. The mobile phase’s gradient condition was as follows: 85% B for the first 20 minutes; 85–95% B for the next 5 minutes; 95–85% B for the next 5 minutes; and 85% B for the last 5 minutes. The pharmacokinetic parameters of each rat were then calculated employing non-compartmental analysis using PK solver (an add-on program in Microsoft Excel) (Zhang et al., Citation2010).
2.15.3. Validation of HPLC method
The HPLC method was validated in compliance with the ICH guideline for determining the plasma concentration of TQM. TQM samples were analyzed to evaluate the performance characteristics of the HPLC method. These characteristics include accuracy, limit of detection (LOD), limit of quantification (LOQ), linearity, and precision.
2.16. Nephroprotective effect of TQM samples
2.16.1. Rat model of nephropathy
The nephroprotective potential of TQM in rats was assessed using an animal model of nephropathy induced by cisplatin (Choie et al., Citation1981). Rats were randomly assigned into five groups; each group consisted of four rats, as follows: group I: control group (untreated rats); group II: vehicle group; group III: crystalline TQM treatment group; group IV: SMSD-TQM/RVD treatment group; and group V: SMSD-TQM/FD treatment group. Except for the rats in group 1, all rats were administered cisplatin (6 mg/kg) dissolved in saline intraperitoneally. TQM samples (10 mg/kg) were dissolved/dispersed in 1 mL of distilled water, mixed well, and administered orally to rats at 24 h before to 72 h after cisplatin treatment, repeating every 24 h. To measure the plasma biomarker levels of the kidney injury, approximately 300 µL of blood samples were collected from the tail vein of each rat at 76 h after the cisplatin treatment. The collected blood samples were centrifuged at 10,000× g for 10 min to obtain plasma samples stored at −80 °C until analysis. Rats exhibited progressive dehydration, weight loss, anemia, reduced activity, and gastrointestinal distress within 2 days of receiving cisplatin (6 mg/kg) (Perše & Večerić-Haler, Citation2018). Gastrointestinal malaise manifests as decreased food and drink consumption and disrupted stomach function, evidenced by significantly elevated gastric content. A humane endpoint was established just after sample collection to avoid causing pain or anguish to the rats, and rats were sacrificed (The Institutional Animal Care and Use Committee, Citation2019). All rats survived following the treatment of cisplatin for the entire duration of the study.
2.16.2. Nephrotoxic biomarkers
Utilizing commercial diagnostic kits (HUMAN GmbH, Germany) and an Erba Chem v3 semi-auto biochemistry analyzer, plasma samples for biochemical markers such as creatinine and Blood Urea Nitrogen (BUN) were investigated according to the manufacturer’s protocol.
2.16.2.1. BUN
Solution 1 containing 2 IU/mL of GLDH, 0.27 mg/mL NADPH • 4Na and 1.5 mg/mL α-KG (160 µL), and solution 2 containing 9 IU/mL urease and 1.5 mg/mL α-KG (40 µL) was added to the plasma sample (2.7 µL), followed by incubation in the 96-well microplate at room temperature for 10 min. After the incubation, the absorbance of the sample was measured at 340 nm with the blank solution as the control using a microplate reader and SAFIRE unit (TECAN, Männedorf, Switzerland).
2.16.2.2. Creatinine
The plasma sample (50 µL) was incubated with a deproteinizing solution comprising sodium tungstate and phosphoric acid (300 µL) for 10 minutes before being centrifuged at 2,500×g for 10 minutes. The supernatant (100 µL) was collected for mixing with 22 mmol/L picric acid (50 µL) and 0.75 mol/L sodium hydroxide solution (50 µL), followed by incubating in the 96-well microplate at 30 °C for 20 min. After finishing the reaction, measure the absorbance of the sample at 520 nm with the blank solution as the control using a microplate reader and SAFIRE unit (TECAN, Männedorf, Switzerland).
2.16.3. Preparation of tissue homogenates and evaluation of oxidative stress markers
Rats were euthanized with a single intraperitoneal dose of ketamine (300 mg/kg b.w.) after blood samples were obtained at the end of the experiment (Shill et al., Citation2021). Abdominal incisions were used for extracting the kidney. The rats’ kidneys were removed, cleaned in ice-cold saline, blotted using filter paper, and stored for future analysis. 1 g of kidney tissue was homogenized in 10 mL of phosphate buffer (pH 7.4), and the kidney samples were then centrifuged at 8000 rpm for 15 min at 4 °C. For pending analysis, the supernatant was kept in a freezer at −20 °C. Depending on the specific biomarker assay being used, assay-specific biomarker solutions were prepared in-house immediately before use as per the established method (Shill et al., Citation2021).
Nitric oxide (NO) levels and advanced oxidative protein products (AOPP) levels were identified as indicators of oxidative stress (Tracey et al., Citation1995; Witko-Sarsat et al., Citation1996). We evaluated NO (absorbance measured at 540 nm) by comparing NO to the corresponding blank solutions. The NO concentration was estimated from a standard curve as nmol/g of tissue. To calculate the amounts of AOPP, we used 5 µL of the sample, 95 µL of PBS, 50 µL of acetic acid, and 2 minutes of incubation. At 340 nm, the measurement was taken. The blank reading was measured using PBS (100 µL), 50 µL acetic acid, and potassium iodide. Finally, using the chloramine-T linear chart at 340 nm (with chloramine-T concentrations ranging from 0 to 100 nmol/mL), we computed the AOPP levels (Shill et al., Citation2021).
2.16.4. Study of antioxidant activities
Both reduced glutathione (GSH) and superoxide dismutase (SOD) are powerful antioxidant enzymes. We used proven techniques to determine the SOD activity in kidney tissue homogenates (Misra & Fridovich, Citation1972; Shill et al., Citation2021). After a short interval, we filled the 96-well plates with 90 µL PBS, 10 mL tissue supernatants, and 100 µL epinephrine. We measured optical density (OD) at 480 nm during various periods to calculate differences in a blank solution lacking the enzyme but including all other components. To determine the GSH levels, we mixed 10 µL of tissue homogenate with 90 µL of PBS and 100 µL of DTNB. We then measured the absorbance at 412 nm when a yellow color appeared (Jollow et al., Citation1974; Shill et al., Citation2021).
2.16.5. Histopathology procedure
The tissue blocks were dehydrated in ascending concentrations of ethyl alcohol after being fixed in 10% formalin overnight. Afterwards, tissues were given a xylene treatment, paraffin-embedded, and sectioned at a thickness of 5 µ. Sections on slides were deparaffinized with xylene before tissues were rehydrated in alcohol at varying concentrations, from high to low. Later, hematoxylin and Sirius Red were used to stain tissue sections. Finally, stained slides were washed in xylene, mounted, and viewed using an Olympus DP12 light microscope (Japan) at 20X magnification.
2.17. Data analysis
The mean and standard deviation (S.D.) or standard error (S. E.) represent all data. The graphs were created with Graphpad Prism 8.0 (GraphPad Software, LaJolla, CA). With pairwise comparisons utilizing Fisher’s least significant difference method, a one-way analysis of variance was employed for statistical comparisons. In each study, a p-value of 0.05 or less was considered significant.
3. Result and discussion
3.1. Selection of a suitable polymer for SMSD system
To choose appropriate polymers for the SMSD system for TQM, the apparent solubility of TQM in water was studied in numerous concentrations of pre-dissolved polymers, including Soluplus®, Kolliphor® P188, and Kolliphor® P407. Soluplus®, Kolliphor® P188, and Kolliphor® P407 are frequently used as pharmaceutical excipients with amphiphilic properties to improve the solubility of poorly water-soluble medications due to their commercial availability and biocompatibility (Vasconcelos et al., Citation2017; Gangarde et al., Citation2020; Ilie et al., Citation2021). Due to interactions between lipophilic units of amphiphilic polymers and weakly water-soluble medicines, poorly soluble pharmaceuticals can become more soluble through encapsulation. Through these interactions, polymeric micelles with a hydrophobic core and a hydrophilic shell may emerge (Onoue et al., Citation2013). As seen in , the polymer concentration significantly increased TQM’s aqueous solubility. The examined polymers showed a linear (AL-type) relationship between rising polymer concentration and TQM solubility. Soluplus® and Kolliphor® P407 exhibited statistically significant (p < 0.01) improvements in TQM solubility over Kolliphor® P188. The aqueous solubility of TQM was increased by 4.2 and 5.6 times, respectively, by Soluplus® and Kolliphor® P407 at a concentration of 25 mg/mL, compared to 2.8 times by Kolliphor® P188 at the same concentration. The enhanced apparent solubility of TQM with amphiphilic block copolymers was caused by the higher dispersibility and miscibility of TQM distributed in the polymers (Pereira et al., Citation2013; Ghezzi et al., Citation2021). Additionally, the resulting phase solubility diagram was subjected to linear regression analysis to establish the stability constants (Ks); the results are shown in .
Figure 1. Apparent solubility of TQM in the aqueous solution of soluplus®, kolliphor® P188 and, kolliphor® P407 at various concentrations (5–25 mg/mL). Data presented as mean ± S.D. (n=3).
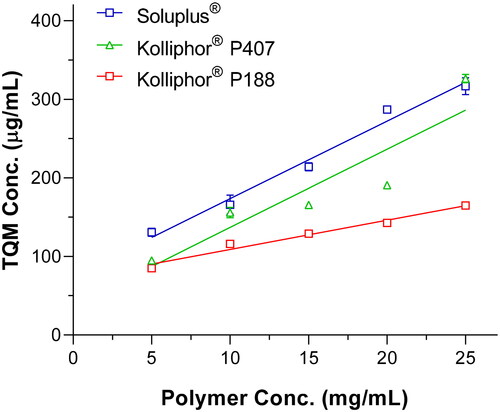
Table 1. Apparent solubility data of binary complexes of TQM with different polymers.
Soluplus® has a Ks much greater than Kolliphor® P407 and P188, which supports the excellent effect of TQM on improving solubility. These results suggested that TQM could improve the solubility by interacting more favorably with Soluplus® and being trapped in the hydrophobic core of the micelle. The nonionic polymer Soluplus® (polyvinyl caprolactam, polyvinyl acetate, and polyethylene glycol) has been extensively employed to develop solubilized formulations of drugs that are not readily soluble. Various studies on formulations based on Soluplus® were created using multiple pharmaceutical technologies, such as solid dispersion (Ha et al., Citation2014; Lee et al., Citation2015; Lin et al., Citation2015; Xia et al., Citation2016) and nanosuspensions (Zhang et al., Citation2013), and that enhanced drug solubility and oral bioavailability. To improve the physicochemical behavior of TQM, Soluplus® was chosen as the carrier for the development of SMSD-TQM based on the apparent solubility and kinetic data.
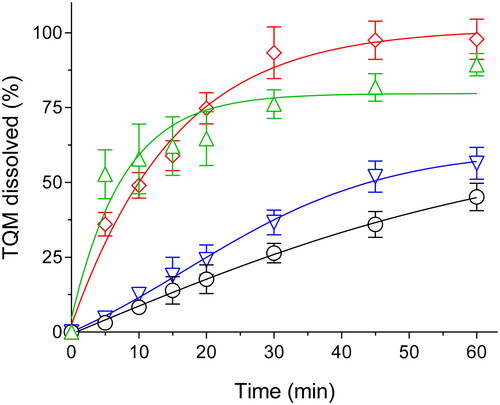
3.2. Optimization of TQM loading amounts through Dissolution studies
The solubilization efficiency of the target drug may be affected by the Drug loading of the SMSD formulation, perhaps because of the effectiveness of encapsulating the drug in micelle-like structures (Onoue et al., Citation2014). This research aimed to determine the optimal loading for SMSD-TQM. Therefore, several loadings (from 5 to 15%) were prepared using solvent evaporation by RVD and then carried through dissolution experiments in water for 60 minutes. According to the results of the dissolution tests, after 60 minutes of mixing, crystalline TQM showed only 45% drug dissolution (). Contrary, compared to crystalline TQM and other formulations with more significant loading amounts, SMSD-TQM with a drug loading of 10% (SMSD-TQM/10) showed a significant improvement in the dissolution behavior of TQM. The SMSD-TQM/10 formulation had the highest amount of TQM dissolved in the dissolution medium, followed by the SMSD-TQM/5 formulation, and finally, the SMSD-TQM/15 formulation. Also, the initial dissolution rates in SMSD-TQM/5, SMSD-TQM/10, and SMSD-TQM/15 were determined to be 1.12, 1.06, and 0.77 h − 1. TQM’s (high) affinity for the hydrophobic moiety of Soluplus®, as well as the effect of polymer concentrations, are considered significant contributors to the projected dissolution behavior difference (Batrakova & Kabanov, Citation2008). A larger Soluplus® to TQM ratio may also improve TQM encapsulation inside the micelles, leading to enhanced dispersibility in water and subsequent acceleration of TQM solubilization. As an outcome of these findings, a 10% drug loading was selected as the preliminary step for the SMSD-TQM formulation, and its physicochemical and pharmacokinetic properties were investigated.
Table 2. Dissolution properties of TQM samples.
3.3. Physicochemical characterizations
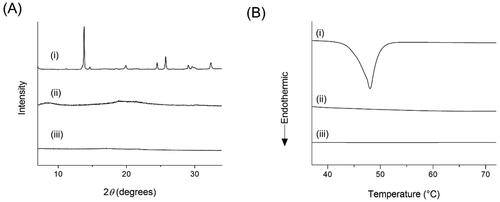
Amorphous forms can have higher solubility and dissolution rates than crystalline states due to the higher energy state. Because of this, figuring out crystallinity is essential for determining product quality. The crystalline condition of SMSD-TQM was evaluated using DSC and XRPD investigations (). Indicating the crystalline structure of TQM, and the XRPD pattern of crystalline TQM showed multiple sharp peaks (). In contrast, the diffractograms for SMSD-TQM/RVD and SMSD-TQM/FD showed that the peaks identified as being in crystalline TQM were minor, indicating that TQM was in an amorphous condition. Although crystalline TQM had an endothermic peak in the SMSD-TQM/RVD and SMSD-TQM/FD at the melting point of crystalline TQM, this endothermic peak was eliminated in the DSC analysis, even though it corresponded to the melting point of TQM at roughly 47 °C ().
Figure 2. Crystallinity assessment of TQM samples using (A) XRPD and (B) DSC. (I) Crystalline TQM, (II) SMSD-TQM/RVD, and (III) SMSD-TQM/FD.
PLM images show that crystalline TQM has a rough block-like structure (), SMSD-TQM/RVD has little birefringence (-II), and SMSD-TQM/FD loses polarization, which may be a sign of inner TQM that is in an amorphous state as shown by negligible birefringence (-III). The absence of polarization in SMSD-TQM may imply an amorphous form of TQM in SMSD, while polarization in PLM measurements can indicate a crystalline material (Li & Zhu, Citation2015). The high free energy in the amorphous state may trap the drug molecule in SMSD and prevent precipitation or recrystallization of the drug in the supersaturated form, which would help to enhance the lipophilic drug’s ability to dissolve (Onoue et al., Citation2014). The amorphization of DMP during the preparation technique improved dissolving behavior, according to PLM, XRPD, and DSC tests.
Figure 3. Microscopic images observed by polarized light microscope (A) and scanning electron microscope (B). (I) Crystalline TQM, (II) SMSD-TQM/RVD, and (III) SMSD-TQM/FD. Each black and white bar represents 100 μm and 50 μm, respectively.
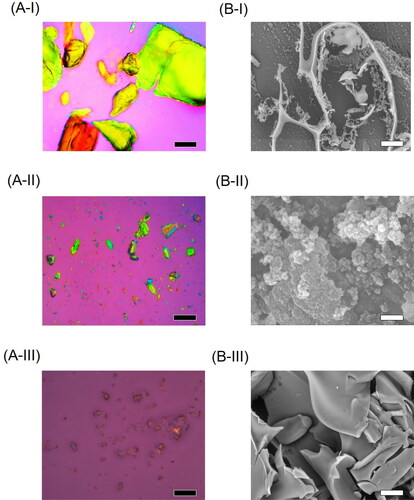
SEM measurements were used to evaluate the surface morphology of the TQM samples (). The typical plate-shaped particles and predominately scattered morphology of crystalline TQM are shown in . However, in irregular particles, SMSD-TQM/RVD and SMSD-TQM/FD were observed (-II and B-III). TQM was well-integrated into the polymer in SMSD-TQM compared to crystalline TQM, indicating that it was effectively absorbed. SEM micrographs demonstrate that after the freeze-drying process, the surface area of pharmacological components rose dramatically compared to crystalline TQM (-III). According to the Noyes-Whitney equation, micronizing particles increase their surface area, significantly boosting the dissolving rate.
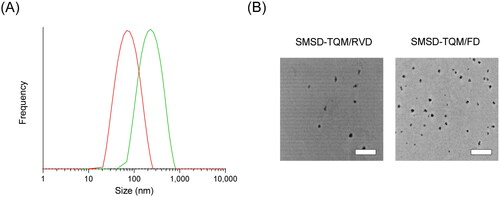
On the other hand, it is believed that one of the most critical factors in enhancing a drug’s biopharmaceutical properties is the size distribution of polymeric micelles (Ghezzi et al., Citation2021). The ability of SMSD-TQM to micellize was examined in this work using DLS analysis. DLS analysis of water-dispersed SMSD-TQM samples () showed the production of uniformly nano-sized particles with mean particle sizes of 68 nm for SMSD-TQM/FD and 145 nm for SMSD-TQM/RVD and a PDI of 0.125 and 0.392, respectively. Additionally, polymeric micelles’ size of 150 nm would facilitate quick medication absorption after oral administration due to their high drug solubility and improved dispersibility and diffusivity in the mucus layer due to the hydrophilic chain on the surface of polymeric micelles (Kang et al., Citation2004).
Figure 4. Micelle forming potency of TQM samples dispersed in water. (A) Micelle size distribution of SMSD-TQM spread in distilled water as determined by DLS analysis: the red line represents the particle size distribution of SMSD-TQM/FD; and the green line represents the particle size distribution of SMSD-TQM/RVD. (B) TEM image of SMSD-TQM dispersed in distilled water. Bar represents 500 nm.
SEM images and DLS data thus confirmed the absence of crystalline TQM throughout the SMSD-TQM preparation procedure. These advantages might help explain TQM’s better dissolution behavior.
Even though amorphization can potentially improve the way a drug dissolves, the main concern is that amorphous formulations have stability issues, limiting their use in commercial formulations. In a solid dispersion formulation, an amorphous drug showed a higher tendency to degrade than it did in a crystalline condition, according to research from our group (Onoue et al., Citation2013, Citation2014). Under accelerated conditions, storage stability was carried out at 40 °C or 40 °C/75% RH for 4 weeks and at 60 °C for 2 weeks to test the physicochemical strength of SMSD-TQM and investigate the possibility of changes in physicochemical parameters. According to HPLC analysis, the drug contents changed negligibly after storage under all conditions, and no samples showed any significant peaks caused by TQM’s degradants (data not shown). Even after being stored at 40 °C for 4 weeks and 60 °C for 2 weeks, the surface color and shape of SMSD-TQM won’t affect significantly. In contrast, the appearance of SMSD-TQM drastically changed after 4 weeks of storage at 40 °C/75% RH, probably due to the hygroscopic nature of Soluplus® (data not shown), highlighting the requirement for moisture protection during storage. These results suggest that SMSD prepared with Soluplus® would bring better amorphization by preventing or delaying crystal formation (Serajuddln, Citation1999), leading to better dissolution and oral absorption.
3.4. Dissolution behavior of the optimized formulation in comparing the effect of drying in the preparation of SMSD-TQM
In vitro dissolution tests were conducted to ascertain whether the rate and total amount of drug release from various formulations improved and to predict the drug release profile inside the physiological environment (Bai et al., Citation2011). This was done because solubility is a crucial issue with crystalline TQM in therapeutic applications. As shown in , dissolution tests on TQM samples were carried out in the water to determine if various drying techniques enhanced the dissolution behavior of SMSD-TQM. A control experiment discovered that the physical mixture of TQM and Soluplus® dissolved poorly in water, with 56.4% of the TQM present after 60 minutes and a dissolving rate constant of 0.9, showing that crystalline TQM had a restricted dissolution characteristic. With a dissolution rate regular of 1.06 and 1.46, respectively, the total dissolution of TQM was seen within 60 min in SMSD-TQM/RVD and SMSD-TQM/FD, indicating a considerable improvement in the dissolving behaviors of TQM. There were no signs of precipitation or aggregation of dissolved materials. The results agreed with earlier research, which showed that pulverization could increase the dissolving rate correspondingly by increasing the surface area of the particles and decreasing the thickness of the diffusion layer (Dokoumetzidis & Macheras, Citation2006). In addition, the SMSD-TQM/RVD and SMSD-TQM/FD exhibited an EE (%) of 91.87 ± 3.92% and 93.30 ± 4.43%, respectively. The SMSD approach can improve the wettability and dispersibility of weakly water-soluble medications because the active ingredients are distributed uniformly across an amphiphilic carrier (Sareen et al., Citation2012). TQM and the carrier polymers were utterly dissolved in the organic solvent during the production process, which may have caused TQM to spread out at the molecular level inside the SMSD system and cause it to dissolve and disperse quickly in the dissolution media. Based on these results, it can be inferred that SMSD-TQM’s dissolving rate and quantity were better than those of crystalline TQM, which may have contributed to a higher TQM oral absorption.
Figure 5. Dissolution tests of TQM samples in water. ○, crystalline TQM; △, SMSD-TQM/RVD; ▽, PM of TQM and soluplus®, and ◇, SMSD-TQM/FD. Data represent the mean ± S.D. of 3 experiments.
3.5. Drug polymer interactions
The interaction between the amorphous molecules theoretically molecularly dispersed in the matrix carrier in an SD formulation can enhance therapeutic amorphization (Onoue et al., Citation2012). FT-IR analysis was used to determine the molecular state of crystalline TQM. It processed SMSD-TQM (). The distinctive strong stretching band of the carbonyl group was observed at wavenumber 1,652.38 cm−1 while at 2,967.13 cm−1 C-H stretching of the aliphatic groups is represented by a strong band. The stretching in the vinylic C-H in the C=C-H groups was attributed to the weaker band seen at a higher wavenumber (3,254.68 cm−1). At 1,612.32 cm−1, the C=C stretching produced a unique, moderately strong band. The strong carboxylic stretching band in TQM in this frequency range depicts the C=C stretching. Furthermore, the C=C stretching, which lacks methyl and isopropyl substituents, is predicted to have a lower intensity than the carboxylic band. In contrast, Soluplus® showed peaks at 3,458.9 cm−1 (O–H stretching), 2,924.21 cm−1 (aromatic C–H stretching), 1,732.49 cm−1, 1,632.35 cm−1 (C=O stretching), and 1,440.64 cm−1 (C–O–C stretching) (–III).
Figure 6. Drug-polymer interaction studies of TQM samples using FT-IR. Baseline-corrected and normalized IR data of TQM samples in the spectral wavenumber region from (A) 4,000–600 cm−1 and (B) 1,800–1,300 cm−1. (I) SMSD-TQM/FD, (II) SMSD-TQM/RVD (III) Soluplus®, and (IV) crystalline TQM.
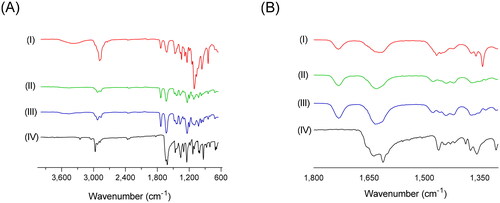
The observed spectral features are indicative of symmetric and asymmetric stretching vibrations of the C-O-C bond in alkyl-substituted ethers, methylene bending vibrations, typical stretching of the carbonyl C=O bonds as well as asymmetric and symmetric stretching vibrations of the methylene C-H bonds along with stretching vibrations of the OH group. In SMSD-TQM, slight transitions of the bands at ‘1,350–1,800’ cm−1 and ‘2,900–2,950’ cm−1 () resembling C=O stretching bands and aromatic C–H stretching bands respectively were detected. Different molecular environments, particularly those surrounding the carboxylate moiety of TQM, are thought to be reflected in the changes in the IR spectral patterns of TQM samples. In case of SMSD-TQM, it was observed that the carbonyl peak shifted to a higher wave number of 1,732.49 cm−1 for both FD and RVD. This shift can be due to the stretching of the C=O bond when it forms hydrogen bonds with Soluplus®, indicating the formation of amorphous TQM during preparation. Furthermore, the presence of carbonyl groups both in the polymer and the drug may potentially hinder the detection of any changes in the stretching frequency of the TQM carbonyl groups. The lack of observable stretching signals suggests the absence of hydrogen bonding between the carbonyl group and the polymer. In addition, no significant changes were observed in the infrared spectra between the SMSD-TQM/RVD and SMSD-TQM/FD. The absence of discernible distinctions suggests that the techniques employed in the formation of solid dispersions have comparable efficiency.
Hence, it is a clear indication that the maximum amount of TQM was encapsulated in the core of SMSD-TQM although a little amount of TQM may be present on the surface of the nanoparticles. TQM-amount was insignificant in the comparison of SMSD-TQM, which supports the absence of any significant chemical interactions between TQM and Soluplus® during the preparation. Theoretically, interactions between lipophilic drugs and carriers in solid dispersions promote dissolution by preventing precipitation or recrystallization (Onoue et al., Citation2012; Pandey et al., Citation2016).
3.6. Pharmacokinetic assessment
3.6.1. Validation of bioanalytical method for the determination of plasma TQM
The chromatographic conditions were optimized and confirmed to calculate plasma TQM (Supplementary Table 2). Samples were measured at six concentration levels of 10 to 300 ng/mL to generate a calibration curve. A correlation coefficient value of 0.999 indicated the high level of linearity of the calibration curve. To examine the intra-day repeatability, the relative standard deviation (RSD) also known as precision of the method was determined. The RSD was found to be 6.05% in the TQM-spiked plasma sample at a concentration of 10 ng/mL. Moreover, the method’s intermediate precision was evaluated after determining various analysts on three separate days. It was found that, in the TQM-spiked plasma sample at 10 ng/mL, the computed RSD was 7.28%. Finally, the accuracy of the method was shown to be over 96.2% in all analysts, suggesting the measured concentration of an analyst may match its true concentration. The findings of this validation study suggest that the HPLC based bioanalytical method may have resulted in reliable and consistent assessment of TQM plasma levels.
3.6.2. Pharmacokinetic assessment
The potential improvement in absorption of TQM through SMSD formulation strategy was demonstrated by pharmacokinetic studies carried out in rats after oral administration of crystalline TQM (10 mg/kg, suspended in 0.25% CMC suspension) and SMSD-TQM (5 mg-TQM/kg, dispersed in water) (). Values of the relevant pharmacokinetic parameters including Cmax, Tmax, t1/2, AUC0-∞, and oral BA are listed in . Oral administration of crystalline TQM exhibited poor systemic absorption with a Cmax value of 165.5 ± 23.3 ng/mL, and AUC0-6 488.1 ± 89.7 ng*h/mL. In contrast, the pharmacokinetic behavior of SMSD-TQM/RVD and SMSD-TQM/FD was better than that of crystalline TQM, as shown by a rapid elevation of Cmax value of 298.2 ± 32.6 and 425.1 ± 11.2 ng/mL respectively with AUC0-6 of 1,002.5 ± 122.3 and 1,049.3 ± 44.44 ng*h/mL, respectively.
Figure 7. Plasma concentration-time profile of TQM after oral administration of TQM samples in rats. ○, crystalline TQM (10 mg/kg, p.o.), □, SMSD-TQM/RVD (5 mg-TQM/kg, p.o.), and △, SMSD-TQM/FD (5 mg-TQM/kg, p.o.). data represent mean ± S.E. of 6 experiments.
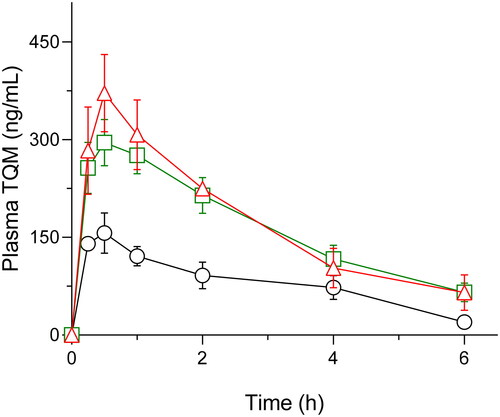
Table 3. Pharmacokinetic parameters of TQM samples following oral administration to rats.
Based on the AUC0-∞ a value of intravenously administered TQM (1 mg/kg), absolute bioavailabilities of crystalline TQM, SMSD-TQM/RVD, and SMSD-TQM/FD were calculated to be 2.8, 12.5, and 13.7%, respectively. Thus, compared to crystalline TQM, approximately 4.5 and 4.9-fold enhancement in systemic exposure were achieved with SMSD-TQM/RVD, and SMSD-TQM/FD, respectively, which could agree with dissolution characteristics. It was hypothesized that the apparent absorption rate of TQM in the orally-dosed SMSD-TQM group was faster with a shorter Tmax, possibly due to the rapid dissolution of TQM via the SMSD approach. Since TQM has high membrane permeability (Shariare et al., Citation2022), the improved dissolution and sufficiently high supersaturation of TQM could contribute to the quick absorption that can prevent the precipitation or degradation of TQM in the GI tract. However, further investigation into the absorption mechanism of micellar TQM is required before a plausible hypothesis can be proposed (Morgen et al., Citation2012).
TQM is categorized and identified as exhibiting poor aqueous solubility. This compound’s dissolution rate limits absorption and a slight increase in dissolution rate may lead to a marked improvement in absorption characteristics (Kohli et al., Citation2010). The dissolution behavior and biopharmaceutical characteristics of poorly water-soluble compounds may be improved by exploiting the micellizing property of amphiphilic polymers in SMSD formulation (Kawabata et al., Citation2011; Onoue et al., Citation2014). A higher ratio of soluplus® may help to stabilize TQM under gastrointestinal circumstances by encapsulating it within the micelles of soluplus®, which may have contributed to the enhanced oral absorption of TQM in the current study (Kojo et al., Citation2017; Shi et al., Citation2017). Soluplus®, as seen in the dissolution tests, demonstrated better solubilization capacity to accomplish quick dissolution and maintain supersaturation that can inhibit recrystallization, potentially leading to a significant enhancement of oral bioavailability by the spring and parachute effect (Halder et al., Citation2019; Banik et al., Citation2022).
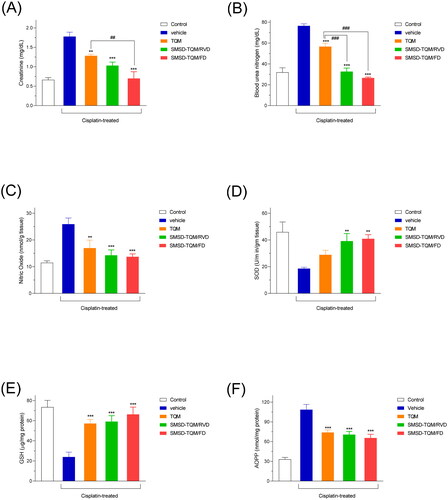
3.7. Nephroprotective effect of TQM samples in cisplatin-treated rats
The increased oral absorption in SMSD-TQM prompted our evaluation of TQM’s nephroprotective effect. In a rat model of nephropathy induced by cisplatin, the nephroprotective impact of TQM samples was assessed using BUN and creatinine levels as disease biomarkers. The BUN and creatinine levels of the vehicle group increased significantly by cisplatin treatment, which resulted in nephropathy (). Oral doses of SMSD-TQM significantly reduced the elevated levels of BUN and creatinine values when compared to that of the vehicle group. The suppression rates of these elevations were estimated to be approximately 42 and 56% for creatinine and 57.3 and 63.2% for BUN for SMSD-TQM/RVD and SMSD-TQM/FD, respectively (). While crystalline TQM likewise prevented an increase in BUN and creatinine levels by around 26 and 28%, respectively, SMSD-TQM tended to do so more so than crystalline TQM (). In addition, the oxidative stress was also measured by determining the NO and AOPP levels in the kidney homogenates. This study demonstrated that intraperitoneal administration of cisplatin significantly increased NO and AOPP levels in the experimental rats, which were discernibly lowered by the oral gavage of the drugs (TQM and SMSD-TQM) (). Since GSH and SOD are the natural cellular antioxidants, we wanted to measure the levels of GSH and SOD to determine the capacity of the drugs to improve kidney impairment in rat models. After cisplatin administration, the levels of both GSH and SOD were profoundly decreased in the rats () and significantly improved by the oral gavage of TQM and SMSD-TQM in the disease model rats. Our study found better effects of SMSD-TQM/FD for improving antioxidant enzymes in the experimental animals ().
Figure 8. Nephrotoxic potential in a rat nephropathy model induced by cisplatin (6 mg/kg, ip). (A) plasma creatinine, (B) BUN, (C) NO, (D) SOD, (E) GSH, and (F) AOPP levels in rats with orally dosed crystalline TQM and SMSD-TQM (10 mg/kg, 4 days). **, P < 0.01; ***, P < 0.001 with respect to cisplatin-treated rats; ##, P < 0.01; ###, P < 0.001, TQM vs. SMSD-TQM. Data represent mean ± S.E. of 4 experiments.
To develop a rat model of nephropathy, the anticancer medication cisplatin is usually used as an inducer (Choie et al., Citation1981). By several methods, cisplatin exposure causes fast and severe renal damage. Cisplatin preferentially enters the proximal tubule of the kidney due to the organic cation transporter, triggers apoptosis through the generation of ROS, and induces inflammation, calcium overload, and phospholipase activation, which results in mitochondrial dysfunction and DNA damage (Marullo et al., Citation2013; Soni et al., Citation2018). TQM can operate against nephropathy, has positive antioxidant and anti-apoptotic properties, and is expected to have a nephroprotective effect (Farooqui et al., Citation2017; Dera et al., Citation2020; Faisal Lutfi et al., Citation2021).
3.8. Histopathological assessment
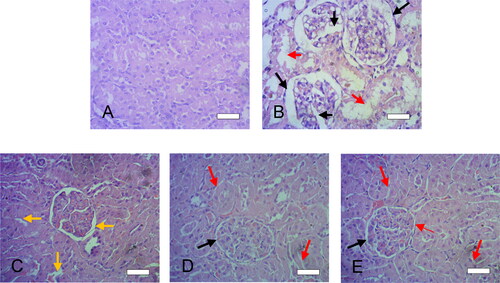
To further confirm the improved nephroprotective effects of SMSD-TQM, histological examination of the kidneys exposed to cisplatin cause profound lesion of the kidney Bowman’s capsules and tubules in the diseased rats (black and red arrows) and changes in the normal kidney structure () while compare to the control rats (). Cisplatin induction also causes swelling of Bowman’s capsule with glomerulus capillaries and renal tubules (marked by large black and red arrows in ). After the treatment with TQM, lesion in the Bowman’s capsule and renal tubules improved intensely (yellow arrows in the ). Further, oral administration of TQM formulations (SMSD-TQM/RVD, and SMSD-TQM/FD) even showed better improvement in the capsular and tubular lesion and kidney morphology improved significantly (, respectively) compared to the diseased rats (). SMSD-TQM decreased capsular and tubular lesion more intensely (black and red arrows in , respectively) while compared to TQM itself (yellow arrow in ). Our histological data provided better therapeutic efficacy of SMSD-based TQM formulations (SMSD-TQM/RVD, and SMSD-TQM/FD) when compared to TQM only.
Figure 9. Histological features of liver sections after cisplatin challenge with or without oral administration of crystalline TQM (10 mg/kg, p.o.) or SMSD-TQM (10 mg-TQM/kg, p.o.). (A) Rats treated with saline, (B) cisplatin-treated rats, (C) cisplatin-treated rats with crystalline TQM, (D) cisplatin-treated rats with SMSD-TQM/RVD and (E) cisplatin-treated rats with SMSD-TQM/FD. Each bar represents 50 µm.
4. Conclusion
To improve the physicochemical and biopharmaceutical properties, a TQM-loaded SMSD formulation was developed. The optimized SMSD-TQM formulation significantly accelerated dissolution behavior through micellization. The pharmacokinetic result reveals that TQM is well absorbed orally. Because of its ability to reduce oxidative stress, SMSD-TQM has been shown in this study to have more antifibrotic effects than crystalline TQM. These results suggest that Soluplus® might be a convenient biomaterial to be used in the SMSD system incorporating TQM for enhanced oral bioavailability and nutraceutical properties; however, further clinical studies might be necessary to include this system in clinical use.
Author’s contributions
Shimul Halder: Conceptualization, Methodology, in vivo experiments, Validation, Formal analysis, Writing - Original Draft, Review & Editing, Visualization; Sanjida Afrose: Methodology, Investigation, in vivo experiments; Manik Chandra Shill:Validation, Investigation, in vivo experiments; Nahid Sharmin: Conceptualization, Project administration; Patricia Prova Mollick: Methodology, Investigation, in vivo experiments; Madhabi Lata Shuma: Methodology, Formal analysis, Data Curation, Writing - Review & Editing; Md. Abdul Muhit: Methodology, Data Curation, Writing - Review & Editing; S. M. Abdur Rahman: resources, Project administration, Writing - Review & Editing. Manik Chandra Shill and Patricia Prova Mollick did euthanasia on the rats.
Ethical approval statement
Rats were chosen as an animal models to investigate the pharmacokinetics of TQM samples following oral administration and the potential for improved nephroprotective behavior. Male Wister rats weighing 220 ± 24 g (8–9 weeks old) were chosen in all animal experiments, were housed in three per cage in the laboratory with free access to food and water, and maintained on a 12 h dark/light cycle in a room with controlled temperature (24 ± 1 °C) and humidity (55 ± 5% RH). They were kept in a laboratory with free food and water access. The Institutional Animal Care and Ethical Committee of the University of Dhaka’s Faculty of Biological Sciences sanctioned the protocol number ‘Ref. No. 97/Biol. Scs./23.08.2020’ for carrying out animal experiments. The ARRIVE criteria were followed in all animal experiments.
| Abbreviations | ||
| AOPP | = | advanced oxidative protein products |
| ASD | = | amorphous solid dispersions |
| AUC | = | area under the plasma concentration curve vs. time |
| BA | = | bioavailability |
| BCS | = | biopharmaceutics classification system |
| BUN | = | blood urea nitrogen |
| CKD | = | chronic kidney disease |
| CKD | = | chronic kidney disease |
| Cmax | = | maximum plasma concentration |
| DLS | = | dynamic Light Scattering |
| DSC | = | differential Scanning Calorimetry |
| EE | = | encapsulation efficiency |
| FD | = | freeze drying |
| FT-IR | = | fourier transform infrared spectroscopy |
| GSH | = | glutathione |
| H&E | = | hematolysin and eosin |
| NO | = | nitric oxide |
| OD | = | optical density |
| ROS | = | reactive oxygen species |
| RVD | = | rotary vacuum drying |
| SD | = | solid dispersion |
| SEM | = | scanning electron microscopy |
| SMSD | = | self-micellizing solid dispersion |
| SOD | = | superoxide dismutase |
| TEM | = | transmission electron microscopy |
| Tmax | = | time to reach maximum concentration |
| TPGS | = | tocopheryl polyethylene glycol succinate |
| TQM | = | thymoquinone |
| UV | = | ultraviolet |
| XRPD | = | X-ray powder diffraction |
Supplemental Material
Download MS Word (17.5 KB)Acknowledgements
The authors wish to thank the authority of the Semiconductor Research Center, the University of Dhaka, for their kindness in permitting the particle size analysis of the samples. The authors would also like to thank the University of Dhaka for supporting the Open Access Publication fees.
Disclosure statement
No potential conflict of interest was reported by the author(s).
Data availability statement
Upon a reasonable request, the corresponding author will provide access to the data supporting this study.
Additional information
Funding
References
- Ahmad A, Khan RMA, Alkharfy KM, et al. (2015). Effects of thymoquinone on the pharmacokinetics and pharmacodynamics of glibenclamide in a rat model. Nat Prod Commun 10:1. doi: 10.1177/1934578X1501000821.
- Al-Ali A, Alkhawajah AA, Randhawa MA, Shaikh NA. (2008). Oral and intraperitoneal LD50 of thymoquinone, an active principle of Nigella sativa, in mice and rats. J Ayub Med Coll Abbottabad 20:25–16.
- Alam MA, Ali R, Al-Jenoobi FI, Al-Mohizea AM. (2012). Solid dispersions: a strategy for poorly aqueous soluble drugs and technology updates. Expert Opin Drug Deliv 9:1419–40. doi: 10.1517/17425247.2012.732064.
- Amarachi A. (2020). Differential scanning calorimetry: a review. Int J Appl Biol Pharm Technol 1:1–7.
- Amidon GE, Secreast PJ, Mudie D, et al. (2009). Chapter 8 - Particle, powder, and compact characterization. In: Developing solid oral dosage forms, 163–86. Academic Press, doi: 10.1016/B978-0-444-53242-8.00008-4.
- Avsar SY, et al. (2019). Biomolecules turn self-assembling amphiphilic block co-polymer platforms into biomimetic interfaces. Front Chem 7:1–29.
- Bai G, Wang Y, Armenante PM. (2011). Velocity profiles and shear strain rate variability in the USP dissolution testing apparatus 2 at different impeller agitation speeds. Int J Pharm 403:1–14. doi: 10.1016/j.ijpharm.2010.09.022.
- Banik S, Ghosh A. (2021). Prevalence of chronic kidney disease in Bangladesh: a systematic review and meta-analysis. Int Urol Nephrol 53:713–8. doi: 10.1007/s11255-020-02597-6.
- Banik S, Sato H, Onoue S. (2022). Self-micellizing solid dispersion of atorvastatin with improved physicochemical stability and oral absorption. J Drug Deliv Sci Technol 68:103065. doi: 10.1016/j.jddst.2021.103065.
- Batrakova EV, Kabanov AV. (2008). Pluronic block copolymers: evolution of drug delivery concept from inert nanocarriers to biological response modifiers. J Control Release 130:98–106. doi: 10.1016/j.jconrel.2008.04.013.
- Bergonzi MC, Vasarri M, Marroncini G, et al. (2020). Thymoquinone-loaded soluplus®-solutol® HS15 mixed micelles: preparation, in vitro characterization, and effect on the SH-SY5Y cell migration. Molecules 25:4707. doi: 10.3390/molecules25204707.
- Bhattacharjee S. (2016). DLS and zeta potential – what they are and what they are not ? J Control Release 235:337–51. doi: 10.1016/j.jconrel.2016.06.017.
- Bryda EC. (2013). The Mighty Mouse: the impact of rodents on advances in biomedical research. Mo Med 110:207–11.
- Chavan RB, Thipparaboina R, Kumar D, Shastri NR. (2016). Co amorphous systems: a product development perspective. Int J Pharm 515:403–15. doi: 10.1016/j.ijpharm.2016.10.043.
- Choie DD, Longnecker DS, del Campo AA. (1981). Acute and chronic cisplatin nephropathy in rats. Lab Invest 44:397–402.
- Dera AA, Rajagopalan P, Alfhili MA, et al. (2020). Thymoquinone attenuates oxidative stress of kidney mitochondria and exerts nephroprotective effects in oxonic acid-induced hyperuricemia rats. Biofactors 46:292–300. doi: 10.1002/biof.1590.
- Dokoumetzidis A, Macheras P. (2006). A century of dissolution research: from Noyes and Whitney to the biopharmaceutics classification system. Int J Pharm 321:1–11. doi: 10.1016/j.ijpharm.2006.07.011.
- Elmowafy M, Samy A, Raslan MA, et al. (2016). Enhancement of Bioavailability and Pharmacodynamic Effects of Thymoquinone Via Nanostructured Lipid Carrier (NLC) Formulation. AAPS PharmSciTech 17:663–72. doi: 10.1208/s12249-015-0391-0.
- Fahmy HM, Khadrawy YA, Abd-El Daim TM, et al. (2020). Thymoquinone-encapsulated chitosan nanoparticles coated with polysorbate 80 as a novel treatment agent in a reserpine-induced depression animal model. Physiol Behav 222:112934. doi: 10.1016/j.physbeh.2020.112934.
- Faisal Lutfi MF, Abdel-Moneim AMH, Alsharidah AS, et al. (2021). Thymoquinone lowers blood glucose and reduces oxidative stress in a rat model of diabetes. Molecules 26:1–13.
- Farooqui Z, Shahid F, Khan AA, Khan F. (2017). Oral administration of Nigella sativa oil and thymoquinone attenuates long term cisplatin treatment induced toxicity and oxidative damage in rat kidney. Biomed Pharmacother 96:912–23. doi: 10.1016/j.biopha.2017.12.007.
- Gangarde YM, T K S, Panigrahi NR, et al. (2020). Amphiphilic small-molecule assemblies to enhance the solubility and stability of hydrophobic drugs. ACS Omega 5:28375–81. doi: 10.1021/acsomega.0c04395.
- Ghezzi M, Pescina S, Padula C, et al. (2021). Polymeric micelles in drug delivery: an insight of the techniques for their characterization and assessment in biorelevant conditions. J Control Release 332:312–36. doi: 10.1016/j.jconrel.2021.02.031.
- Goyal SN, Prajapati CP, Gore PR, et al. (2017). Therapeutic potential and pharmaceutical development of thymoquinone: a multitargeted molecule of natural origin. Front Pharmacol 8:656. doi: 10.3389/fphar.2017.00656.
- Ha E, Baek I, Cho W, et al. (2014). Preparation and evaluation of solid dispersion of atorvastatin calcium with Soluplus® by spray drying technique. Chem Pharm Bull (Tokyo) 62:545–51. doi: 10.1248/cpb.c14-00030.
- Halder S, Suzuki H, Seto Y, et al. (2019). Megestrol acetate-loaded self-micellizing solid dispersion system for improved oral absorption and reduced food effect. J Drug Deliv Sci Technol 49:586–93. doi: 10.1016/j.jddst.2018.12.033.
- Higuchi T, Connors KA. (1965). Phase solubility studies. Adv Anal Chem Instrum 4:117–212.
- Hosseinzadeh H, Parvardeh S, Asl MN, et al. (2007). Effect of thymoquinone and Nigella sativa seeds oil on lipid peroxidation level during global cerebral ischemia-reperfusion injury in rat hippocampus. Phytomedicine 14:621–7. doi: 10.1016/j.phymed.2006.12.005.
- Huang BB, Liu DX, Liu DK, et al. (2020). Application of solid dispersion technique to improve solubility and sustain release of emamectin benzoate. Molecules 24:4315.
- Ilie A-R, Griffin BT, Vertzoni M, et al. (2021). Exploring precipitation inhibitors to improve in vivo absorption of cinnarizine from supersaturated lipid-based drug delivery systems. Eur J Pharm Sci 159:105691. doi: 10.1016/j.ejps.2020.105691.
- Jollow DJ, Mitchell JR, Zampaglione N, Gillette JR. (1974). Bromobenzene-induced liver necrosis. Protective role of glutathione and evidence for 3,4-bromobenzene oxide as the hepatotoxic metabolite. Pharmacology 11:151–69. doi: 10.1159/000136485.
- Kang BK, Lee JS, Chon SK, et al. (2004). Development of self-microemulsifying drug delivery systems (SMEDDS) for oral bioavailability enhancement of simvastatin in beagle dogs. Int J Pharm 274:65–73. doi: 10.1016/j.ijpharm.2003.12.028.
- Kawabata Y, Wada K, Nakatani M, et al. (2011). Formulation design for poorly water-soluble drugs based on biopharmaceutics classification system: basic approaches and practical applications. Int J Pharm 420:1–10. doi: 10.1016/j.ijpharm.2011.08.032.
- Kohli K, Chopra S, Dhar D, et al. (2010). Self-emulsifying drug delivery systems: an approach to enhance oral bioavailability. Drug Discov Today 15:958–65. doi: 10.1016/j.drudis.2010.08.007.
- Kojo Y, Matsunaga S, Suzuki H, et al. (2017). Improved oral absorption profile of itraconazole in hypochlorhydria by self-micellizing solid dispersion approach. Eur J Pharm Sci 97:55–61. doi: 10.1016/j.ejps.2016.10.032.
- Lee J-Y, Kang W-S, Piao J, et al. (2015). Soluplus®/TPGSGS-based solid dispersions prepared by hot-melt extrusion equipped with twin-screw systems for enhancing oral bioavailability of valsartan. Drug Des Devel Ther 9:2745–56. doi: 10.2147/DDDT.S84070.
- Li C, Zhu Y. (2015). Quantitative polarized light microscopy using spectral multiplexing interferometry. Opt Lett 40:2622–5. doi: 10.1364/OL.40.002622.
- Lin Q, Fu Y, Li J, et al. (2015). A (polyvinyl caprolactam-polyvinyl acetate-polyethylene glycol graft copolymer)-dispersed sustained-release tablet for imperialine to simultaneously prolong the drug release and improve the oral bioavailability. Eur J Pharm Sci 79:44–52. doi: 10.1016/j.ejps.2015.08.018.
- Malatesta M. (2021). Transmission electron microscopy as a powerful tool to investigate the interaction of nanoparticles with subcellular structures. Int J Mol Sci 22:12789. doi: 10.3390/ijms222312789.
- Marullo R, Werner E, Degtyareva N, et al. (2013). Cisplatin induces a mitochondrial-ROS response that contributes to cytotoxicity depending on mitochondrial redox status and bioenergetic functions. PLoS One 8:e81162. doi: 10.1371/journal.pone.0081162.
- Misra HP, Fridovich I. (1972). The role of superoxide anion in the autoxidation of epinephrine and a simple assay for superoxide dismutase. J Biol Chem 247:3170–5. doi: 10.1016/S0021-9258(19)45228-9.
- Morgen M, Bloom C, Beyerinck R, et al. (2012). Polymeric nanoparticles for increased oral bioavailability and rapid absorption using celecoxib as a model of a low-solubility, high-permeability drug. Pharm Res 29:427–40. doi: 10.1007/s11095-011-0558-7.
- Noor NS, Kaus NHM, Szewczuk MR, Hamid SBS. (2021). Formulation, characterization and cytotoxicity effects of novel thymoquinone-plga-pf68 nanoparticles. Int J Mol Sci 22:9420. doi: 10.3390/ijms22179420.
- Onoue S, Kojo Y, Aoki Y, et al. (2012). Physicochemical and pharmacokinetic characterization of amorphous solid dispersion of tranilast with enhanced solubility in gastric fluid and improved oral bioavailability. Drug Metab Pharmacokinet 27:379–87. doi: 10.2133/dmpk.dmpk-11-rg-101.
- Onoue S, Kojo Y, Suzuki H, et al. (2013). Development of novel solid dispersion of tranilast using amphiphilic block copolymer for improved oral bioavailability. Int J Pharm 452:220–6. doi: 10.1016/j.ijpharm.2013.05.022.
- Onoue S, Nakamura T, Uchida A, et al. (2013). Physicochemical and biopharmaceutical characterization of amorphous solid dispersion of nobiletin, a citrus polymethoxylated flavone, with improved hepatoprotective effects. Eur J Pharm Sci 49:453–60. doi: 10.1016/j.ejps.2013.05.014.
- Onoue S, Suzuki H, Kojo Y, et al. (2014). Self-micellizing solid dispersion of cyclosporine A with improved dissolution and oral bioavailability. Eur J Pharm Sci 62:16–22. doi: 10.1016/j.ejps.2014.05.006.
- Onoue S, Yamada S, Chan HK. (2014). Nanodrugs: pharmacokinetics and safety. Int J Nanomedicine 9:1025–37. at doi: 10.2147/IJN.S38378.
- Pandey MM, Jaipal A, Charde SY, et al. (2016). Dissolution enhancement of felodipine by amorphous nanodispersions using an amphiphilic polymer: insight into the role of drug–polymer interactions on drug dissolution. Pharm Dev Technol 21:463–74. doi: 10.3109/10837450.2015.1022785.
- Pereira JM, Mejia-Ariza R, Ilevbare GA, et al. (2013). Interplay of degradation, dissolution and stabilization of clarithromycin and its amorphous solid dispersions. Mol Pharm 10:4640–53. doi: 10.1021/mp400441d.
- Perše M, Večerić-Haler Ž. (2018). Cisplatin-induced rodent model of kidney injury . Biomed Res Int 2018:1–29. doi: 10.1155/2018/1462802.
- Rodriguez-Aller M, Guillarme D, Veuthey JL, Gurny R. (2015). Strategies for formulating and delivering poorly water-soluble drugs. J Drug Deliv Sci Technol 30:342–51. doi: 10.1016/j.jddst.2015.05.009.
- Sareen S, Joseph L, Mathew G. (2012). Improvement in solubility of poor water-soluble drugs by solid dispersion. Int J Pharm Investig 2:12–7. doi: 10.4103/2230-973X.96921.
- Serajuddln ATM. (1999). Solid dispersion of poorly water-soluble drugs: early promises, subsequent problems, and recent breakthroughs. J Pharm Sci 88:1058–66.
- Shariare MH, Khan MA, Al-Masum A, et al. (2022). Development of stable liposomal drug delivery system of thymoquinone and its in vitro anticancer studies using breast cancer and cervical cancer cell lines. Molecules 27:6744. doi: 10.3390/molecules27196744.
- Shaterzadeh-Yazdi H, Noorbakhsh M-F, Samarghandian S, Farkhondeh T. (2018). An overview on renoprotective effects of thymoquinone. Kidney Dis (Basel) 4:74–82. doi: 10.1159/000486829.
- Shi N-Q, Zhang Y, Li Y, et al. (2017). Self-micellizing solid dispersions enhance the properties and therapeutic potential of fenofibrate: advantages, profiles and mechanisms. Int J Pharm 528:563–77. doi: 10.1016/j.ijpharm.2017.06.017.
- Shill MC, Bepari AK, Khan M, et al. (2021). Therapeutic potentials of colocasia affinis leaf extract for the alleviation of streptozotocin-induced diabetes and diabetic complications: in vivo and in silico-based studies. J Inflamm Res 14:443–59. doi: 10.2147/JIR.S297348.
- Shire SJ. (2015). Formulation of proteins and monoclonal antibodies (mAbs). In: Monoclonal antibodies. Woodhead Publishing. 93–120. doi: 10.1016/b978-0-08-100296-4.00004-x.
- Singh VK, Seed TM. (2021). How necessary are animal models for modern drug discovery? Expert Opin Drug Discov 16:1391–7. doi: 10.1080/17460441.2021.1972255.
- Song Y, Cong Y, Wang B, Zhang N. (2020). Applications of Fourier transform infrared spectroscopy to pharmaceutical preparations. Expert Opin Drug Deliv 17:551–71. doi: 10.1080/17425247.2020.1737671.
- Soni H, Kaminski D, Gangaraju R, Adebiyi A. (2018). Cisplatin-induced oxidative stress stimulates renal Fas ligand shedding. Ren Fail 40:314–22. doi: 10.1080/0886022X.2018.1456938.
- Suzuki H, Kojo Y, Yakushiji K, et al. (2016). Strategic application of self-micellizing solid dispersion technology to respirable powder formulation of tranilast for improved therapeutic potential. Int J Pharm 499:255–62. doi: 10.1016/j.ijpharm.2015.12.065.
- The Institutional Animal Care and Use Committee. (2019). Guidelines for establishing humane endpoints in animal study proposals, 1–4.
- Tracey WR, Tse J, Carter G. (1995). Lipopolysaccharide-induced changes in plasma nitrite and nitrate concentrations in rats and mice: pharmacological evaluation of nitric oxide synthase inhibitors. J Pharmacol Exp Ther 272:1011–5.
- Vasconcelos T, Marques S, Sarmento B. (2017). The biopharmaceutical classification system of excipients. Ther Deliv 8:65–78. doi: 10.4155/tde-2016-0067.
- Vogt FG, Williams GR. (2011). Advanced approaches to effective solid-state analysis: X-ray diffraction, vibrational spectroscopy and solid-state NMR. Am Pharm Rev, 13:58–65. doi: 10.1002/chin.201118276.
- Witko-Sarsat V, Friedlander M, Capeillère-Blandin C, et al. (1996). Advanced oxidation protein products as a novel marker of oxidative stress in uremia. Kidney Int 49:1304–13. doi: 10.1038/ki.1996.186.
- Xia D, Yu H, Tao J, et al. (2016). Supersaturated polymeric micelles for oral cyclosporine A delivery: the role of Soluplus-sodium dodecyl sulfate complex. Colloids Surf B Biointerfaces 141:301–10. doi: 10.1016/j.colsurfb.2016.01.047.
- Yoshioka M, Hancock BC, Zografi G. (1994). Crystallization of indomethacin from the amorphous state below and above its glass transition temperature. J Pharm Sci 83:1700–5. doi: 10.1002/jps.2600831211.
- Zhang K, Yu H, Luo Q, et al. (2013). Increased dissolution and oral absorption of itraconazole/Soluplus extrudate compared with itraconazole nanosuspension. Eur J Pharm Biopharm 85:1285–92. doi: 10.1016/j.ejpb.2013.03.002.
- Zhang Y, Huo M, Zhou J, Xie S. (2010). PKSolver: an add-in program for pharmacokinetic and pharmacodynamic data analysis in Microsoft Excel. Comput Methods Programs Biomed 99:306–14. doi: 10.1016/j.cmpb.2010.01.007.