
 ?Mathematical formulae have been encoded as MathML and are displayed in this HTML version using MathJax in order to improve their display. Uncheck the box to turn MathJax off. This feature requires Javascript. Click on a formula to zoom.
ABSTRACT
Body height and body mass index (BMI) are associated with later life outcomes in present and historical populations. We examine the case study of the Swiss Alpine canton of Glarus, which was highly industrialised at the beginning of the 20th century. Our study links conscription registers to genealogical registers at the individual level in Switzerland for the first time. We analyse whether body height, BMI, socioeconomic position (HISCLASS), region of residence, fitness to serve (as a proxy for health status in a military context), and goitre status (as a proxy for iodine deficiency) in young adulthood are associated with lifespan. We transcribed conscription records of 1073 men born between 1905 and 1907 and recruited between 1925 and 1927 (coverage birth cohorts 96%). Of the 827 young men residing within the canton, we were able to identify 635 (76.8%) in the cantonal genealogical register. Using body height, chest circumference, and upper arm circumference, we estimated BMI. We find socioeconomic differences for height and estimated BMI at conscription age. Young men with a recorded goitre were taller. We also present a positive association between body height and lifespan, with small men being particularly disadvantaged. In a small subsample of two municipalities, we estimated the heritability of height to be 65%.
1. Introduction
Adult height is the result of a dynamic and complex additive growth process (Tanner, Citation1990; Wells, Citation2017; Wells & Stock, Citation2011). A good childhood environment is beneficial to growth. Changes in the size, shape, and capability of the human body are used to measure developments of the standard of living (Floud et al., Citation2011) and, in particular, variation in average height over time and between subpopulations is attributed to differences in living conditions (Cole, Citation2003; Deaton, Citation2007; Gausman et al., Citation2018; Harris, Citation2003; Komlos, Citation2009; McEvoy & Visscher, Citation2009; Steckel, Citation2009). Adult height is also positively correlated with better lives and later life outcomes (socioeconomic status, education, income, well-being, and offspring health; Perkins et al., Citation2016). The findings on the association between adult height and adult mortality, however, are mixed (Perkins et al., Citation2016).
The most notable change in average height over time and between subpopulation is the steady increase in height in the Western world since the 19th century (NCD Risc Factor Collaboration (NCD-RisC), Citation2016; Baten & Blum, Citation2014; Hatton & Bray, Citation2010; van Zanden et al., Citation2014). A complex set of environmental improvements in living conditions, nutrition, hygiene, disease environment, greater health/socioeconomic equality, and reduced physical workload are listed among the influencing factors (Bogin, Citation1999; McEvoy & Visscher, Citation2009; Stulp & Barrett, Citation2016). Another strand of the height literature shows that taller men evaluate their live more favourably (Deaton & Arora, Citation2009), that taller men have better education outcomes (Magnusson et al., Citation2006), and that shorter men are less likely to be married (Herpin, Citation2005). There is a known positive correlation between height and income, but the relationship is non-linear (Hübler, Citation2016). Determinants of height include both genetic and environmental factors. Moreover, there is a moderately positive assortative mating for height (Stulp & Barrett, Citation2016) and the relationship between male height and reproductive success is curvilinear or positive (Stulp et al., Citation2015, Citation2012). Although genetic factors are responsible for 80 to 90% of the difference in height between individuals in affluent populations (Visscher et al., Citation2010), historical evidence for the heritability of height is sparse and it is unclear whether the heritability of height in families has increased in the course of rising living standards over the last 150 years because the influence of the environment has decreased. In addition, the link between height of parents and height of their offspring is not necessarily only caused by genetics: People inherit many non-biological traits from their parents, such as religion, wealth, social status, occupation, housing environment, and lifestyles, which have an influence on growth patterns and adult height. In economic history, the attention on intergenerational transmission has been laid on social mobility (Clark, Citation2014; Favre, Citation2019; Favre et al., Citation2018), poverty (Horrell et al., Citation2001), health (Andreella et al., Citation2016), and inequality (Hällsten & Kolk, Citation2020).
The association between adult height and mortality is neither unambiguously positive nor negative. As with the wage height premium and reproductive success, the relationship is non-linear (Waaler, Citation1984). Total mortality decreases with increasing height in men, while the relation between body mass index (BMI) and mortality is J- or U-shaped (Engeland et al., Citation2003). Taller people, on average, are less likely to die from cardiovascular diseases (CVD) but are, in contrast, more likely to die from certain cancers (The Emerging Risk Factors Collaboration, Citation2012). In addition, the socioeconomic gradient in height does not necessarily correspond to the socioeconomic gradient in mortality (Öberg, Citation2014). While socioeconomic differences in average height can be observed everywhere and at all times (even if they have become smaller in the 20th century; Komlos, Citation2009; Panczak et al., Citation2017), there is an ongoing debate about whether socioeconomic-related mortality differences diverge, converge or remain constant over time (Bengtsson & van Poppel, Citation2011). In Sweden, socioeconomic mortality differences seem to appear late (only after 1950; Bengtsson & Dribe, Citation2011), while in Geneva there seems to be a systematic and constant below-average mortality among elites, despite generally decreasing differences between classes (Schumacher & Oris, Citation2011).
For Switzerland, the present-day association between height and mortality was examined using four health surveys conducted between 1977 and 1993 which were linked to the Swiss National Cohort (Rohrmann et al., Citation2017): In men, mortality risk generally decreased with increasing height. But in contrast to the aforementioned literature on causes of deaths, there was no association with dying more frequently from cancer for taller men, and shorter height was not associated with cardiovascular mortality. The anthropometric history of Switzerland over the last 200 years has been extensively reviewed (Trüb et al., Citation2020; Staub et al., Citation2016, Citation2014; Schoch, Staub, and Pfister Citation2012). The results are in line with the general anthropometric literature: increasing average height since the end of the 19th century and clearly visible but decreasing social gradient in height, while at the same time life expectancy at birth, GDP per capita, and real wages increased. Due to the lack of longitudinal data, however, no study has yet explored the historical association between adult height and adult mortality in Switzerland, as it has been done for other historical populations (Marco-Gracia & Puche, Citation2021; Tassenaar & Karel, Citation2016; Thompson et al., Citation2020).
We explore the relationship between adult height, BMI, iodine deficiency, and life expectancy in the Swiss alpine canton of Glarus. Firstly, Glarus is interesting because, despite being a small and remote canton as well as in contrast to many other more agricultural-alpine regions, it was highly industrialised and relatively prosperous in terms of GDP per capita at the beginning of the 20th century (Stohr, Citation2018). In particular, Glarus benefited from its proximity to the large and economically strong canton of Zurich. Secondly, the canton of Glarus as the object of study represents a member state with far-reaching autonomy and its own constitution within a country. It sets our research apart from other studies of individual towns or several villages in a region. Third, iodine deficiency was endemic in Glarus at the beginning of the 20th century. Due to iodine deficiency, very short stature was widespread in Alpine regions, and associated with hypothyroidism and mental retardation (Arcaleni Citation2006; Papageorgopoulou et al., Citation2012). The most common iodine deficiency disorders include goitre at all ages, as well as delayed physical development in growing children (Papageorgopoulou et al., Citation2012). Widespread surveys among Swiss conscripts showed that in some alpine districts, the prevalence of palpable goitre was as high as 82% (Bürgi et al., Citation1990; Papageorgopoulou et al., Citation2012; Stiner, Citation1924). Ecological studies have shown that at the beginning of the 20th century, the average body height of conscripts was shorter in Swiss districts in which the occurrence of goitres was high (Bürgi et al., Citation1990; Staub & Rühli, Citation2013). But iodine-deficient thyroid tissue releases growth factors (e.g., IGF), so that early and mild forms of iodine deficiency (as defined among others by diffusely enlarged thyroid glands) can lead to increased body growth (Wan Naraimoon et al., Citation1996). In the case of Switzerland, the question of the association between goitre as a proxy for iodine deficiency and adult height among conscripts has not yet been answered based on individual data. Understanding these relationships better is relevant especially for alpine countries, where iodine deficiency is an important aspect of health history (Staub & Rühli, Citation2013). Fourth and finally, the availability of data in the Glarus archives is unique for Switzerland: they include not only the conscription registers with different body measurements (as in other cantons), but also one of the most complete genealogical registers in Switzerland (Kubly-Müller Citation1912). We use a sample of young men born between 1905 and 1907 and conscripted between 1925 and 1927 to analyse the relationship between height and BMI at conscription and adult mortality. The study aims to see if a difference in stature at conscription translates into a difference in longevity.
2. Material and methods
2.1. The Swiss canton of glarus
The Alpine canton of Glarus comprises essentially the drainage basin of the Linth river. Towards the north the canton expands to the Linth plain. In the south Glarus is connected to its neighbouring cantons by Alpine passes. The canton is divided into four valleys (from North to South): Lower Main Valley, Upper Main Valley, Linthal Valley, and Sernftal Valley (). In 1920, there were 29 municipalities, evenly distributed among the four valleys. The number of inhabitants varied between 219 and 5027 people (with a total population of 33,834). The most populous municipality, the main town of Glarus, is located in the Upper Main Valley (). The settlements in the two main regions are located at an average altitude of 439.1 metres above sea level (masl) (Lower Main Valley) and 525.0 masl (Upper Main Valley). The average altitude of the villages in the two mountain valleys Linthal (661.4 masl) and Sernftal (755.6 masl) is higher.
Figure 1. A) Topographical map of the Canton of Glarus(source: www.geo.gl.ch). B) Municipalities, regions, and share of industrial workers in 1920. The polygons represent the 29 municipalities coloured in grey scales according to the four main regions (Lower Main Valley, Upper Main Valley, Linthal valley, and Sernftal valley). The circles represent the main places of the municipalities, and their size is proportional to the population size in the 1920 census (min = 219, max = 5027). The colours of the circles indicate the share of industrial workers (in tertiles) in 1920.
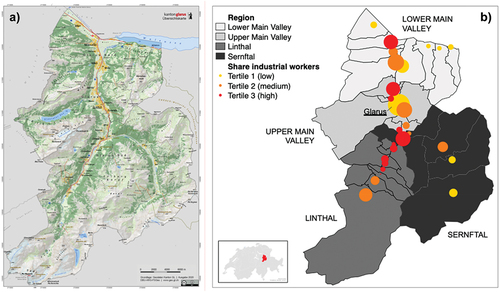
The Linth was initially central to the economic development of the canton as a waterway. The location in the Linth plain was important, as the canton thus borders on the trade route from Zurich to Chur, which was one of the European north-south connections. The Linth also enables energy production and is thus closely linked to the history of industrialisation in the area. The textile industry has shaped the region since the 18th century, but the region was already trade-oriented before industrialisation (livestock export, mercenary trade, textile cottage industry; Rohr, Citation2005; Siegenthaler, Citation1985). The economic development of the canton and the sectoral change from 1820 to 1950 can be characterized on the basis of employment figures as follows: Between 1820 and 1840, the factory production of cotton fabrics became established and included all stages of production; between 1840 and the 1860s the factory system replaced cottage industry; between 1870 and 1900 textile printing lost its economic importance, but spinning and weaving, the non-textile industries and the tertiary sector partially compensated for the losses of the main industrial sector; Around 1900, the canton had about the same number of employees as in 1870; After 1900, employment increased again, due to a renewed stabilisation of spinning/weaving and the strengthening of industries outside the textile sector (Siegenthaler, Citation1985). Between 1920 and 1940, employment in all stages of production in the textile industry continued to decline, while industrial production in the metal, construction and machinery industries grew in importance (Rohr, Citation2005).
In 1920, 65.1% of the workers were employed in the secondary or manufacturing sector, 15.3% in the primary sector, and 19.6% in the tertiary sector of the economy (Eidgenössisches Statistisches Bureau, ed, Citation1923). and Appendix Table S1 show the distribution of the sectoral workforce in the four valleys. While workers in the industrial sector represent the majority of workers in all valleys, this is particularly pronounced in the Linthal valley with 71.4% industrial workers and in the Upper Main Valley with 69.6%. The Sernftal and Lower Main Valley, on the other hand, also have a significant proportion of workers employed in agriculture (27.8% and 26.0%, respectively). The per capita GDP of the canton of Glarus was CHF 2747 in 1920, ranking it fifth among the 25 Swiss cantons (Stohr, Citation2018). The GDP figure emphasises the importance of the industrial production.
Industrialisation, not surprisingly, did not simply mean prosperity. The distribution of wealth was uneven across the population, especially in the 19th century. Sectoral change, population pressure, and poverty led to strong waves of emigration in the 19th century. The federal statistics on net migration include external migration as well as intercantonal internal migration without differentiation. The loss of emigration decreased significantly after the turn of the century: between 1900 and 1910, the annual average migration loss was 90 persons (2.8 per 1000 inhabitants); between 1910 and 1920, the loss was 55 persons (1.7 per 1000 inhabitants); between 1920 and 1930, net migration was slightly positive (Eidg. Statistisches Bureau, ed, Citation1934). Around 1900 Swiss internal migration became more important than emigration. The canton of Glarus increasingly came under the influence of the large economic area of Zurich and accordingly the main stream of internal migration led to Zurich (Rey, Citation2003). In 1900, 82% of the resident population were born in a municipality in Glarus; in 1930 the figure was 71%. In 1900 14% of the resident population were born in a Swiss canton (1930: 21%) and 4% (1930: 8%) were born outside of Switzerland. In particular, Swiss citizens from the cantons of Zurich, Schwyz, and St. Gallen lived in the canton of Glarus (Eidg. Statistisches Bureau, ed, Citation1934).
The anthropometric data in Glarus point to two phenomena, firstly with regard to industrialisation and secondly with regard to the development of the standard of living. The positive secular height trend began in Glarus in the 1870s (birth years, Appendix Figure S1). In order to trace the secular trend in the height of young men in the canton of Glarus, it is possible to refer to mean values and frequency tables published sporadically by the authorities since 1876 (Appendix Figure S1). Young men in Glarus were markedly shorter than the Swiss average at the end of the 19th century, but caught up during the first half of the 20th century. Young men being shorter than the Swiss average might be explained by the early industrialisation process in the region. Anthropometric studies predominantly conclude that health and nutritional status deteriorated during industrialisation (Blum & Eoin, Citation2019). The secular trend and young men catching up point to the improvement of the standard of living at the end of the 19th century and the turn of the 20th century. At the demographic level the improvement of the standard of living is visible in the decreasing infant mortality rate between 1870 and 1914 (1871/1875: 207.1, 1911/1914: 88.3; Historische Statistik der Schweiz (HSSO)., Citation2012). But at the same time at the anthropometric level, the decline in infant mortality may have led to a weakening of the selection effect on average height (Bozzoli et al., Citation2009).
The rising standard of living between 1870 and 1920 is visible in all cantons of Switzerland. But the alpine cantons, which include the canton of Glarus, fall behind in comparison to the urban and non-high-mountain cantons: the Alpine regions experienced increasing economic marginalisation and slower modernisation of the public health system (Lorenzetti & Meffre, Citation2005). For instance, around 1900, the density of midwives in Glarus, Uri and Graubünden was associated with a lower infant mortality rate than in other cantons; In 1920, however, infant mortality in the three cantons was above the national average, although the midwife/inhabitant ratio remained more favourable (Lorenzetti & Meffre, Citation2005).
2.2. Data sources
For the first time for Switzerland, we link conscription data and genealogical records at the individual level (for a graphical representation of the study, see Appendix Figure S2).
2.2.1. Conscription records
Since 1875, every 19-year-old male Swiss citizen has been drafted into military service (Kurz, Citation1985). The anthropometric data were recorded during the medical examination for military fitness, regardless of whether the person was fit for military service or not (Trüb et al., Citation2020; Schoch, Staub, and Pfister Citation2012). The decision on fitness for military service (fit for service, deferred or exempted) is a context-specific health indicator as to whether a conscript can perform a longer period of military service without serious health problems. The decision was based on physical and medical examinations and formal requirements, such as a minimum height. Those whose physical condition was considered insufficient, but with the potential to improve, were declared subject to re-examination and their conscription deferred to a subsequent draft. The medical examination at recruitment was prescribed in detail in military instruction manuals (Armee, Citation1875). The standardised procedure did not change over time (Trüb et al., Citation2020): it started with the measurement of height, followed by chest circumference, and mid-upper arm circumference. Weight was only measured from 1875 to 1879 and then again after 1932. Height was recorded with a portable device. Participants stood flat on their bare feet with the heels together and heels and the back of head touching the measuring rod. For chest circumference, the measuring tape was set around the naked chest in a horizontal line just below the nipples. The measurement was taken after exhalation and before inhalation. Mid-upper arm circumference was measured in the middle of the extended right upper arm. The registers, which were compiled with great attention to detail and careful handwriting during recruitment, also contain information on the young men’s date of birth, first and last names (including the father’s name), occupation, place of citizenship, place of residence, and information on goitre status (goitre vs. no goitre, as assessed by the military doctors). This latter examination for goitres was also carried out in a highly standardised manner throughout Switzerland according to a precisely formulated protocol, which comprised three pages. It described step by step and in detail how the examining doctor and conscript had to position themselves exactly, what and how the doctor had to palpate the thyroid gland in different positions, as well as a clear definition of the different types of goitre (diffuse vs. nodule), including threshold values in the case of differences, etc (Armee, Citation1875). Our earlier work has shown that these recruitment sources in the late 19th and early 20th centuries are almost a complete coverage of the birth cohorts (Schoch, Staub, and Pfister Citation2012). A socio-economic or similar selection bias is therefore very unlikely.
The conscription registers have been archived in the Glarus State Archives for the recruitment years between 1876 and 1932. However, at this stage it remains unclear how completely the recruitment registers have been preserved in the archives or are accessible at all. Therefore, for reasons of feasibility, three consecutive recruitment years from the 1920s were chosen, which were accessible. The complete data of 1073 conscripts who were recruited for the first time from 1925 to 1927 were transcribed from the military control books. Permission to access the data was granted by the Glarus State Archives and data protection contracts were signed.Footnote1
We used the occupation of the conscript as an indicator of socioeconomic status. We coded the occupations of the conscripts according to the Historical International Standard Classification of Occupations (HISCO) code (van Leeuwen et al., Citation2002). We then used the Historical International Social Class (HISCLASS) scheme to assign the HISCO code to twelve social classes. We finally collapsed the twelve social classes to five classes: Unskilled workers (HISCLASS codes 10, 11, 12, and 13), Skilled workers (7 and 9), Farmers (8), Lower middle class (3,4,5 and 6), and Elite (1 and 2).
Weight was not measured at conscription between 1880 and 1932. We used the measurements of height, chest circumference, and upper arm circumference (all measurements in cm) of the conscripts to estimate their BMI. We used an estimation method that we developed, tested, and validated on a dataset of Zurich conscripts from the 1930s (Trüb et al., Citation2020). The multiple regression equation with all variables (BMICAH formula: BMI = 8.04 + 0.17*chest + 0.61*arm + −0.10*height), provides an accurate estimation of mean BMI and the best performance of individual estimations in a 10% range around the true value (94.8% of values within the range). The method also allows an accurate estimation of the lower and upper ends of the BMI distribution.
2.2.2. Genealogical register
The canton of Glarus has one of the most complete genealogical registers in Switzerland. It is the uniquely detailed and extensive genealogical dataset that Johann Jakob Kubly-Müller created from 1896 to 1923 (Kubly-Müller Citation1912). The register was updated until 2006 and contains a complete coverage of the Swiss canton of Glarus dating back to the 16th century (Evans et al., Citation2018). The register (32 books, ca. 14,000 pages) contains data for all the citizens of the canton, date/place of birth, date of marriage(s) and death, as well as names of partner(s), parents and children. Links between parents and children are established in the register. Great care was taken to include unmarried people, children who died at early age, and illegitimate offspring. The books are accessible as photographs, but only a small part of the data has so far been transcribed. As part of a larger research project at the Universities of Zurich and Exeter, all relevant information from this register (including kinships) for the last 300 years was digitised for two Glarus municipalities, Linthal and Elm. We transcribed the date of death of all men recruited from 1925 to 1927. For the two municipalities of Linthal and Elm, the already digitised kinship (brothers) information was incorporated into the dataset via an already existing dataset (Evans et al., Citation2018).
2.2.3. Record linkage
Individual tracing of the young conscripts in the genealogical register was done using the variables of place of citizenship, first name and surname (also of the father), and date of birth (if available). The genealogical register accessible in digital copies is arranged according to civic places and surnames. Individuals were searched and matched by hand using the variable order mentioned above. Individuals were matched only if the identification was unique. Overall, 635 conscripts with citizenship within the canton (out of 827) could be linked to the genealogical register (matching success 76.8%).
2.3. Statistical analysis
First, we computed multi-variable linear ordinary least squares regressions to examine the associations between each of the two dependent variables, body height and estimated BMI, and independent variables. Multicollinearity was tested using variance inflation factor. All variance inflation factors were smaller than 1.2 and thereby considered non-collinear. The regression results are presented as coefficient plots and in the tables in the appendix.
Second, univariable and multivariable Cox proportional hazards regression models were performed to assess the effects of height quartiles and BMI deciles, respectively, on lifespan. Height was divided into quartile and combined in three groups: <163 cm (Q1), 163–171 cm (Q2 & Q3) and >171 cm (Q4). Because of the somewhat narrower distribution, estimated BMI was divided in deciles and also combined into three groups: <19.7 kg/m2 (1st Dec), 19.7–23.7 kg/m2 (2nd–9th Dec) and >23.7 kg/m2 (10th Dec). Multivariate Cox proportional hazards regression was adjusted for HISCLASS, region, fitness to serve, age group, and goitre status.
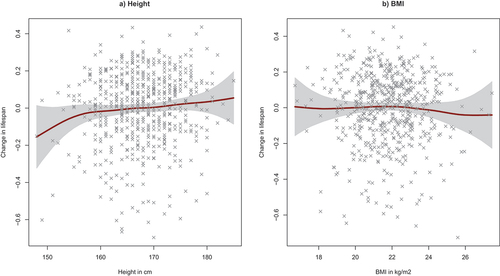
Third, we used a general additive model (GAM) framework to assess the non-linear associations between the dependent variable lifespan and the independent variables. GAM models allow not only to assess linear effects, but also to estimate the non-linear effect of selected continuous independent variables on the dependent variable via general smoothed terms (Wood, Citation2017). In our models we used smooth terms for height (cm) and estimated BMI (kg/m2) and linear terms for HISCLASS, region, fitness to serve, age group and goitre status. Lifespan was rounded to the nearest whole year and can be described by a Poisson distribution. However, since lifespan was over-dispersed resulting from a larger variance than the mean, we chose the negative binomial distribution to model lifespan (Rigby & Stasinopoulos, Citation2005). We tested all linear terms for multicollinearity by calculating the variance inflation factor and the smoothed terms by measuring the concurvity. All variance inflation factors were smaller than 1.2 and the concurvity indices were smaller than 0.09. Thereby all variables are considered non-collinear. We performed two separated models: one with height as smooth term and another with BMI. The linear terms were the same in both models.
Fourth, we applied quantitative genetic ‘animal models’, a specific type of mixed model that contains an additive genetic random effect connected to a pedigree that describes the pairwise relatedness of all individuals in our sample (Lynch & Walsh, Citation1998a; Wilson et al., Citation2010), to estimate the heritability of height (i.e. the proportion of the variance in height attributable to additive genetic variance) in the small subsample for the two municipalities of Elm and Linthal for which multi-generational genealogical data is available (Evans et al., Citation2018). As these models are notoriously data-hungry, to maximise the accuracy and precision of our estimate, we also used height data for men conscripted in Glarus in 1877–1878. As these data are only available for Elm and Linthal, they were excluded from all other analyses. We fitted Maternal ID as an additional random effect to account for potential household effects increasing resemblance among brothers (N = 17), and municipality (Elm or Linthal), recruitment year (1877–1878 or 1925–1927) and their interaction as fixed effects. Models were fitted in ASReml-R 4.1 (Butler, Citation2020). The heritability was calculated as the additive genetic variance divided by the phenotypic variance (after accounting for the variance explained by the fixed effects).
All statistical analyses were performed using Stata (Version 14.2) and R Version 4.0.5. The ‘gamlss’ R package (Rigby & Stasinopoulos, Citation2005) was used to estimate the generalised additive models, while ‘survival’ (Therneau, Citation2021) was used to perform the Cox regression models. We used ggplot2 (Wickham, Citation2016) to produce the figures of the GAM and Cox Regression models and Stata to produce the coefficient plots of the ordinary least squares regressions.
3. Results
Of the 1073 young men included in the analysis, the majority of them (94.3%) had been born between 1905 and 1907 and all of them were conscripted in the years 1925 to 1927. Based on the boys born alive reported by the cantonal authorities for the years 1905–1907 and the figures in the recruitment registers, we estimate a birth cohort coverage of 96.0%.
The composition of the data set is shown in . The vast majority (92.5%) of young men were 19 or 20 years old at recruitment (mean: 20.13 years), which corresponds to the regular conscription age. About three quarters of the young men (70.1%) had a place of citizenship within the canton. While 29.9% of the young men lived outside the canton, 21.2% lived in the Lower Main Valley, 23.7% in the Upper Main Valley (including the cantonal capital, Glarus), 12.7% in the Linthal Valley, and 12.5% in the Sernftal Valley. In the dataset, 22.3% of the men belonged to the unskilled workers class, 40.8% to the skilled workers class, 18.6% to the farmers class, 12.5% to the lower middle class, and 5.8% to the elite class. Goitre was diagnosed in 35.4% of cases. Among men who lived outside the canton, goitre was present in only 5.3% of cases. In the four valleys of the canton, the prevalence of goitre varied between 41.9 and 55.3% (the latter in the Lower Main Valley). After the medical examination, 63.3% of the young men were deemed fit for military service.
Table 1. Descriptive statistics categorical variables. A) Full sample; B) Only citizens of the Canton of Glarus (GL) (as only these people can be linked to the genealogical register).
On average, the young men were 167.58 cm tall (SD 6.75, 95% CI 167.17 to 167.98; ). The distribution ranged between 138 cm and 189 cm and is approximately symmetrical (Appendix Figure S3), even if slightly skewed to the left (skewness −0.24). The mean estimated BMI was 21.76 kg/m2, and varied between 16.64 kg/m2 and 27.45 kg/m2. Again, the distribution is approximately symmetrical. According to the WHO categorization, 2.6% were underweight (BMI <18.5 kg/m2) and 2.3% overweight (BMI 25.0–29.9 kg/m2), obesity (BMI ≥ 30.0 kg/m2) did not occur. There is hardly any difference in the descriptive statistics between the full sample and the sample comprising Canton of Glarus citizens only (). The 635 conscripts with cantonal citizenship (out of a total of 827 conscripts) reached an average age of 72.62 years (SD 14.36, range 22.70 to 102.25). Thus, for this quasi cohort, life expectancy at age 20 was 55.01 years (95% CI 53.7 to 56.4). The comparison with whole Switzerland for the same birth cohorts (data source Human Mortality Database) shows a very similar value (55.7 years). The period life expectancy at birth in Switzerland in 1900 and that of Glarus, which corresponds to the Swiss average, is above the Western European average and is only exceeded by the Netherlands and Sweden (Floris et al., Citation2019).
Table 2. Descriptive statistics numerical variables (histograms displayed in Appendix Figure S3). GL = Canton of Glarus.
Ordinary least squares (OLS) estimations show a difference of 2.51 cm (95% CI 1.44 to 3.59) in mean body height between the skilled workers and the unskilled workers and a difference of 5.86 cm (9%% CI 3.02 to 7.89) between the elite and the unskilled workers ( and Appendix Table S2). Conscripts living in the Lower Main Valley and in the Linthal Valley were on average 1.89 cm (95% CI −3.10 to −0.69) and 0.79 cm (95% CI −2.21 to 0.64) shorter than those in the Upper Main Valley (reference group). Conscripts unfit for service were shorter. In contrast, young men with a goitre were 1.20 cm (95% CI 0.28 to 2.13) taller than young men without a goitre. The OLS regression for estimated BMI ( and Appendix Table S2) indicates that men in the lower middle class were not only taller but also 0.49 kg/m2 (95% CI −0.82 to −0.17) thinner than unskilled workers. In contrast to height, there are no clear regional differences in estimated BMI. Not only the men unfit but also those fit for auxiliary service and those who were deferred were thinner. Again, young men with a goitre were not only taller, they also had a 0.30 kg/m2 (95% CI 0.19 to 0.66) higher estimated BMI. The result does not change significantly if we analyse only men with citizenship within the canton.
Figure 2. Coefficient plots visualising the results of the OLS regressions explaining A) mean height and B) mean estimated BMI. The error bars indicate 95% confidence intervals. GL = Canton of Glarus. Full results: See Appendix. Table S2
The multivariable Cox proportional hazards regression models showed that belonging to the fourth quartile of the height distribution (>171 cm) was associated with increased lifespan compared to the first quartile (HR = 0.76, 95% CI 0.60 to 0.96, adjusted Kaplan Meier curves presented in ). The other independent variables – HISCLASS, region, fitness to serve, age group, and goitre status – were not clearly associated with lifespan (Appendix Table S3). For the first or tenth decile of estimated BMI, we found no significant association with lifespan compared to the second through the ninth deciles, which results were confirmed by the GAM models (Appendix Table S4). The significant (p = 0.027) smoothed effect of height on lifespan is shown in . While the positive association is evident across the entire distribution, it is particularly strong for short men. The smoothed effect of estimated BMI on lifespan () shows a tendency towards the expected n-shape (because particularly high and low BMI values are associated with increased mortality; Waaler, Citation1984), but is not significant (p = 0.629). Overall, the height GAM model explained 4.9% of the variance in lifespan, and the estimated BMI model explained 4.0%.
Figure 3. Kaplan Meier curves for survival probabilities showing the results of the multivariable Cox proportional hazards regression models for categorised height (A) and estimated BMI (B). Full results are presented in Appendix. Table S3
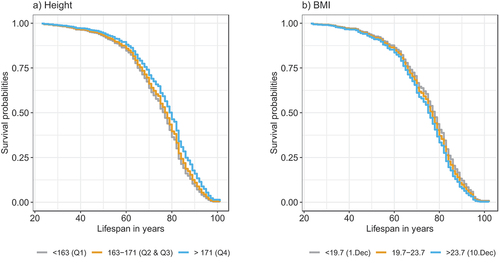
Figure 4. Results from the GAM models explaining variance in lifespan. Only the effect of the smoothed terms height (A) and estimated BMI (B) are shown in the plots, the full results (including HISCLASS, region, fitness to serve, age, and goitre status) can be found in Appendix Table S4. Grey areas indicate 95% confidence intervals.
In the subsample for the two municipalities – Elm (in the Sernftal Valley) and Linthal – for which kinship had already been established, the heritability of height was estimated to be 65% (SE ± 18%) (likelihood ratio test: =3.69, p = 0.021) (Appendix Table S5). Although the number of men in our sample who lived in the same household was small (low statistical power), there was no statistical evidence of maternal/common environmental effects contributing to similarity in height among relatives.
4. Discussion
The young men born in Glarus between 1905 and 1907 were on average 167.6 cm tall at conscription and reached an average age of 72.6 years. The average height corresponds approximately to the Swiss average for these birth cohorts (Floris et al., Citation2019). There were, however, differences within the canton. In the Linthal Valley, the region with the highest proportion of industrial workers, young men tended to be slightly shorter. However, young men were also shorter in the Lower Main Valley region, where the proportion of the agricultural population and the prevalence of goitre was higher. Due to the small data set, it remains open whether the differences are more related to location characteristics or more related to occupation/class characteristics (Schoch, Staub, and Pfister Citation2012).
In general, socioeconomic differences in height and BMI of conscripts in the 19th and first half of the 20th century for the whole of Switzerland and individual cantons are just as well documented as regional differences (Trüb et al., Citation2020; Schoch, Staub, and Pfister Citation2012; Staub et al., Citation2010). The magnitude of the socioeconomic difference in height (about 5 cm between unskilled workers and elite) lies in the range of those previous Swiss studies and the international literature (Öberg, Citation2014). Young men from the lower middle class and the elite class had lower estimated BMI than unskilled workers. Body fat and overweight hardly occur in this historical period and can therefore not explain the socioeconomic differences (Staub et al., Citation2016). The explanations are rather to be found in the work-related physical activity and the associated larger muscle masses in lower social classes (Schoch, Staub, and Pfister Citation2012).
We find that young men with goitre were on average taller in Glarus, while at the ecological level for the whole of Switzerland, districts with a low goitre prevalence showed by average a taller population (Papageorgopoulou et al., Citation2012; Staub & Rühli, Citation2013). However, this ecological association might be more complex and maybe the phenomenon of ecological fallacy plays a role here, when (mis)conclusions are made about the individual from the perspective of aggregated groups (Wakefield & Lyons, Citation2010). It could therefore be that aggregation at district level for the whole of Switzerland blurs important differentiations at lower levels within a selected alpine region like Glarus. In addition, it is not only the high or low prevalence of iodine deficiency and goitre but also other reasons (and thus confounding factors) related to socio-economic background and the standard of living in general that could be the driving reasons for the Western Swiss districts to be taller by average and the Eastern Swiss districts to be shorter (Staub, Citation2010). On an individual level, the connection between iodine deficiency and growth does not seem to be entirely clear either, and probably depends on age as well as the duration of iodine deficiency. Particularly in childhood, the evidence on this association is mixed, depending on the study design and measurement methods. What is clear, however, is that if the iodine deficiency has not lasted very long, the thyroid gland will diffusely enlarge and an overproduction of hormones will occur in order to compensate (Zimmermann, Citation2009; Zimmermann et al., Citation2007). It is precisely in this phase that the positive correlation between goitre and body height found in this study makes sense. Unfortunately, the individual information from the recruitment source does not allow this differentiation into early vs. chronic or mild vs. severe phases of iodine deficiency.
In linking individual conscription data (anthropometrics and other health data) with lifespan information from genealogical registers, we find a positive effect of body height on lifespan for Switzerland in a historical setting, with particularly short men being disadvantaged. The difference, however, is rather small (2–3%). Due to limited sample sizes and temporally and spatially divergent study areas in most similar studies, a comparison with the literature is difficult. But the small difference confirms to some extent the findings of a study of conscripts from rural Spain, which found a decreasing and disappearing difference in life expectancy between taller and shorter conscripts for early 20th century birth cohorts (Marco-Gracia & Puche, Citation2021). We cannot say with our three sample years how the relationship changes over time, but we can say that the effect is still visible in the 1900 birth years. The rather small effect we found is probably also due to the fact that our models can only capture part of the relevant factors and because, as is suggested in the literature, height and mortality probably reflect different aspects of health status (Öberg, Citation2014). First, our cofactors were collected at age 19 or 20 years, and these cofactors may change across the course of a lifetime, as it has recently been suggested for conscripts born in the middle of the 19th century in the Dutch city of Maastricht (Thompson et al., Citation2020). Second, it would be important to analyse causes of death. Third, genetics might play an important role. This could only be approximated if all kinship in the genealogical register could be digitised and included in the models. Our calculation of the heritability of body height (65%) in the villages of Elm and Linthal shows the potential of such kinship aspects. The estimated 65% heritability of height is similar to modern samples from developing countries (50–60%) but lower than the 80% typically reported in affluent societies, probably due to less stable conditions and thus a stronger environment effect (Perkins et al., Citation2016; Roberts et al., Citation1978; Wells & Stock, Citation2011).
Our study does have some limitations. First, our study only analyses data from three consecutive years of recruitment. However, the existing sample is not considered too small, as the post-hoc calculated power in all models was very close to 1. It is clear, however, that the addition of more recruitment years since 1875 would allow interesting cross-temporal assessments (Marco-Gracia & Puche, Citation2021). For reasons of feasibility (especially concerning the linkage with the complexly structured genealogical register), however, this must be reserved for future follow-up studies. Second, we only have males in our dataset. Unfortunately, other archival sources that might contain body measurements of women (e.g., birth records from maternity hospitals or passport registers (Koepke et al., Citation2018) are not available. Third, the record linkage was not perfect: we could not uniquely identify about 20% of the conscripts with citizenship in Glarus in the genealogical register, and making a manual search is much more difficult for smaller communities. Fourth, as we were only able to transcribe three consecutive conscription years and link them to the genealogical register, increasing the sample size in future studies would allow modelling at the municipality level rather than at the region level for spatial resolution. In this way, socio-demographic parameters of the individual municipalities could be better addressed than at the level of the four regions. Fifth, the calculation of heritability was limited to a very small sample of two communities. Sixth, more details regarding the available variables would have been desirable in some cases, in particular for the differentiation of goitres into diffusely enlarged thyroid glands versus nodules (this coded information has not yet been transcribed from the archival sources), or related to HISCLASS, such as the occupation of the father. Earlier studies for the city of Basel at the end of the 19th century, however, showed that there is a good correspondence between the social classes of the conscripts and their fathers (Schoch, Staub, and Pfister Citation2012). Seventh, we did not include age at marriage, number of offspring, birth years of children, birth order, number of relatives in a given village, or sibship size as in other studies (Beekink & Kok, Citation2017; Kok et al., Citation2018; Manfredini et al., Citation2010; Marco-Gracia & Puche, Citation2021; Mazzoni et al., Citation2017; Öberg, Citation2015; Quanjer & Kok, Citation2020, Citation2019; Ramon-Muñoz & Josep-Maria, Citation2017; Thompson et al., Citation2020) which would allow modelling of life history trade-offs, for example, increased height and longevity vs. earlier reproduction (Gluckman et al., Citation2009; Jäggi et al., Citation2022).
We analysed two indicators of the standard of living in Glarus, a alpine region characterised by early and strong industrialisation. The article shows a snapshot of the standard of living of young men (birth years 1905–1907) whose standard of living in general was improving (greater average height and longer life expectancy). We see differences in height by social and regional origin and still a positive relationship between height and life expectancy. We point out that the influence of the health and disease environment on body size goes beyond the burden of infectious diseases by showing that chronic deficiency states are also related to growth. However, the example of iodine deficiency, which was endemic in the Alpine regions, also shows that the relationship between hormone status and growth is complex and requires further research.
Reviewer_Comments_V1.docx
Download MS Word (38.2 KB)Acknowledgement
We thank Beat Mahler of the Landesarchiv des Kantons Glarus (for providing access to the data), Frank Rühli and Ulrich Woitek (for support and earlier collaborations), and Barry Bogin, Marek Brabec, Jonathan Wells, Katharina Matthes, Jan Kok, Björn Quanjer, Kristina Thompson, France Portrait, Vincent Tassenaar, as wells as the participants of the virtual workshop “Height and Later-life Outcomes” in March 2021 (for helpful comments).
Disclosure statement
No potential conflict of interest was reported by the author(s).
Supplementary material
Supplemental data for this article can be accessed online at https://doi.org/10.1080/1081602X.2022.2100806
Additional information
Funding
Notes
1. The Zurich Cantonal Ethics Committee confirmed in 2016 that ethics approval is not required for work with historical data related to individuals born 114–116 years ago.
References
- Andreella, C., Karlsson, M., Nilsson, T., & Westphal, M. (2016). The long shadows of past insults: Intergenerational transmission of health over 130 years. IFN Working Paper 1125, Stockholm: Research Institute of Industrial Economics (IFN), http://hdl.handle.net/10419/175062
- Arcaleni, E. (2006). Secular trend and regional differences in the stature of Italians, 1854–1980. Economics & Human Biology, 4(1), 24–38. https://doi.org/10.1016/j.ehb.2005.06.003
- Armee, S. (1875). Instruction über die untersuchung und ausmusterung der militärpflichtigen (Instruction on the examination and discharge of military conscripts). Bern.
- Baten, J., & Blum, M. (2014). Why are you tall while others are short? Agricultural production and other proximate determinants of global heights. European Review of Economic History, 18(2), 144–165. https://doi.org/10.1093/ereh/heu003
- Beekink, E., & Kok, J. (2017). Temporary and lasting effects of childhood deprivation on male stature: Late adolescent stature and catch-up growth in woerden (the Netherlands) in the first half of the Nineteenth Century. The History of the Family, 22(2–3), 196–213. https://doi.org/10.1080/1081602X.2016.1212722
- Bengtsson, T., & Dribe, M. (2011). The late emergence of socioeconomic mortality differentials: A micro-level study of adult mortality in Southern Sweden 1815–1968. Explorations in Economic History, 48(3), 389–400. https://doi.org/10.1016/j.eeh.2011.05.005
- Bengtsson, T., & vanPoppel, F. (2011). Socioeconomic inequalities in death from past to present: An introduction. Explorations in Economic History, 48(3), 343–356. https://doi.org/10.1016/j.eeh.2011.05.004
- Blum, M., & Eoin, M. (2019). Living standards and inequality in the industrial revolution: Evidence from the height of university of Edinburgh students in the 1830s. Economics & Human Biology, 35(December), 185–192. https://doi.org/10.1016/j.ehb.2019.07.004
- Bogin, B. (1999). Patterns of Human Growth (2nd ed.). Cambridge University Press.
- Bozzoli, C., Deaton, A., & Quintana-Domeque, C. (2009). Adult height and childhood disease. Demography, 46(4), 647–669. https://doi.org/10.1353/dem.0.0079
- Bürgi, H., Supersaxo, Z., & Selz, B. (1990). Iodine deficiency diseases in Switzerland one hundred years after Theodor kocher’s survey: A historical review with some new goitre prevalence data. Acta Endocrinologica (Copenhagen), 123(6), 577–590. https://doi.org/10.1530/acta.0.1230577
- Butler, D. (2020). Package “Asreml”: Fits the linear mixed model (R Package Version 4.1.0.130).
- Clark, G. (2014). The Son Also Rises: Surnames and the History of Social Mobility. Princeton University Press. Princeton Economic History of the Western World.
- Cole, T. J. (2003). The secular trend in human physical growth: A biological view. Economics & Human Biology, 1(2), 161–168. https://doi.org/10.1016/S1570-677X(02)00033-3
- Deaton, A. (2007). Height, Health, and Development. Proceedings of the National Academy of Sciences of the United States of America, 104(33), 13232–13237. https://doi.org/10.1073/pnas.0611500104
- Deaton, A., & Arora, R. (2009). Life at the top: The benefits of height. Economics & Human Biology, 7(2), 133–136. https://doi.org/10.1016/j.ehb.2009.06.001
- Eidg. Statistisches Bureau, ed. (1934). Eidgenössische Volkszählung 1. Dezember 1930: Band 17, Glarus. Statistische Quellenwerke Der Schweiz.
- Eidgenössisches Statistisches Bureau, ed. (1923). Eidgenössische Volkszählung Vom 1. Dezember 1920. Kantonsweise Ergebnisse. Uri, Schwyz, Unterwalden, Glarus, Zug. Francke.
- The Emerging Risk Factors Collaboration. (2012). Adult height and the risk of cause-specific death and vascular morbidity in 1 million people: Individual participant meta-analysis. International Journal of Epidemiology, 41(5), 1419–1433. https://doi.org/10.1093/ije/dys086
- Engeland, A., Bjørge, T., Selmer, R. M., & Tverdal, A. (2003). Height and body mass index in relation to total mortality. Epidemiology, 14(3), 293–299. https://doi.org/10.1097/01.EDE.0000047889.30616.73
- Evans, S. R., Waldvogel, D., Vasiljevic, N., & Postma, E. (2018). Heritable spouse effects increase evolutionary potential of human reproductive timing. Proceedings of the Royal Society B. Biological Sciences, 285(1876), 20172763. https://doi.org/10.1098/rspb.2017.2763
- Favre, G., Floris, J., & Woitek, U. (2018). Intergenerational mobility in the 19th century: Micro-level evidence from the City of Zurich. https://doi.org/10.5167/UZH-145232
- Favre, G. (2019). Bias in social mobility estimates with historical data: evidence from Swiss microdata. https://doi.org/10.5167/UZH-172229
- Floris, J., Höpflinger, F., Stohr, C., Studer, R., & Staub, K. (2019). Wealthier – Older – Taller: Measuring the standard of living in Switzerland since the 19th century. Schweizerische Zeitschrift für Geschichte, 69(2), 207–232. doi:10.5167/uzh-173655
- Floud, R., Fogel, R. W., Harris, B., & Hong, S. C. (2011). The changing body: Health, nutrition, and human development in the Western world since 1700. Cambridge University Press. https://doi.org/10.1017/CBO9780511975912
- Gausman, J., Guevara, I. M., Subramanian, S. V., Razak, F., & Byass, P. (2018). Distributional change of women’s adult height in low- and middle-income countries over the past half century: An observational study using cross-sectional survey data. PLOS Medicine, 15(5), e1002568. https://doi.org/10.1371/journal.pmed.1002568
- Gluckman, P., Beedle, A., Buklijas, T., Low, F., & Hanson, M. (2009). Principles of evolutionary medicine. Oxford University Press.
- Hällsten, M., & Kolk, M. (2020). The shadow of peasant past: seven generations of inequality persistence in Northern Sweden. Preprint. SocArXiv. https://doi.org/10.31235/osf.io/yjksz
- Harris, B. (2003). Human growth from conception to maturity (book review). Economics & Human Biology, 1(3), 409–411. https://doi.org/10.1016/j.ehb.2003.08.002
- Hatton, T. J., & Bray, B. E. (2010). Long run trends in the heights of European men, 19th-20th Centuries. Economics & Human Biology, 8(3), 405–413. https://doi.org/10.1016/j.ehb.2010.03.001
- Herpin, N. (2005). Love, careers, and heights in France, 2001. Economics & Human Biology, 3(3), 420–449. https://doi.org/10.1016/j.ehb.2005.04.004
- Historische Statistik der Schweiz (HSSO). (2012). Lebendgeborene Nach Kantonen 1801-1866 Und 1867-1995. Tab. C.18 (HSSO Database). https://hsso.ch/2012/c/18
- Horrell, S., Humphries, J., & Voth, H.-J. (2001). Destined for deprivation: Human capital formation and intergenerational poverty in Nineteenth-Century England. Explorations in Economic History, 38(3), 339–365. https://doi.org/10.1006/exeh.2000.0765
- Hübler, O. (2016). Height and Wages. In J. Komlos & I. R. Kelly (Eds.), The oxford handbook of economics and human biology (pp. 500–520). New York: Oxford University Press. https://doi.org/10.1093/oxfordhb/9780199389292.013.29
- Jäggi, A., Martin, J. S., Floris, J., Bender, N., Häusler, M., & Staub, K. (2022). Life-history strategies and tradeoffs in a historical population (1896-1939): The onset and costs of reproduction. Evolutionary Human Sciences, 4, E7. https://doi.org/10.1017/ehs.2022.2
- Koepke, N., Floris, J., Pfister, C., Rühli, F. J., & Staub, K. (2018). Ladies first: Female and male adult height in Switzerland, 1770–1930. Economics & Human Biology, 29, 76–87. https://doi.org/10.1016/j.ehb.2018.02.002
- Kok, J., Beekink, E., & Bijsterbosch, D. (2018). Environmental influences on young adult male height: A comparison of Town and Countryside in the Netherlands, 1815-1900. Historical Life Course Studies, 6, 95–110. https://doi.org/10.51964/hlcs9330
- Komlos, J. (2009). Anthropometric history: An overview of a quarter century of research. Anthropologischer Anzeiger, 67(4), 341–356. https://doi.org/10.1127/0003-5548/2009/0027
- Kubly-Müller, J. J. (1912). Die Genealogien-Werke Des Kantons Glarus. Archiv Für Heraldik, 4, 164–187.
- Kurz, H. R. (1985). Geschichte der Schweizer Armee (History of the Swiss Armed Forces). Verlag Huber.
- Leeuwen van, M. H. D., Maas, I., & Miles, A. (2002). HISCO. Historical international standard classification of occupation (Database). Leuven University Press.
- Lorenzetti, L., & Meffre, V. (2005). La Transition Sanitaire Dans Les Alpes Suisses: Les Aspects Démographiques Du Retard (1880-1920). Text/html,application/pdf, 233–50. https://doi.org/10.5169/SEALS-10952
- Lynch, M., & Walsh, B. (1998a). Genetics and analysis of quantitative traits. Sinauer.
- Magnusson, P. K. E., Rasmussen, F., & Gyllensten, U. B. (2006). Height at age 18 years is a strong predictor of attained education later in life: Cohort study of over 950,000 Swedish Men. International Journal of Epidemiology, 35(3), 658–663. https://doi.org/10.1093/ije/dyl011
- Manfredini, M., Breschi, M., & Mazzoni, S. (2010). Spouse selection by health status and physical Traits. Sardinia, 1856-1925. American Journal of Physical Anthropology, 141(2), 290–296. https://doi.org/10.1002/ajpa.21150
- Marco-Gracia, F. J., & Puche, J. (2021). The association between male height and lifespan in rural Spain, Birth Cohorts 1835-1939. Economics & Human Biology, 43, 101022. https://doi.org/10.1016/j.ehb.2021.101022
- Mazzoni, S., Breschi, M., Manfredini, M., Pozzi, L., & Ruiu, G. (2017). The relationship between family characteristics and height in Sardinia at the turn of the Twentieth Century. The History of the Family, 22(2–3), 291–309. https://doi.org/10.1080/1081602X.2016.1230509
- McEvoy, B. P., & Visscher, P. M. (2009). Genetics of human height. Economics & Human Biology, 7(3), 294–306. https://doi.org/10.1016/j.ehb.2009.09.005
- NCD Risc Factor Collaboration (NCD-RisC). (2016). A century of trends in adult human height. ELife, 5, e13410. https://doi.org/10.7554/eLife.13410
- Öberg, S. (2014). Long-term changes of socioeconomic differences in height among young adult men in Southern Sweden, 1818–1968. Economics & Human Biology, 15, 140–152. https://doi.org/10.1016/j.ehb.2014.08.003
- Öberg, S. (2015). Sibship size and height before, during, and after the fertility decline. Demographic Research, 32, 29–74. https://doi.org/10.4054/DemRes.2015.32.2
- Panczak, R., Moser, A., Philip A. Jones, L. H., Rühli, F. J., & Staub, K. (2017). A tall order: Small area mapping and modelling of adult height among Swiss male conscripts. Economics & Human Biology, 26, 61–69. https://doi.org/10.1016/j.ehb.2017.01.005
- Papageorgopoulou, C., Staub, K., & Rühli, F. J. (2012). Hypothyroidism in Switzerland from an anthropological, clinical and historic perspective. RCC Perspectives, 3, 75–90. https://www.jstor.org/stable/26240376
- Perkins, J. M., Subramanian, S. V., Smith, G. D., & Emre, Ö. (2016). Adult height, nutrition, and population health. Nutrition Reviews, 74(3), 149–165. https://doi.org/10.1093/nutrit/nuv105
- Quanjer, B., & Kok, J. (2019). Homemakers and heights: Intra-household resource allocation and male Stature in the Netherlands, 1860–1930. Economics & Human Biology, 34, 194–207. https://doi.org/10.1016/j.ehb.2019.04.003
- Quanjer, B., & Kok, J. (2020). Drafting the Dutch: Selection biases in Dutch conscript records in the second half of the Nineteenth Century. Social Science History, 44(3), 501–524. https://doi.org/10.1017/ssh.2020.13
- Ramon-Muñoz, R., & Josep-Maria, R.-M. (2017). Sibship size and the biological standard of living in industrial Catalonia, ca. 1860–c.1920: A case study. The History of the Family, 22(2–3), 333–363. https://doi.org/10.1080/1081602X.2016.1224727
- Rey, Urs. (2003). Demografische Strukturveränderung Und Binnenwanderung in Der Schwiez, 1850-1950 [ PhD]. Universität Zürich.
- Rigby, R. A., & Stasinopoulos, D. M. (2005). Generalized additive models for location, scale and Shape. Journal of the Royal Statistical Society. Series C (Applied Statistics), 54(3), 507–554. https://doi.org/10.1111/j.1467-9876.2005.00510.x
- Roberts, D. F., Billewicz, W. Z., & McGregor, I. A. (1978). Heritability of stature in a West African Population. Annals of Human Genetics, 42(1), 15–24. https://doi.org/10.1111/j.1469-1809.1978.tb00928.x
- Rohr, A. (2005). Das Glarnerische Wirtschaftswunder. In Rolf von Arx, Jürg Davatz, August Rohr (EDs.)Industriekultur Im Kanton Glarus: Streifzüge Durch 250 Jahre Geschichte Und Architektur (pp. 12–43). Südostschweiz Buchverlag.
- Rohrmann, S., Haile, S. R., Staub, K., Bopp, M., & Faeh, D. (2017). Body height and mortality - mortality follow-up of four Swiss surveys. Preventive Medicine, 101, 67–71. https://doi.org/10.1016/j.ypmed.2017.05.023
- Schoch, T., Staub, K., & Pfister, C. (2012). Social inequality and the biological standard of living: An anthropometric analysis of Swiss conscription data, 1875–1950. Economics & Human Biology, 10(2), 154–173. https://doi.org/10.1016/j.ehb.2011.05.001
- Schumacher, R., & Oris, M. (2011). Long-term changes in social mortality differentials, Geneva, 1625–2004. Explorations in Economic History, 48(3), 357–365. https://doi.org/10.1016/j.eeh.2011.05.011
- Siegenthaler, J. K. (1985). Konflikte Der Industrialisierung. Industrie, Raum Und Gesellschaft in Glarus Und Scranton 1840-1914. Peter Lang.
- Staub, K. (2010). Der Biologische Lebensstandard in Der Schweiz Seit 1800. Historisch-Anthropometrische Untersuchung Der Körperhöhe (Und Des Körpergewichts) in Der Schweiz Seit 1800, Differenziert Nach Geschlecht, Sozioökonomischem Und Regionalem Hintergrund [ PhD]. Universität Bern. https://doi.org/10.7892/boris.89076
- Staub, K., Rühli, F. J., Woitek, U., & Pfister, C. (2010). BMI distribution/social stratification in Swiss conscripts from 1875 to present. European Journal of Clinical Nutrition, 64(4), 335–340. https://doi.org/10.1038/ejcn.2010.7
- Staub, K., & Rühli, F. J. (2013). “From growth in height to growth in breadth”: The changing body shape of Swiss conscripts since the late 19th century and possible endocrine explanations. General and Comparative Endocrinology, 188, 9–15. https://doi.org/10.1016/j.ygcen.2013.03.028
- Staub, K., Floris, J., Woitek, U., & Rühli, F. J. (2014). From left-skewness to symmetry: how body-height distribution among Swiss conscripts has changed shape since the late 19th century. Annals of Human Biology, 42(3), 262–269. https://doi.org/10.3109/03014460.2014.942366
- Staub, K., Bender, N., Floris, J., Pfister, C., & Rühli, F. J. (2016). From undernutrition to overnutrition: The evolution of overweight and obesity among young men in Switzerland since the 19th century. Obesity Facts, 9(4), 259–272. https://doi.org/10.1159/000446966
- Steckel, R. H. (2009). Heights and human welfare: Recent developments and new directions. Explorations in Economic History, 46(1), 1–23. https://doi.org/10.1016/j.eeh.2008.12.001
- Stiner, O. (1924). Die Verbreitung des endemischen Kropfes in der Schweiz nach neueren Ergebnissen der Rekrutenuntersuchungen (The prevalence of endemic goitre in Switzerland according to recent results of recruit surveys). Schweizerische Medizinische Wochenschrift, 54, 391–397.
- Stohr, C. (2018). Multiple core regions: regional inequality in Switzerland, 1860–2008. Research in Economic History, 34, 135–198. https://doi.org/10.1108/S0363-326820180000034005
- Stulp, G., Pollet, T. V., Verhulst, S., & Buunk, A. P. (2012). A curvilinear effect of height on reproductive success in human males. Behavioral Ecology and Sociobiology, 66(3), 375–384. https://doi.org/10.1007/s00265-011-1283-2
- Stulp, G., Barrett, L., Tropf, F. C., & Mills, M. (2015). Does natural selection favour taller stature among the tallest people on earth? Proceedings of the Royal Society B. Biological Sciences, 282(1806), 20150211. https://doi.org/10.1098/rspb.2015.0211
- Stulp, G., & Barrett, L. (2016). Evolutionary perspectives on human height variation. Biological Reviews, 91(1), 206–234. https://doi.org/10.1111/brv.12165
- Tanner, J. M. (1990). Foetus into Man: Physical growth from conception to maturity (2nd ed.). Harvard University Press.
- Tassenaar, V., & Karel, E. H. (2016). The power of the kashrut: older but shorter. the impact of religious nutritional and hygienic rules on stature and life expectancy of Jewish conscripts in the early 19th century. European Journal of Clinical Nutrition, 70(6), 667–670. https://doi.org/10.1038/ejcn.2016.24
- Therneau, T. M. (2021). Package “Surviavle”: Survival analysis (R Package Version 3.3-1).
- Thompson, K., Quanjer, B., & Murkens, M. (2020). Grow fast, die young? The causes and consequences of adult height and prolonged growth in Nineteenth Century Maastricht. Social Science & Medicine, 266(December), 113430. https://doi.org/10.1016/j.socscimed.2020.113430
- Trüb, F. P., Jonathan, C. K., Wells, F. J., Rühli, K. S., & Floris, J. (2020). Filling the weight gap: estimating body weight and BMI using height, chest and upper arm circumference of Swiss conscripts in the first half of the 20th century. Economics & Human Biology, 38, 100891. https://doi.org/10.1016/j.ehb.2020.100891
- Visscher, P. M., McEvoy, B., & Yang, J. (2010). From Galton to GWAS: Quantitative genetics of human height. Genetics Research, 92(5–6), 371–379. https://doi.org/10.1017/S0016672310000571
- Waaler, H. T. (1984). Height, weight and Mortality. The Norwegian experience. Acta Medica Scandinavica. Supplementum, 679, 1–56. https://doi.org/10.1111/j.0954-6820.1984.tb12901.x
- Wakefield, J., & Lyons, H. (2010). Spatial aggregation and the ecological fallacy. In A. Gelfand, P. Diggle, M. Fuentes, & P. Guttorp (Eds.), Handbook of Spatial Statistics 20103158 (pp. 541–558). Chapman & Hall/CRC Handbooks of Modern Statistical Methods. CRC Press. https://doi.org/10.1201/9781420072884-c30
- Wan Naraimoon, W. M., Oman, A., Wu, L. L., & Khalid, B. A. K. (1996). Effects of iodine deficiency on insulin-like growth factor-i, insulin-like growth factor-binding protein-3 levels and height attainment in malnourished children. Clinical Endocrinology, 45(1), 79–83. https://doi.org/10.1111/j.1365-2265.1996.tb02063.x
- Wells, J. C. K., & Stock, J. T. (2011). Re-examining heritability: Genetics, life history and plasticity. Trends in Endocrinology & Metabolism, 22(10), 421–428. https://doi.org/10.1016/j.tem.2011.05.006
- Wells, J. C. K. (2017). Worldwide variability in growth and its association with health: Incorporating body composition, developmental plasticity, and intergenerational effects. American Journal of Human Biology, 29(2), 22954. https://doi.org/10.1002/ajhb.22954
- Wickham, H. (2016). Ggplot2: elegant graphics for data analysis. Berlin. Springer.
- Wilson, A. J., Denis Réale, M. N., Clements, M. M., Morrissey, E. P., Walling, C. A., Kruuk, L. E. B., & Nussey, D. H. (2010). An ecologist’s guide to the animal model. Journal of Animal Ecology, 79(1), 13–26. https://doi.org/10.1111/j.1365-2656.2009.01639.x
- Wood, S. N. (2017). Generalized additive models: An introduction with R (2nd ed.). Chapman and Hall/CRC.
- Zanden van, J. L., Auke Rijpma, J. B., Marcel Timmer, C. S., & Ercole, M. M. D. (eds). (2014). How was life? Global well-being since 1820. OECD Publishing.
- Zimmermann, M. B., Jooste, P. L., Mabapa, N. S., Mbhenyane, X., Schoeman, S., Biebinger, R., Bridson, J., Chaouki, N., Bozo, M., & Grimci, L. (2007). Treatment of iodine deficiency in school-age children increases Insulin-like Growth Factor (IGF)-I and IGF binding protein-3 concentrations and improves somatic growth. The Journal of Clinical Endocrinology & Metabolism, 92(2), 437–442. https://doi.org/10.1210/jc.2006-1901
- Zimmermann, M. B. (2009). Iodine deficiency. Endocrinology Reviews, 30(4), 376–408. https://doi.org/10.1210/er.2009-0011