
 ?Mathematical formulae have been encoded as MathML and are displayed in this HTML version using MathJax in order to improve their display. Uncheck the box to turn MathJax off. This feature requires Javascript. Click on a formula to zoom.
Abstract
Background: Several components of the Swedish alcohol policy, e.g., pricing and availability, weakened when Sweden joined the EU in 1995. To counteract the possible negative effects of this, emphasis was placed on the local level as an important arena of alcohol prevention. Thus, considerable efforts were made to strengthen alcohol prevention in Swedish municipalities. Objectives: The aim of this study was to examine whether local alcohol prevention reduced consumption and alcohol-related harm in Swedish municipalities. Methods: Alcohol prevention was monitored using a composite measure called the Alcohol Prevention Magnitude Measure (APMM), with subcategories of staff and budget, inspections and licenses, policy, activities, and cooperation. APMM and its categories were analysed in relation to alcohol consumption and harm over time, 2006–2014. A fixed effects model was used with 63% (N=182, consumption) and 71% (N=207, harm) of 290 Swedish municipalities, respectively, included in the analyses. Results: The main results suggest that when APMM increases with 1 percent, the alcohol-related mortality decreases with 0.26 percent, controlled for changes in population size, median income, unemployment, and post-secondary education. In light of this result, the estimated effect of APMM on alcohol consumption (sales) is small (0.02 percent decrease); possible explanations for this are discussed in the article. Conclusion: The overall results indicate that local alcohol prevention initiatives in Sweden have reduced some forms of alcohol-related harm, not least alcohol-related mortality, during the period 2006–2014. Further studies are needed to assess the generalizability of the present study.
Background
Alcohol consumption and mortality due to alcohol consumption are quite low in Sweden compared with other countries in Europe (World Health Organization, Citation2018). Nevertheless almost six percent (446,000 individuals) have been assessed (in 2013) to be dependent on alcohol or have a harmful alcohol use (Ramstedt, Sundin, Landberg, & Raninen, Citation2014). Thus, alcohol consumption cause a great deal of health problems in Sweden.
In the past 15 years, Sweden has placed increasing emphasis on local alcohol prevention initiatives (i.e. interventions) and their importance have repeatedly been expressed in Swedish national alcohol action plans (2001–2005, 2006–2010) (Government proposition 2000/01:20,01:20, Citation2000; 2005/06:30, Citation2005) and strategies (2011–2015, 2016–2020) (Government proposition 2010/11:47,11:47, Citation2010; Government writing 2015/16:86,16:86, Citation2016). Extensive economic resources have therefore been invested in order to enhance the structure of community-based (local) prevention initiatives and to develop more evidence-based methods and local prevention interventions. Furthermore, several specific nationally supported community intervention projects have been conducted during these years. The source of policy change at the local level is typically the municipality board.
These increased efforts at the local level should be understood in relation to the Swedish EU membership in 1995, which made it difficult to uphold the same degree of restrictiveness in the national alcohol policy as before (Andréasson, Citation2002; Leimar, Ramstedt, & Weibull, Citation2013). One direct consequence of the EU membership was the gradual abolition of the restrictive Swedish import rules on alcoholic beverages from other member states, which increased the availability of cheaper alcohol from abroad. This put pressure on the Swedish government to liberalize the restrictive Swedish policy, in particular the use of high taxes on alcoholic beverages.
Despite the increased efforts in local prevention throughout Sweden, knowledge is limited regarding the effects of these activities on alcohol consumption and related harm. One of the few studies on the topic (Stafström, Citation2007) investigated the potential of applying a community-based intervention in one city in southern Sweden (1999–2002) in order to reduce alcohol use among adolescents. Findings from this study support the assumption that a municipality can reduce alcohol use and alcohol-related harm among adolescents by implementing a city policy program including an action plan. Another community trial suggested no effect on either alcohol consumption or related harm in the intervention municipalities (N = 6) compared with the controls (Hallgren & Andreasson, Citation2013). However, a recent study of another Swedish community intervention that we conducted (Nilsson et al., Citation2018) suggested that it might have been effective, since the intervention municipalities (N = 25) showed increased prevention initiatives and reduced alcohol consumption and harm rates relative to the control municipalities. In yet another study, an alcohol prevention index called Alcohol Prevention Magnitude Measure (APMM) was constructed, validated, and used to monitor the development of alcohol prevention among Swedish municipalities (N = 189). The results from that study revealed that local alcohol prevention initiatives increased in Sweden from 2006 to 2010 and that municipalities supported by national alcohol prevention projects increased their prevention initiatives significantly compared with municipalities that did not get such support (Nilsson, Leifman, & Andréasson, Citation2015). However, this study did not assess possible prevention effects on consumption and harm.
To conclude, local alcohol prevention in Sweden has been strengthened significantly in the past 15 years and unique data on local alcohol prevention initiatives are available covering several years, as well as local data on alcohol consumption and related harm.
The aim of this study was to use these local data to analyze if alcohol prevention efforts conducted in Swedish municipalities (measured using APMM) have had any impact on alcohol consumption (sales) and harm rates (traffic accidents, violence, morbidity, mortality) during the period 2006 to 2014.
This present study has an approach that is in parts (statistically, consumption and harm indicators) similar to our previous investigation (Nilsson et al., Citation2018), where we analyzed a specific community intervention with national support in Sweden. However, in the present study, we have analyzed the effectiveness of alcohol prevention initiatives more generally and in direct relation to consumption and harm development among a majority of municipalities in Sweden, using the Alcohol Prevention Magnitude Measure (APMM).
As far as we know, there is no other study that has applied a composite prevention measure in order to analyze the impact of “overall” local alcohol prevention initiatives on consumption and harm over time among the majority of municipalities in a country. A recent review Comparative policy analysis for alcohol and drugs: Current state of the field (Ritter, Livingston, Chalmers, Berends, & Reuter, Citation2016) supports that our approach seems to be the first of its kind. However, there are some similar studies conducted on US states, which have found that stronger alcohol policies are associated with decreased binge drinking (Naimi et al., Citation2014; Xuan, Blanchette, Nelson, Heeren, Oussayef, et al., Citation2015), lower alcoholic cirrhosis mortality rates (Hadland et al., Citation2015), lower prevalence of impaired driving (Xuan, Blanchette, Nelson, Heeren, Nguyen, et al., Citation2015), and reduced alcohol involvement in fatal motor vehicle crashes (Naimi et al., Citation2018). These studies are thus based on the state level, which would be equivalent to the county level (N = 21) in Sweden, a level above the municipalities which are the focus of the present study.
Methods
Study population
The study population was based on prevention data available from Swedish municipalities. Data for the Alcohol Prevention Magnitude Measure (APMM) originated from a yearly web-based survey regarding 1) local drug prevention initiatives and 2) inspections pursuant to the Alcohol Act conducted by the Public Health Agency of Sweden (PHAS). The survey is filled out by municipal prevention coordinators or individuals in similar positions. Survey response rates have improved over the years and in 2014, as an example, 95 percent of all municipalities responded to questions on local drug prevention (Public Health Agency of Sweden, Citation2015). Register data on licensed premises were also used in APMM and these were obtained from PHAS. Survey and register data were ordered and delivered from PHAS by email.
We selected municipalities that had APMM data for at least eight of the nine years within the study period, 2006–2014 in order to include as many municipalities as possible with sufficient data. Missing data were replaced by the previous year’s data. For the year 2006 (the first year), missing data were replaced by data from 2007, as APMM data are not available prior to 2006. The metropolitan municipalities, Stockholm, Gothenburg, and Malmö, were excluded since the PHAS’s web survey, which was used to gather the data, was not adapted for municipalities that were divided into districts until 2011. This selection process reduced the sample to 207 municipalities (71%) of the total 290 municipalities in Sweden. Of these 207 municipalities, 128 (62%) had data for the entire study period and the remaining 79 (38%) had missing data for one year, which was replaced by data from the previous year. The study sample (N = 207) comprised (year 2014) 5,476,900 inhabitants (age 15+, population in municipalities from 2,634 to 172,469) which accounts for almost 68 percent of the total population (age 15+) in Sweden.
Indicators of prevention
In this study, local alcohol prevention refers to preventive efforts carried out by the municipalities in Sweden. The prevention efforts conducted in municipalities were measured using APMM, which comprises 37 indicators of alcohol prevention initiatives ( in the appendix). These 37 indicators were divided into five categories: 1) policy, 2) staff and budget, 3) inspections and licenses, 4) cooperation, and 5) activities. Each of these categories generated 20 points and the total maximal sum was 100 points (5*20 points). Policy, staff and budget, and cooperation can be seen as prerequisites for activities and they are significantly positively correlated with the subcategory activities. Inspections and licenses do not show any such correlation with any of these subcategories (Nilsson et al., Citation2015). This might be because inspections of licensed premises are not always viewed by municipalities as prevention. Such inspections can be conducted by separate units within municipalities. Previous findings suggest that APMM captures real prevention changes (Nilsson et al., Citation2015).
Table A1. Alcohol Prevention Magnitude Measure: categories, indicators, cutoff and points.
Indicators of consumption and harm
Indicators of alcohol consumption and harm used in the study are shown in . The selection of indicators followed recommendations from a project group commissioned by the Swedish government to suggest suitable indicators for monitoring the Swedish national alcohol and drug strategy (Government Offices of Sweden, Citation2013). While our choice of indicators was limited due to lack of data at the local level, they are commonly used in alcohol epidemiology (Leifman, Ramstedt, & Österberg, Citation2002; Rehm & Scafato, Citation2011; World Health Organization, Citation2000). Sales data were used as a proxy for consumption and 182 out of the 207 municipalities in the overall study sample were included in analyses regarding consumption. Municipalities close to national borders, with substantial cross-border trade, and specific tourist municipalities were excluded. The rationale for this is that the sales data are not considered to be a valid indicator of the consumption among the inhabitants in those municipalities. The exclusion criteria were very high sales (approximately double the median value) or very low sales (approximately half the median value) and being known as a municipality with extensive cross-border trade or tourism. Consumption and harm indicators were standardized for age and/or population size per municipality.
Table 1. Indicators of alcohol consumption and alcohol-related harm.
Certain types of alcohol-related harm, such as alcohol intoxication, are expected to respond more or less directly to changes in alcohol consumption, while a time lag is expected for more chronic outcomes, such as cirrhosis mortality. Even if the total effect is spread over a longer time period in the latter case, there is also a substantial instant impact due to the reservoir effect (Norström & Skog, Citation2001).
Analysis
When pooled cross-sectional time-series data are used for estimating the relationship between two variables (as in the present study), there are two obvious sources of bias that may distort the outcome. One is the possible presence of unobserved community differences that are linked to the dependent as well as the independent variables. The other threat to validity of results is the possibility that X and Y variables have converging (or diverging) time trends that do not reflect a causal relationship, but rather the impact of other factors. To remedy these problems, we used fixed-effects models that included municipality dummies as well as year dummies. This means that only variation over time was explored, and that time trends were controlled (Allison, 2009).
The most basic model looks as follows:
where Y is the output at issue (e.g. alcohol consumption) and APMM is the intervention index. D2–Dn are the municipality dummies, and T2–Tn are the year dummies. The parameter of interest is e, which expresses the association between APMM and the outcome, expressed as an elasticity. In the actual analyses, the model was extended by including the set of control variables (median income, unemployment, post-secondary education, and population size, see for details). Likewise, in some analyses, APMM was replaced by the five intervention categories.
Table 2. Socioeconomic characteristics among municipalities in the study and all municipalities in Sweden, 2014.
Initial analyses suggested that prevention initiatives had an instantaneous effect, as well as a lagged effect of one year (see and in the appendix). To accommodate this, we used a weighted prevention index, calculated as WAPMMit = (APMMit+APMMit-1)/2, where APMM is the prevention index.
Table 3. Prevention, consumption and harm indicators among municipalities in the study and all municipalities in Sweden, 2014.
The control variables were selected as a higher burden of alcohol-related harm is experienced in groups with low socioeconomic status and alcohol consumption is lower in poorer societies (Schmidt, Mäkelä, Rehm, & Room, Citation2010). Moreover, Swedish municipalities have differing conditions for alcohol and drug prevention. More precisely, large municipalities and municipalities with high median net income or a large proportion of highly educated people often have better conditions for alcohol and drug prevention work (Public Health Agency of Sweden, Citation2017).
Another complication with cross-sectional time series data is the likely presence of spatial (cross-unit) and serial dependence of the errors, which yields a downward bias of the OLS (Ordinary Least Square) estimates of the standard errors and thus overconfidence in the results. We therefore chose a modeling technique that: (i) accounted for the spatial dependence of the errors by applying the more conservative panel-corrected standard errors suggested by Beck and Katz (Beck & Katz,., Citation1995), and (ii) accounted for serial dependence by including panel-specific auto-regressive parameters for estimation of residual autocorrelation.
STATA 14 was used in the main analyses and the syntax command in the main analyses was xtpcse with the correlation option psar1.
Ethical considerations
This study was approved by the regional ethics committee in Stockholm, application 2010/247-31, approved revision 9 April 2015.
Results
As shown in , there were only minor socioeconomic differences between the study sample and all municipalities in Sweden. The municipalities included in the study had somewhat fewer inhabitants and marginally higher levels of income and education. The unemployment rates are almost identical.
There were few differences between the study sample and all municipalities in Sweden in terms of prevention, consumption, and harm, see . However, prevention levels (APMM points) are higher in the study sample (N = 207). Consumption is lower among municipalities in the study sample (N = 182) compared with the initial sample (N = 207), as well as with all municipalities in Sweden (N = 290). This is explained by the exclusion of municipalities with extensive cross-border trade and tourism (see method), which is also mirrored by the standard deviations for these three samples. The numbers of people treated for an explicit alcohol diagnosis are lower among municipalities included in the study.
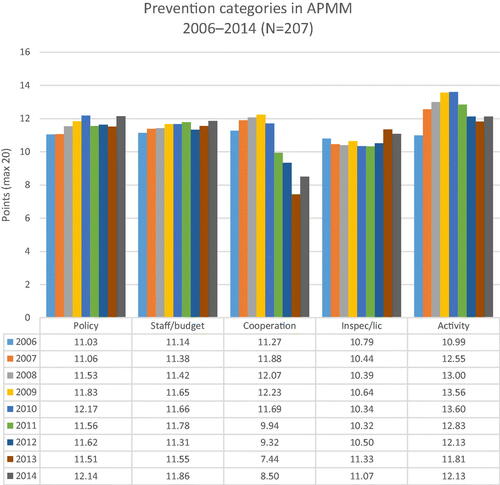
shows the trends in prevention initiatives (APMM points), alcohol consumption, and alcohol-related harm among the municipalities included in this study. The prevention initiatives, according to APMM, increased from 2006 to 2009 (+9%), thereafter decreased until 2013 (2009–2013: -10%), and increased again in 2014 (+4%). The trends in subcategories of APMM are presented in the appendix, .
Figure 1. Trends in prevention (N = 207), consumption (N = 182), and harm (N = 207) indicators among municipalities in the study, 2006–2014.
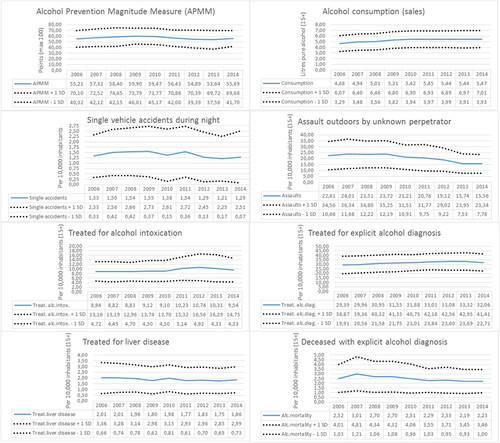
Consumption (proxied by sales) increased gradually between 2006 and 2014 (+17%), whereas the harm indicators show different trends: an increase in the number of patients treated for alcohol-related diagnoses, but a decline in alcohol-related mortality, number of patients treated for liver diseases, assaults, and single-vehicle accidents.
The estimated impact of prevention initiatives on alcohol consumption and related harm is shown in .
Table 4. Estimated prevention effects (weighted prevention index, WAPMM, direct and one-year lag prevention effect combined) on indicators of consumption and alcohol-related harm in percent, 2006–2014, controlled for population size, median income, unemployment, and post-secondary education.
As shown in , the prevention index (APMM), as well as three subcategories (policy, staff and budget, activities), had significant effects on alcohol consumption (measured through sales). APMM had stronger effects than the individual subcategories. An increase in APMM by 1% decreased the alcohol consumption by 0.02% (including the lag effect and controlling for changes in population size, median income, unemployment, and post-secondary education). The subcategory inspections and licenses showed a significant effect in the opposite direction: an increase in inspections and licenses was associated with an increase in alcohol consumption.
APMM also showed a statistically significant effect on mortality: a 1% increase in APMM was associated with a 0.26% significant decrease in alcohol-related mortality. Controlling for the potential confounding variables (population size, median income, unemployment, and post-secondary education) made no difference on the estimated effect size of APMM on mortality. Significant effects, but somewhat weaker, were also observed for inspections and licenses (-0.21%), staff and budget (-0.20%), cooperation, (-0.12%), and activities (-0.11%).
Inspections and licenses also had a statistically significant effect on the numbers of patients treated for an alcohol diagnosis (-0.05%) or liver disease (-0.22%). On the other hand, policy had a significant effect in the opposite direction on the number treated for liver diseases.
Finally, APMM (-0.36%) and three subcategories – activities (-0.18%), cooperation (-0.08%) and staff and budget (-0.10%) – had an effect on nighttime single-vehicle accidents. None of the other estimates were statistically significant.
Discussion
In this present study, we analyzed the effects of local alcohol prevention initiatives on alcohol consumption and alcohol-related harm in Swedish municipalities. A composite measure of alcohol prevention initiatives (APMM) and established measures of consumption and harm were used in the analyses. As far as we know, this study is unique. No other study has used a composite measure for monitoring local “overall” alcohol prevention initiatives over time in a majority of municipalities in a country and analyzed this in relation to the development of consumption and harm. There is, however, a composite local alcohol policy measure (focusing on underage drinking), constructed for 50 cities in California, but this has not been analyzed in relation to consumption or harm (Thomas, Paschall, Grube, Cannon, & Treffers, Citation2012). While our present study focuses on local alcohol prevention initiatives, it should also be mentioned that previous research based on US state level alcohol prevention/policy (Hadland et al., Citation2015; Naimi et al., Citation2014, Citation2018; Xuan et al., Citation2015; Xuan et al., Citation2015) has revealed that state level prevention/policy can be effective for reducing alcohol-related harm. These results are important findings as alcohol prevention/control is performed at state/provincial level in many countries. Such results are also interesting for the local prevention context, as they reveal that subnational alcohol prevention polices can be effective.
This present study is of particular relevance for Sweden, but it might also be interesting for other countries where alcohol prevention is mainly performed at the local/municipal level.
Norway, like Sweden, has invested in coordination and formation of a locally based alcohol policy/prevention structure, while Finland has established networks and partnerships (Karlsson, Citation2008). Alcohol prevention is determined partially at municipal level in Denmark as well (Sundhedsstyrelsen, Citation2018).
The main findings in our present study were that an increase in local alcohol prevention initiatives in Swedish municipalities was associated with a decrease in alcohol consumption and in alcohol-related mortality, controlled for changes in other possible explanatory variables. However, unlike mortality, most of the effect estimates on the patient outcome indicators showed no significant effect of prevention initiatives. In total, 15 out of 42 effect estimates showed significant preventive effects. Another two showed significant effects in the opposite direction (policy on treated for alcohol liver disease and inspections and licenses on alcohol consumption), whereas the remaining 25 estimates were non-significant.
The inspections and licenses category tended to be effective on several different outcome measures, although these (alcohol-related mortality, treated for liver disease, treated for alcohol diagnosis) are probably strongly linked to each other. Furthermore, the inspections and licenses category is the only one divided into levels of intensity (“prevention dosage”). Thus, this category measures level of prevention initiatives in somewhat greater detail than the other four categories.
When it comes to the unexpected effect of inspections and licenses on consumption (sales), it might be explained by increased inspections at on-licensed premises as a response to drunkenness (see intoxications, in the appendix) or other problems at licensed premises. In addition, the sales data used in the study did not include sales at these licensed premises. A tentative explanation for the positive estimate on sales may therefore be that a change in prevention initiatives at on-licensed premises affected the sales at these premises in the opposite direction, but retail sales in the same direction (as prevention initiatives). If sales are reduced on-premises (by increased prevention initiatives), they may in part be substituted by an increase in retail sales.
Table A2. Estimated prevention effects (direct effect) on indicators of consumption and alcohol-related harm in percent, for 2006–2014, controlled for population size, median income, unemployment, and post-secondary education.
Table A3. Estimated prevention effects (one-year lagged effect) on indicators of consumption and alcohol-related harm in percent, for 2006–2014, controlled for population size, median income, unemployment, and post-secondary education.
Another unexpected finding was the effect of policy on occurrence of liver disease. A possible explanation could be that a strengthening in policy is initiated after an increase in alcohol-related problems has become known and it might then take time before policy has been adopted by local decision-makers. On the other hand, policy seems to have an impact on consumption, which further complicates the interpretation. However, when analyzing direct prevention initiatives and lagged prevention initiatives effect of one year separately, no contradictory findings for policy were revealed (see in the appendix).
It should be noted that although the results indicated significant effects of prevention initiatives on alcohol consumption and harm, these effects were very small for consumption: an increase in APMM by 1% decreased consumption by 0.02% (about 0.1 centiliter pure alcohol). One possible explanation for the small effect is that significant parts of the total consumption are not included in the analyses (for example, restaurant, travel and smuggling) due to a lack of data. Patterns of consumption (quantity, frequency), which can be important for the development of harm, are also lacking. With regard to mortality, the results showed greater prevention initiative effects: a 1% increase in APMM was associated with a 0.26% significant decrease in alcohol-related mortality. This means that if APMM were to increase by 10% (about 5.5 points), alcohol-related mortality would decrease by about 2.6%. In absolute terms, 2.6% would correspond to approximately 50 people in Sweden as a whole, as 1,961 individuals died of an alcohol-related diagnosis (The National Board of Health & Welfare, Citation2018) in Sweden in 2014.
The results of this study might be important for policymakers from several different aspects. The most obvious aspect is that it is important to ensure that local alcohol prevention initiatives increase over time, as they seem to reduce consumption and harm. This requires systematic measurement and analysis of prevention initiatives, consumption and harm to get the best possible decision support for action. It is essential with thorough knowledge in the alcohol field to interpret and analyze prevention initiatives, consumption and harm to understand how they relate and what the various measurements capture or miss. Given the complexity of this topic, it may be important for policymakers to collaborate closely with experts in the alcohol field. One result that is difficult to interpret is for instance prevention initiatives versus consumption (see the results section above), where collaboration with experts might be useful for policymakers’ interpretation. In this case, it might be interpreted as local alcohol prevention initiatives seem to marginally reduce alcohol consumption measured via sales, but it is not clear if total consumption is affected as such data are missing. On the other hand, the “real” (i.e. total) consumption reduction should likely be greater (than sales), given that mortality decreases, but how large such reduction might be is impossible to determine at present.
Strengths and limitations
A strength of the research presented here is the innovative approach (mainly APMM), and the fact that it is the first time that prevention initiatives at the local level are comprehensively analyzed in relation to consumption and harm over many years among a majority of municipalities in a country. (An early and very limited version of APMM has been tested and analyzed with simple methods in relation to consumption and harm between two time points, 2002 and 2005 (The Swedish National Institute of Public Health, Citation2006).) The results presented here are important for other nations and from a public health perspective, as the efforts at local level were initiated to meet an anticipated increase in alcohol and drug problems after Sweden joined the European Union. However, a limitation of this type of research is that it is difficult to know what prevention efforts are most important (effective) and which groups are most affected. In addition, it should be pointed out that local alcohol prevention initiatives have an inbuilt limitation, namely that municipalities do not have control of one of the most effective means for reducing alcohol consumption: price.
The prevention measure (APMM) used is mainly based on dichotomous data, since information on the dosage or quality of the actual prevention initiatives is very limited. Accordingly, APMM and its subcategories should be seen as a rather rough indicator mainly reflecting the “overall” magnitude of local alcohol prevention initiatives and changes therein over time. However, it seems reasonable that the strongest effects on mortality were noted for the sum of the prevention indicators (APMM), as this reflects the overall magnitude of prevention initiatives among municipalities. APMM contains 37 indicators of prevention divided into five categories. The strongest research support for effectiveness is related to inspections and licenses, but how much more effective or important this category might be than the others is unclear, especially as the staff and budget category is the prerequisite for prevention.
The outcome measures used are standard indicators within the alcohol research field; even so, they are far from optimal (see also Nilsson et al., 2018). As an example, sales data only covers less than two thirds of the total consumption. In addition, the fact that alcohol is sold in a municipality does not make it certain that it is consumed there, especially not in areas where many inhabitants commute frequently. When it comes to health-care data, they can be affected by policy alterations in, e.g. accessibility to care, the number of inpatient beds, and diagnostic practices. This study only comprised measurements of inpatient data, as outpatient data did not have enough coverage. The number of people treated for liver disease and alcohol mortality rates are based on few numbers per municipality and therefore random variations may cause large relative changes. Measures reflecting alcohol-related violence (assaults) and alcohol in traffic (nighttime single-vehicle accidents) are both prone to underreporting and also affected by police activity and reporting propensity.
Conclusion
Measuring local alcohol prevention initiatives and their possible effects on consumption and harm is a challenge in many aspects. Different prevention efforts may affect various harm and different socio-demographic groups and there may also be delays in prevention effects. In addition, the emergence of alcohol-related harm occurs with varying time lag; some types of harm are acute, such as intoxication, while it takes several years to develop cirrhosis of the liver. It is thus difficult to interpret prevention impact on consumption and harm, especially when studying a variety of prevention efforts and several different outcomes. Still, the overall results indicated that local alcohol prevention initiatives in Sweden seemed to have reduced some forms of alcohol-related harm, not least alcohol-related mortality, during the period 2006 to 2014 in the municipalities in this study.
The results should be seen in the context of a national alcohol policy which is strong in an international comparison (Karlsson, Citation2014), in combination with local prevention efforts that have been increased in recent years. The findings should be interpreted with caution, since there are limitations in measures of both prevention activities and outcomes, and that associations found in aggregated data never can be proof of causal association.
Acknowledgements
This study was funded by the Alcohol Research Council of the Swedish Alcohol Retailing Monopoly, grant number 2014-0036.
We would like to acknowledge the Public Health Agency of Sweden for providing prevention data.
An early version of this study was presented and discussed at the 42nd Annual Alcohol Epidemiology Symposium of the Kettil Bruun Societyin Stockholm in May/June 2016. We are grateful for the comments made by the discussants regarding our draft.
A late (submitted) version of this study/manuscript was included in the thesis Local alcohol prevention in Sweden - Construction of a prevention index and assessments of prevention effects on consumption and harm at Karolinska Institutet.
Disclosure statement
The authors report no conflicts of interest.
Figure A1. Prevention categories within APMM. Average points based on 207 municipalities, 2006–2014.
References
- Allison, P. D. (2009). Fixed effects regression models. Sage Publications.
- Andréasson, S. (2002). Policy för prevention (Policy for prevention.). In S. Andréasson (Ed.), Den svenska supen i det nya Europa: Nya villkor för alkoholprevention: en kunskapsöversikt. (The Swedish drink in the new Europe: New conditions for alcohol prevention: a knowledge review) (Pages. 265–282). Stockholm: Statens folkhälsoinstitut (the Swedish National Institute of Public Health).
- Beck, N., & Katz, J. N. (1995). What to do (and not to do) with time-series cross-section data. American Political Science Review, 89(3), 634–647. doi:10.2307/2082979
- Government Offices of Sweden (2013). Uppföljning av regeringens alkohol-,narkotika-, dopnings- och tobaksstrategi. Förslag på indikatorer avseende de långsiktiga målen i strategin #2. [Follow-up of the government’s alcohol, drug, doping and tobacco strategy. Suggestions for indicators regarding the long-term goals of Strategy # 2]. Stockholm, Sweden: Author.
- Government proposition 2000/01:20 (2000). Nationell handlingsplan för att förebygga alkoholskador [National action plan to prevent alcohol harm]. Stockholm, Sweden: Author.
- Government proposition 2005/06:30 (2005). Nationella alkohol- och narkotikahandlingsplaner [National alcohol and drug action plans]. Stockholm, Sweden: Author.
- Government proposition 2010/11:47 (2010). En samlad strategi för alkohol-, narkotika-, dopnings- och tobakspolitiken [A coherent strategy for alcohol-, narcotics, doping and tobacco policy] (Proposition 2010/11:47). Stockholm, Sweden: Author.
- Government writing 2015/16:86 (2016). En samlad strategi för alkohol-, narkotika-, dopnings- och tobakspolitiken 2016 – 2020 [A coherent strategy for alcohol, drug, doping and tobacco policy 2016 - 2020). (Skr. 2015/16:86]. Social departementet (The Ministry of Health and Social Affairs). Stockholm, Sweden.
- Hadland, S. E., Xuan, Z., Blanchette, J. G., Heeren, T. C., Swahn, M. H., & Naimi, T. S. (2015). Alcohol policies and alcoholic cirrhosis mortality in the United States. Preventing Chronic Disease, 12, E177. doi:10.5888/pcd12.150200
- Hallgren, M., & Andreasson, S. (2013). The Swedish six-community alcohol and drug prevention trial: Effects on youth drinking. Drug and Alcohol Review, 32(5), 504–511. doi:10.1111/dar.12057
- Karlsson, T. (2008). Finlands, Norges och Sveriges alkoholpolitiska linjedragningar sedan “ödesåret” 2004. Nordisk Alkohol- Och Narkotikatidskrift, 25, 205–222.
- Karlsson, T. (2014). Nordic Alcohol Policy in Europe. The Adaptation of Finland’s, Sweden’s and Norway’s Alcohol Policies to A New Policy Framework, 1994–2013. Åbo Akademi. Vasa.
- Leifman, H., Ramstedt, M., & Österberg, E. (2002). Alcohol in postwar Europe a discussion of indicators on consumption an alcohol-related harm. ECAS final report.
- Leimar, P., Ramstedt, M., & Weibull, L. (2013). Public opinion and alcohol policy in Sweden 1990–2012. Nordic Studies on Alcohol and Drugs, 30(6), 473–490. doi:10.2478/nsad-2013-0046
- Naimi, T. S., Blanchette, J., Nelson, T. F., Nguyen, T., Oussayef, N., Heeren, T. C., … Xuan, Z. (2014). A new scale of the U.S. alcohol policy environment and its relationship to binge drinking. American Journal of Preventive Medicine, 46(1), 10–16. doi:10.1016/j.amepre.2013.07.015
- Naimi, T. S., Xuan, Z., Sarda, V., Hadland, S. E., Lira, M. C., Swahn, M. H., … Heeren, T. C. (2018). Association of state alcohol policies with alcohol-related motor vehicle crash fatalities among US adults. JAMA Internal Medicine, 178(7), 894. doi:10.1001/jamainternmed.2018.1406
- Nilsson, T., Allebeck, P., Leifman, H., Andreasson, S., Norström, T., & Guldbrandsson, K. (2018). Effects on Alcohol Consumption and Alcohol Related Harm of a Community-Based Prevention Intervention With National Support in Sweden. Subst Use Misuse, 53(3), 412–419. doi:10.1080/10826084.2017.1334063
- Nilsson, T., Leifman, H., & Andréasson, S. (2015). Monitoring local alcohol prevention in Sweden: Application of Alcohol Prevention Magnitude Measure (APMM). Nordic Studies on Alcohol and Drugs, 32(5), 479–494. doi:10.1515/nsad-2015-0047
- Norström, T., & Skog, O. J. (2001). Alcohol and mortality: Methodological and analytical issues in aggregate analyses. Addiction, 96(suppl. 1), S5–S17. doi:10.1080/09652140020021143
- Public Health Agency of Sweden. (2015). Länsrapport 2014 Gävleborg, kommunernas del ANDT-förebyggande (County Report 2014 Gävleborg, municipalities ANDT-prevention). Online Publication by Public Health Agency of Sweden. Solna/Östersund.
- Public Health Agency of Sweden (2017). Nationell redovisning av länsrapportsdata 2011-2016: Faktablad 4 av 4 [National presentation of county report data 2011-2016: Fact sheet 4 of 4]. Solna/Östersund.
- Ramstedt, M., Sundin, E., Landberg, J., & Raninen, J. (2014). ANDT-bruket och dess negativa konsekvenser i den svenska befolkningen 2013 (ANDT-consumption and its negative consequenses in the Swedish population 2013). Stockholm Förebygger Alkohol- Och Drogproblem, STAD (Stockholm Prevents Alcohol and Drug Problems, STAD).
- Rehm, J., & Scafato, E. (2011). Indicators of alcohol consumption and attributable harm for monitoring and surveillance in European Union countries. Addiction, 106(Suppl. 1), 4–10. doi:10.1111/j.1360-0443.2010.03323.x
- Ritter, A., Livingston, M., Chalmers, J., Berends, L., & Reuter, P. (2016). Comparative policy analysis for alcohol and drugs: Current state of the field. International Journal of Drug Policy, 31, 39–50. doi:10.1016/j.drugpo.2016.02.004
- Schmidt, L. A., Mäkelä, P., Rehm, J., & Room, R. (2010). Alcohol: Equity and social determinants. 11-30. In E. Blas & A. Sivasankara Kurup (Eds.), Equity, social determinants and public health programmes. Switzerland: World Health Organization.
- Stafström, M. (2007). Preventing adolescent alcohol use: processes and outcomes of a community-based intervention in Trelleborg. Lund University. Lund.
- Sundhedsstyrelsen (2018). Forebyggelsespakke - Alkohol. Online Publication. www.sst.dk. Sundhedsstyrelsen. Köpenhamn.
- The National Board of Health and Welfare (2018). Dödsorsaker, online databas (Statistics on causes of death, online database). Socialstyrelsen (the National Board of Health and Welfare). Stockholm.
- The Swedish National Institute of Public Health (2006). Uppföljning av den nationella handlingsplanen för att förebygga alkoholskador 2001–2005. Slutredovisning av regeringsuppdrag (Follow-up of the national action plan for prevention of alcohol reated harm 2001–2005. Final report on government assignments). Stockholm: Author.
- Thomas, S., Paschall, M. J., Grube, J. W., Cannon, C., & Treffers, R. (2012). Underage alcohol policies across 50 California cities: An assessment of best practices. Substance Abuse Treatment and Policy, 7(26), 1–14.
- World Health Organization (2000). International Guide for monitoring alcohol consumption and related harm. Geneva, Switzerland: Author
- World Health Organization (2018). Global status report on alcohol and health 2018. Geneva, Switzerland: Author.
- Xuan, Z., Blanchette, J., Nelson, T. F., Heeren, T., Oussayef, N., & Naimi, T. S. (2015). The alcohol policy environment and policy subgroups as predictors of binge drinking measures among US adults. American Journal of Public Health, 105(4), 816–822. doi:10.2105/AJPH.2014.302112
- Xuan, Z., Blanchette, J. G., Nelson, T. F., Heeren, T. C., Nguyen, T. H., & Naimi, T. S. (2015). Alcohol policies and impaired driving in the United States: Effects of driving- vs. drinking-oriented policies. The International Journal of Alcohol and Drug Research, 4(2), 119–130. doi:10.7895/ijadr.v4i2.205