
 ?Mathematical formulae have been encoded as MathML and are displayed in this HTML version using MathJax in order to improve their display. Uncheck the box to turn MathJax off. This feature requires Javascript. Click on a formula to zoom.
Abstract
The presence of antibiotic resistance genes in wastewater treatment plants (WWTPs), and in river and lake recipients show the need to develop new antibiotic removal strategies. The aminoglycoside antibiotic class is of special concern since the chemical structure of these compounds limits the choices of removal technologies. The experimental design included fungal mediated in vivo and in vitro experiments. The experiments were performed in Erlenmeyer flasks under non-sterile conditions. In the study, the role of the laccase redox mediator 4-hydroxy benzoic acid (HBA) in the removal of neomycin was investigated. The specific objective of the study was to conclude whether it is possible to use the white rot fungus (WRF) Trametes versicolor to biodegrade neomycin. It was shown that it is feasible to remove 34% neomycin in vitro (excluding living fungal cells) by laccase-HBA mediated extracellular biodegradation. In the in vivo experiments, polyurethane foam (PUF) was used as supporting material to immobilize fungal mycelia on. The presence of living fungal cells facilitated a removal of approximately 80% neomycin in the absence of HBA. Using liquid chromatography-high resolution-mass spectrometry, it was possible to tentatively identify oxidation products of neomycin hydrolysates. The results in this study open up the possibility to implement a pretreatment plant (PTP) aimed for neomycin removal.
Introduction
Antibiotic resistance in bacteria is a global issue. It is originated by the indiscriminate use of antibiotics and their waste management. Antibiotic resistance genes (ARGs) find their way into pathogenic organisms, rendering them resistant to the antibiotics.[Citation1] Antibiotics are often recalcitrant, and thus difficult to eliminate in WWTPs. Different biological wastewater treatment technologies like advanced oxidation procedures (AOP) and adsorption to sludge have been used to remove antibiotic residues.[Citation2] These techniques are focused on the removal of substances belonging to the antibiotic classes sulfonamides, tetracyclines, fluoroquinolones, macrolides and ß-lactams.
Aminoglycosides which are a class of antibiotics to which neomycin belong, are used in human applications and in veterinary medicine.[Citation3–5] They consist of aminated sugars joined in glycosidic linkages to a dibasic cyclitol.
Neomycin which is produced by Streptomyces species and discovered 1949,[Citation6] is of environmental interest since it has been detected in wastewaters.[Citation7–9] The prevalence and diversity of antibiotic resistance genes (ARGs) and among them aminoglycoside resistant genes (AMGRs) were studied by extracting DNA from bacteria in a WWTP, hospital wastewaters and in downstream aquatic environments in Sweden to determine the amounts of ARGs and AMGRs.[Citation10,Citation11] It was concluded that the hospital wastewaters and the WWTPs were reservoirs of AMGRs and that the WWTPs contribute to the diversity of AMGRs in recipient rivers and lakes. Furthermore, aminoglycoside resistant bacteria and genes have been detected in sludge samples from 18 of 23 investigated Norwegian drinking water treatment plants.[Citation12]
Neomycin is beside its use in human applications also used in veterinary medicine, and in several countries in combination with oxytetracycline as medicated feed for cattle.[Citation13,Citation14] In a recent study, the antimicrobial resistance of bacterial isolates from diseased food animals were analyzed and it was concluded that an intense usage is linked to a high resistance to aminoglycosides including neomycin.[Citation15]
Neomycin is also used in molecular genetics with emphasis on recombinant protein production using E. coli.[Citation16] A fungal mediated removal of neomycin from the latter particular wastewaters can be an interesting alternative to heat treatment procedures by which neomycin is denaturated.[Citation17,Citation18]
When it comes to abiotic processes to eliminate neomycin besides heat, photolysis can be excluded since neomycin is not light sensitive.[Citation7] Concerning AOP, the neomycin molecule, does not include double bonds and aromatic rings which are beneficial for ozone reaction.[Citation19]
The possibility to biodegrade aminoglycosides including neomycin using fungi is scarcely investigated. It is doubtful whether WRF, including Trametes versicolor (T.versicolor) can use their nonspecific extracellular ligninolytic enzymes, including laccase to biodegrade aminoglycosides due to these enzymes’ limited redox potentials. By using a laccase redox mediator in combination with laccase (laccase-mediator-system), the redox potential can be increased thereby allowing the oxidation of not only phenolic but also non-phenolic compounds.[Citation20]
There are several redox mediators that have been used in vitro in combination with laccase. Among these can be mentioned the environmentally friendly compound 4-hydroxybenzoic acid (HBA).[Citation21,Citation22] However, it is reported that HBA also acts as an antifungal agent using whole fungal cells (in vivo) by decreasing the growth of fungal mycelia.[Citation23] It has also been shown that HBA actually is biodegraded by T. versicolor (in vivo) in the presence of glucose as co-substrate.[Citation24] It thus seems as if HBA (i) can act as a laccase redox mediator (in vitro) and (ii) be biodegraded (in vivo). Furthermore (iii), HBA has the ability to scavenge hydroxyl radicals which are highly reactive and can oxidize most compounds.[Citation25,Citation26] It has been reported that T.versicolor can secrete the hydroxyl radical precursor hydrogen peroxide. One of several enzymatic sources of H2O2 is pyranose oxidase (glucose-2 oxidase) which is abundant during wood degradation by T. versicolor.[Citation27]
The combination of in vivo, in vitro experiments and redox mediators in biodegradation studies, can contribute to a better understanding of the underlying mechanisms. This has been demonstrated in the biodegradation of antibiotics belonging to the quinolone class using T.versicolor.[Citation28] In that study, the authors showed that norfloxacin and ciprofloxacin were most efficiently removed in vivo without any addition of the redox mediator 2,2′-Azino-bis-(3-ethylbenzothiazoline-6-sulfonic acid), diammonium salt (ABTS).
This degradation was inhibited by the addition of the cytochrome P450 (CYP450) inhibitor 1-aminobenzotriazole. Thus, the authors suggested that the intracellular CYP450 enzymes play a role in the degradation of these antibiotics.
The use of liquid chromatography mass spectrometry (LC-MS) in environmental sciences has increased during the last two decades. One reason is the particular use of liquid chromatography coupled to high-resolution mass spectrometry (LC-HRMS) which is currently the instrumentation of choice for identification and quantification of polar compounds in wastewater.[Citation29] However, the analysis of neomycin in a biodegradation study using LC-HRMS is troublesome since the target molecule has a positive net charge at pH levels < 11. Furthermore, this can also be valid for its biodegradation products. Either hydrophilic interaction liquid chromatography (HILIC) or ion pairing liquid chromatography (IPLC) can be used.[Citation30]
In the present study, it was investigated if it is possible to biodegrade neomycin using T. versicolor. To our knowledge, this has not been investigated before. The experimental design facilitated the determination whether an eventual biodegradation could be characterized as solely extracellular enzyme catalyzed in the absence of whole fungal cells (in vitro) or as dependent of whole fungal cells (in vivo). Furthermore, for both conditions, the influence of the laccase redox mediator HBA was investigated. Ultra high performance liquid chromatography quadrupole time-of-flight mass spectrometry (UHPLC-Q-TOF MS) was used both for targeted and non-targeted analyses. The high initial neomycin concentration (10 mg L−1) was chosen since Cytiva AB in Uppsala, Sweden works with molecular genetic processes in which these concentration levels are relevant. The final goal is to implement a fungal based pretreatment plant by which highly reduced levels of neomycin are directed to the municipal WWTP.
Material and methods
Chemicals, filters and glassware
Neomycin trisulfate hydrate with a purity of ≥98% was purchased from Sigma Aldrich, Buchs, Switzerland. Ammonium tartrate dibasic (≥98%) and D-(+)-glucose (≥99.5%) from Sigma Aldrich and sulfuric acid (95–97%; Merck Millipore, Darmstadt, Germany) were used to prepare a nutrient solution at pH 4.0. 4-Hydroxybenzoic acid with a purity of ≥99% from Merck, Darmstadt, Germany was used as redox mediator. Laccase from Trametes versicolor (≥0.5 U/mg) with EC Number: 420-150-4, 2,2′-Azino-bis (3-ethylbenzothiazoline-6-sulfonic acid) ammonium salt (10 mg tablets) from Sigma Aldrich were used with the buffer solution EMSURE® (citric acid/sodium hydroxide/hydrogen chloride, pH 4.0; Merck Millipore, to develop enzymatic assays. Acetonitrile, Optima™, LC-MS grade from Fisher Scientific, Reinach, Switzerland, water for chromatography Lichrosolv® LC-MS grade (Merck Millipore, Darmstadt, Germany) and formic acid (98–100%) from Merck Millipore were used in the UHPLC-Q-TOF MS analyses. Polyurethane foam (PUF) filter cartridges for aquariums (Pickup 200 EHEIM, Germany) were used for the immobilization of fungi. Water, purified at Cytiva AB, Uppsala, Sweden, using a Milli-Q® water system (Milli-Q Millipore 0.22 µm serial no 1550), Massachusetts, USA and tap water softened at Cytiva AB, Uppsala, Sweden was used for non-chromatographic purposes.
Glass fiber prefilters, cat. no. AP 2504700 from Merck Millipore, Burlington, USA were used to determine initial biomass weights of T. versicolor mycelia. Furthermore, 300 µL fixed insert amber vials (Agilent Technologies) were used both for calibration standards and samples. For the biodegradation experiments, 500 mL Duran® Erlenmeyer flasks with bottom-baffles from Sigma Aldrich were facilitated. The lids were equipped with air-permeable membranes.
Fungus and cultivation
T.versicolor (strain AG 1383) was donated from Culture Collection of Basidiomycetes (CCBAS, Institute of Microbiology, Academy of Sciences of the Czech Republic, Prague). The transport of mycelia grown on malt agar to Sweden was conducted at refrigerated conditions (2–8 °C). Thereafter, T. versicolor was grown on petri dishes with extracted malt agar from the Swedish National Veterinary Institute, Uppsala, Sweden. The petri dishes were kept under dark conditions by wrapping with aluminum foil for one week and then storing in a refrigerator. This sub-culturing procedure was performed every second month.[Citation31]
Instrumentation
An Edmund Bühler KS10 shaking table from Tübingen, Germany was used to stir the Erlenmeyer flasks (E-flasks). A Termaks, TS 9053 drying oven from Bergen, Norway was used to dry mycelia containing agar plugs.
An Agilent Technologies 6550 iFunnel Q-TOF LC/MS system (Agilent Technologies, Santa Clara, CA, USA), including an Agilent Technologies 1290 Infinity UHPLC system consisting of a 1260 iso pump (G1310B), 1290 binary pump (G4220A), thermostat (G1330B), 1290 sampler (G4226A), 1290 thermostated column compartment (G1316C), and electrospray ionization (ESI) system, was used for qualitative and quantitative analysis. Agilent MassHunter software (v. 06.00) was facilitated for instrument control, data acquisition and processing.
For separation purposes, a zwitterionic UHPLC column (SeQuant® ZIC®-cHILIC, 100 × 2.1 mm, 100 Å, 30 µm, Merck, Germany) was used. Solid Phase Extraction (SPE) was performed with Isolute® C18 (EC) 100 mg 1 mL SPE columns, Uppsala, Sweden. The enzymatic assay was performed on a double beam Cary UV-VIS spectrophotometer 4000 (Varian Medicinal Systems, Palo Alto, CA, USA).
Preparation and composition of nutrient solution
Sulfuric acid (0.1 M) was added under stirring to a 1,000 mL measuring flask containing 6.1 g D-glucose, 3.3 g ammonium tartrate, and 900 mL softened tap water to adjust pH to 4.0 (determined with a pH meter, Mettler Toledo Steven Compact ID 12-137, Greifensee, Switzerland). Softened tap water was then added to a final volume of 1,000 mL. The concentrations were 6.1 g L−1 D-glucose and 3.3 g L−1 ammonium tartrate respectively. The pH was selected with the aim of suppressing bacterial growth. The carbon-to-nitrogen ratio (C:N ratio) was 6.5.
Biodegradation study
The biodegradation study included four experimental conditions and two controls. The experiments comprised EC1, ECM1, EC2 and ECM2. The controls were composed of CC (carrier control) and HKC (heat killed control). EC1 and ECM1 included whole fungal cells immobilized on PUF (in vivo), and EC2 and ECM2 excluded the fungal cells by a decanting procedure (in vitro) by which the immobilized mycelia were separated from the broth that was used. The capital M shows the presence of the mediator HBA. By fungal immobilization, the contamination of collected samples by freely dispersed mycelia is avoided. Furthermore, it has been proposed that the bacterial growth is suppressed and that the enzyme production is enhanced.[Citation32,Citation33]
Six 500 mL E-flasks were initially prepared for biodegradation experiments. 2.7 g PUF in centimeter-sized cubes were added to all the flasks. To each flask, 300 mL nutrient solution was poured. The flasks were then autoclaved at 125 °C for 30 minutes using a Certoclav CV-EL 12 L autoclave from Leonding, Austria to have comparable experimental starting conditions and limit the bacterial growth. To all the flasks except for carrier control (CC), 15 mycelia covered agar plugs were inoculated using a hollow punch and pincette washed with 70% ethanol. All flasks were agitated (50 rpm) at room temperature and protected from light by aluminum foil. After 12 days inoculation/immobilization, the heat killed control (HKC) was autoclaved once more. HKC was aimed for monitoring biosorption to dead T.versicolor. Then neomycin was added under stirring to all flasks (including CC) to reach a final concentration of 10 mg L−1. Two of the flasks were decanted (removal of immobilized fungal mycelia) (EC2 and ECM2). To ECM1 and ECM2, HBA (mediator) was added under stirring to reach a final concentration of 1 mM.[Citation34] The flasks were then subjected to biodegradation experiments that lasted for 168 h. The flasks were covered with aluminum foil and agitated (50 rpm). One mL samples were taken at 0, 1, 2, 4, 6, 8, 24, 30, 48, 72, 96, 120, 144 and 168 h. 250 µL of each sample was used immediately for laccase enzyme assay. The remaining volume was frozen and thereafter used for UHPLC-Q-TOF MS analyses. A replication of EC1 (in vivo experiment excluding HBA) was done in triplicate using three different fungal cultures and by prolonging the time course by fractionating also at 192, 214 and 240 h. It was motivated by the wish to examine the between-day repeatability of the most promising EC1 experiment.
Kinetics
Free radical processes are present in the extracellular degradation of chemicals using white rot fungi. These processes often follow pseudo-first order kinetics.[Citation35] They are second order reactions which are approximated as first order kinetics. See EquationEqs. (1)(1)
(1) and (2)
(1)
(1)
(2)
(2) where Ct is the concentration at time t. k’ is the degradation rate constant and C0 is the initial concentration. B0 is the initial concentration of a second component in excess (B0 ≈ Bt) and k is the degradation rate constant in the second order reaction. In a biodegradation study, the nutrients are often present in excess (component B).
When the target substance is present at a high concentration level, the reaction can obey zero order kinetics.[Citation36] See EquationEq. (3)(3)
(3) . The reaction rate is thus independent of the target compound concentration level. Zero-order reactions are only applicable for a narrow region of time. After this time period, other kinetic models are better applicable.
(3)
(3)
Enzymatic assay
The enzymatic laccase assay was used to study the enzymatic activity of the fungi during the 168 h time course. Km and Vmax have been determined to 12.8 µM and of 8,125.4 U mg−1 respectively for the substrate ABTS using a purified laccase enzyme from T. versicolor (strain 951022).[Citation37] In the developed enzyme assay, a previously published protocol was used.[Citation31] According to this protocol, the temperature was maintained at ambient conditions (approximately 23 °C). The absorbance that was used to determine enzymatic activity was measured at 420 nm (ϵ420 = 36,000 M−1 cm−1). The pH was 4.0 and the ABTS concentration was 0.4 mM. Quartz cuvettes with 3 mL volumes were used for measurements. The activity was expressed as substrate conversion rate (U mL−1), where 1 U corresponds to the amount of enzyme, which oxidizes 1 nmol ABTS per minute. The reaction velocity was obtained from the linear part of the curve.
Solid phase extraction (SPE)
Prior to UHPLC-Q-TOF MS analyses, collected fractions from the biodegradation experiments were purified from lipids originating from the immobilized mycelia.[Citation38] The SPE columns were first activated with 1.0 mL of acetonitrile and then equilibrated with 1.0 mL nutrient solution. 300 μL collected samples were then loaded onto the SPE-columns twice and the non-retarded components were collected. This procedure was facilitated by application of a pressure from a Pasteur pipette rubber bulb. The cleaned samples were then stored in 300 µL amber vials. The SPE recovery was investigated by preparing two samples, containing neomycin at concentrations of 2.5 and 9.0 mg L−1 (dissolved in nutrient solution) followed by SPE and analyzing them by triplicate injections. The mean recovery was calculated to 92 and 95% (n = 3) respectively.
Determination of initial dry weight of biomass and initial C:BM ratio
It was decided to weigh the cultivated biomass of T.versicolor after storage in refrigerator for two weeks (see Fungus and cultivation). The weight of the biomass (BM) was then used in the calculation of initial carbon:biomass ratio (C:BM ratio).
Fifteen agar plugs covered with mycelia were removed from two petri dishes using a 10 mm (inner diameter) punch. They were placed on a Millipore filter which was set in a drying oven for 20 minutes at 105 °C. Agar melts at approximately 85 °C, and the glass filter aimed to absorb it, makes it possible to collect solely the dried mycelium in each plug.
The concept “initial C:BM ratio” was used to simply describe under what initial nutritional conditions the experiments were conducted excluding the growth of the immobilized fungal mycelia.
The mean initial weight of the biomass on each agar plug before inoculation was 2.6 mg +/− 4.8% (n = 15). Since 15 agar plugs were used in the inoculation procedure, the total biomass was 39 mg. The nutrient solution derived carbon content in each 300 mL E-flask was 959 mg. The carbon content which originated from neomycin at a concentration of 10 mg L−1 was approximately one mg. The initial C:BM ratio was thus approximately 25.
Investigation of in-source fragmentation
The in-source fragmentation investigation was aimed to determine whether detected hydrolysis products were caused by biodegradation or if they were formed by this electrospray ionization phenomenon. In-source fragmentation for substances that were available as standards were investigated with the SeQuant ZIC-cHILIC column using the same running conditions that were developed for neomycin quantification purposes (see Quantitative analysis of neomycin). SEC-analyses were performed to verify in-source fragmentation for substances that were not available as standards. An Acquity UPLC® Protein BEH SEC column with a porosity of 130 Å was used. Mobile phase A consisted of 2 mM ammonium acetate in Lichrosolv water including 1% formic acid. Mobile phase B consisted of acetonitrile. The run was performed isocratically with 90% A and a flow rate of 0.3 mL min−1. The injection volume and column temperature were 15 μL and 25 °C respectively.
Quantitative analysis of neomycin and its removal
The analyses were performed using external standards. These consisted of neomycin dissolved in solely nutrient solution to 1.0, 1.5, 2.0, 4.0, 6.0, 8.0 and 10.0 mg L−1. The zwitterionic SeQuant ZIC-cHILIC column was thermostated at 60 °C. The mobile phases consisted of A; acetonitrile: Lichrosolv water (5:95) with 0.1% formic acid and B; acetonitrile: Lichrosolv water (95:5) with 0.1% formic acid. Initially, 100% B was maintained isocratically for one minute. Thereafter, mobile phase B decreased to 5% while mobile phase A increased to 95% at a time period of 1.5 minutes. This composition was held for 4.5 minutes. Thereafter, the column was equilibrated to 100% B during a time period of 0.5 minutes. This composition was held to the end of the run (18 minutes). The flow rate was 0.3 mL min−1 and the injection volume was 15 µL. Using this gradient, it was possible to inject samples that excluded acetonitrile (fractionated samples).
The MS settings were: capillary voltage 3.5 kV, gas temperature 200 °C, sheath gas temperature 350 °C, sheath gas flow 11 L min−1 and a nozzle voltage of 1.0 kV. MS data were acquired in the m/z range 100–1700. The ESI ionization was performed in positive mode and the instrument was tuned and calibrated every day prior to use. The calibration standards were co-analyzed together with SPE-worked up samples and pure nutrition solution (blanks) in each sample sequence. The proton neomycin adduct at m/z 615.3201 (exact mass) was used in the quantification. The reference mass ions which were used for internal mass calibration (lock masses) were m/z 121.0509 and 922.0098. Two QC samples with the concentrations 0.5 and 5 mg L−1 were prepared and analyzed within-day for accuracy calculation purposes. The accuracies were determined to 90% and 97% (n = 3), respectively. The linearity (r, i.e., the Pearson product-moment correlation coefficient) of 0.9997 was determined using triplicate injections of the calibration standards.
The neomycin removal R (%) was calculated according to EquationEq. (4)(4)
(4) .
(4)
(4)
where Ct is the measured neomycin concentration at time t and C0 is the initial neomycin concentration (10 mg L−1).
Qualitative analysis of biodegradation products
Molecular formulas of possible oxidation products of neosamine, 2-DOS, D-Ribose, neobiosamine and neamine (see ) including ketones, aldehydes and acids were added to a PCDL-database which was integrated in the MassHunter software. Also, a number of compounds, previously identified as fungal secondary metabolites were added to the database. After a finalized run, the database was searched and compounds were preliminarily identified, based on mass errors, isotopic abundances, and spacings. Ions with mass errors and scores of <2.5 ppm and >80% respectively, were considered. An alternative approach was to search in the TIC-chromatograms for ions that were missing from the blanks. The “Generate Formula from Peak Spectra” algorithm was used and the ions with mass errors and scores of <2.5 ppm and >80%, respectively, were further evaluated using the software ChemSpider.[Citation39]
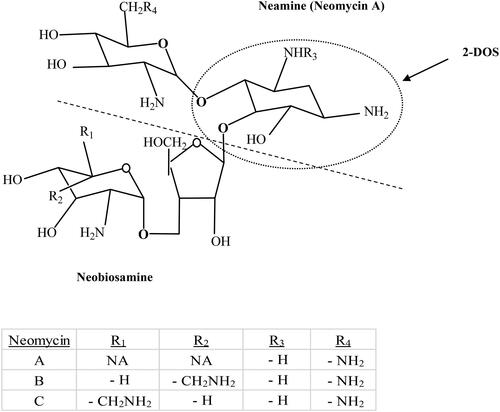
Figure 1. Chemical structures of neomycin B and C, neamine (neomycin A), neobiosamine (divided by dotted line) and di-substituated 2-deoxy streptamine (2-DOS). NA means not applicable.
Statistical analysis
In , the calculations of the accurate and exact masses in MS were facilitated by the use of Agilent MassHunter software (v. 06.00). Furthermore, using this software, elemental compositions were suggested for detected ions. Descriptive statistics including determinations of mean values, standard deviations, coefficient of variations (CV) and un-paired t-test were performed using Excel, Microsoft Office Version 2110. Excel was also used for regression analysis purposes to construct least square fitted (i) calibration curves and (ii) kinetic models. The Pearson product-moment correlation coefficient (r) was used to determine linearity.
Results and discussion
Neomycin is a mixture of neomycin B and C. In , the chemical structures of them are shown, including the di-substituted cyclitol 2-deoxy streptamine (2-DOS). Neomycin B (framycetin) is often present in greater abundance. Hydrolysis of neomycin B and C yield neomycin A (neamine) and neobiosamine B and C respectively.[Citation40] The pKa of neomycin is 12.9 at 25 °C.[Citation41]
Characterization
The protonated neomycin molecule ([M + H]+) had a mass to charge ratio (m/z) of 615.3206 (mass error −0.8 ppm (−0.5 mDa)), and the doubly charged molecule ([M + 2H]2+) had an m/z value of 308.1652. It was decided to use the singly charged protonated neomycin molecule in the quantifications, mainly since the asymmetry factor of the peak was lower.
It was investigated whether the ions at m/z 161.0925 and 455.2357 (see ) were originated by in-source fragmentation of the neomycin molecule (see ). The identities of these ions were tentatively determined to be neosamine B/C, [M + H-H2O]+ (m/z 161.0925) and ribostamycin, [M + H]+ (m/z 455.2357), (see ). The exact neosamine B or C m/z for this ion is 161.0926. The calculated mass error is thus 0.6 ppm. For ribostamycin, the exact mass of the protonated molecule is 455.2353 and the mass error was calculated to −0.9 ppm.
Figure 2. Full scan spectrum of neomycin calibration standard at a concentration of 10 mgL−1.
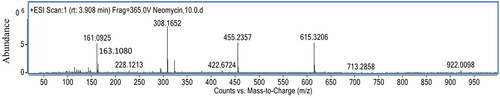
Figure 3. Chemical structures of abundant neosamine B (a) and ribostamycin (b) ions.
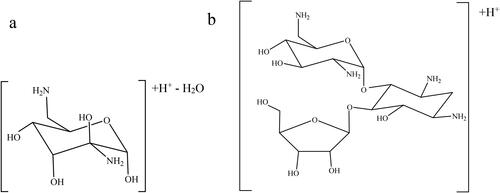
A standard of ribostamycin was dissolved in nutrient solution to 10 mg L−1, mixed 1:1 with a neomycin 10 mg L−1 standard and injected. Two chromatographic peaks could be seen at the retention times (tR) of 3.7 and 3.9 min. respectively. Their spectra revealed identical ions (m/z 455.2352). Thus, the ion which is seen in the neomycin calibration standard spectrum in at tR 3.9 min, originates from ion source fragmentation. A standard neomycin 10 mg L−1 solution was injected on a size exclusion column (Acquity UPLC® Protein BEH SEC) with a pore size of 125 Å. The spectrum of the neomycin peak in the SEC chromatogram at tR 3.6 min. was more or less identical with the spectrum in , including the m/z 161.0925 ion. Thus, it was proven that also this ion at least partly is originated by the in-source fragmentation of neomycin. Another ion that was present in the SEC neomycin peak spectrum at tR 3.6 min, was m/z 163.1080. This ion matches the proton adduct ion of 2-DOS well. The exact mass of this ion is 163.1083 and the mass error is 1.8 ppm. The origin of this ion in investigated samples, can thus also at least partly be explained by in-source fragmentation. The ion at m/z 163.1080 can be seen in .
It was investigated whether a milder ionization could affect the in-source fragmentation. The sheath gas temperature was lowered to 100 °C and the nozzle voltage was turned off. However, the abundance of the neosamine and ribostamycin ions were not affected.
Biodegradation study
In , the time course decline of neomycin is shown. Although it cannot be excluded that minor amounts of non-immobilized mycelia were present in EC2 and ECM2, the broths were clear without any visual trace of mycelia.
Figure 4. Time course decline of neomycin. Neomycin added at 10 mg L−1. Symbols: EC1 (■), HKC (◊), ECM1 (^), EC2 (▲), ECM2 (Х), CC (+).
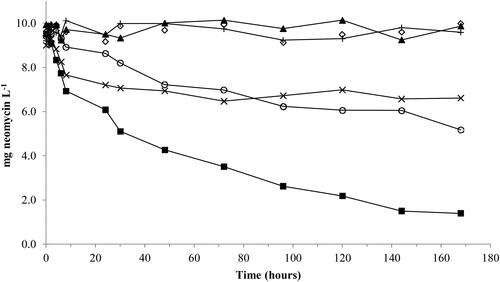
The final percentage neomycin removal R (%) after 168 hours was 0.1% (HKC), 4.1% (CC), 86.0% (EC1), 48.2% (ECM1), 1.3% (EC2) and 33.9% (ECM2).
Some conclusions can be drawn from these results. First of all, neomycin is not adsorbed to PUF (measured by CC). No biosorption to dead biomass is shown (HKC).
The in vitro experiments (EC2 and ECM2) show that the presence of the HBA mediator (ECM2) leads to a neomycin removal of approximately 34%. The in vivo experiment (EC1) shows a removal degree of approximately 85% without HBA, which is considerably higher than for the ECM1 experiment to which HBA was added (48% approximate removal).
One reason behind the inhibition in ECM1 can be the hydroxyl radical scavenging ability of HBA which prevents a radical mediated neomycin degradation. It has previously been shown that intracellular CYP 450 enzymes are secreted by T.versicolor mycelia. In a study performed by Prieto et al., it was shown that antibiotics belonging to the quinolone class were effectively removed in vivo. By adding the CYP 450 inhibitor 1-aminobenzotriazole, the degradation was inhibited.[Citation28] The decline of the neomycin removal in ECM1 cannot be easily explained by inhibition of the intracellular CYP 450 since HBA is not reported as an inhibitor of these isoenzymes. In , the kinetic parameters of degradation in EC1, ECM1 and ECM2 are presented. The table also includes a replication of EC1. The biodegradation patterns in the experiments motivated the use of both zero-order and pseudo-first order kinetics.
Table 1. Summary of kinetic parameters of degradation of neomycin using different experimental conditions.
During the first eight hours of the time course, the EC1 neomycin decline was linear with a correlation coefficient (r) of 0.9798, and thus obeys zero order kinetics. From 24 to 168 h, the EC1 neomycin decline was best explained by pseudo-first order kinetics according to EquationEq. (1)(1)
(1) , with a correlation coefficient of 0.9939.
The findings can be explained by Michaelis Menten kinetics. At start, [S] >Km where [S] is the neomycin concentration. At approximately 24 hours, [S] < Km which means that the rate and the neomycin concentration are directly proportional to each other. It must be pointed out that Km in this particular case is not known since enzymes which may catalyze the biodegradation are not identified. However, it is not understood why such an enzymatic mediated degradation should be inhibited by HBA in ECM1. Interestingly, zero and first order kinetics have been reported in the biodegradation of dyes in Fenton processes (excluding fungi).[Citation42] In these processes, reactive oxygen species (ROS) and Fe2+ and Fe3+ are present. The water that was used in the present investigation contained 10−5 M Fe, (determined by ICP-SFMS).
For ECM1 and ECM2 (including mediator), the moderate neomycin decline in ECM1 (see ) can be explained by zero order (r = 0.9635), but is better fitted by first order kinetics with a correlation coefficient of 0.9766. The neomycin decline in ECM2 is characterized by an initial steep decrease (similar to EC1) in the first eight hours. The decline in this initial time period is less well defined by zero order (r = 0.9130) and pseudo-first order kinetics (r = 0.9129). The degradation of neomycin in ECM2 is at least partly caused by the extracellular laccase-HBA mediator system.
The laccase assay showed initial differences in the enzymatic activities for the four experiments (see ). The initial laccase activity for the in vitro experiment EC2, in which HBA was excluded was higher than in the two in vivo experiments EC1 and ECM1. It is explained by differences in sample matrices. The in vitro experiments excluded mycelia and PUF. It is previously known that laccases adsorb to cellulose surfaces at acidic conditions.[Citation43] The mycelia cell walls contain the aminosaccharide chitine which is like cellulose, based on glucose monomers. The lower enzymatic activity of ECM2 (in vitro experiment including HBA) is explained by the presence of HBA. Laccase oxidizes HBA in a cyclic process,[Citation44] and is thus only partly present in its oxidized form. This leads to decreased activity levels in the laccase assay, since the substrate ABTS, is to a lesser extent oxidized.
Figure 5. Laccase enzymatic activities during the 168 h time course. Symbols: EC1 (■), ECM1 (^), EC2 (▲) and ECM2 (Х).
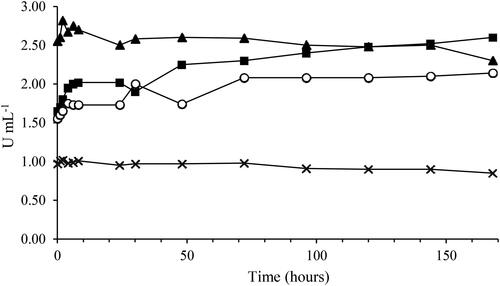
The laccase enzymatic activities in the in vivo experiments increased from 1.6–2.1 U mL−1 (ECM1) and from 1.6–2.6 U mL−1 (EC1). It is explained by an enhanced secretion of laccase from the immobilized fungi. The increased enzymatic activity in ECM1 emphasizes that HBA is not toxic to the fungus itself. The more or less stable in vitro enzymatic activities (EC2 and ECM2) during the time course are explained by the absence of continuous enzyme secretion. It is important to remember that the laccase assay results only add information about this particular enzymés activities in the four experiments and that the neomycin degradation in the in vivo experiments cannot be correlated to the assay results.
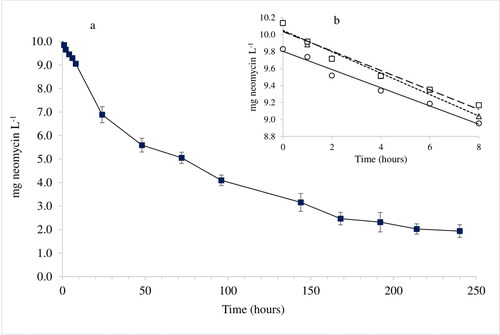
A replication of the experiment which included the most efficient removal design (EC1 experiment) from the biodegradation study was performed in triplicate (including three different immobilized fungal cultures) in which the conditions were the same, that is in vivo, with an initial neomycin concentration of 10 mg L−1 but with a prolonged time course.
The mean removal (R %) at 240 h was calculated to 81% (SD 3.3) using EquationEq. (4)(4)
(4) , which can be compared with 86% at 168 h in the initial EC1 experiment. As can be seen in , approximately the same initial decline pattern as in was present (zero order kinetics). The declines for the remaining time course also corresponded well with the results in , that is pseudo-first order kinetics. The three decline curves did not show any significant differences between each other at a 95% confidence level using two-tailed un-paired t-tests. The critical t-value was 2.0485 and P (T< = t) for the three combinations (EC1(1) & EC1(2), EC1(1) & EC1(3) and EC1(2) & EC2 (3) were 0.7355, 0.9201 and 0.8206 respectively. When the kinetic parameters from these replicate runs are compared with the previous EC1 run (see ), the half-life times are longer in the replicate runs (the half-life time is the time required for neomycin to decrease to one-half its initial value). It is explained by the use of mycelia that were cultivated at different occasions (see Fungus and cultivation). The mycelia that were used in the replicate investigation originated from an unique cultivation.
Figure 6. Time course decline of neomycin using EC1 experimental conditions 0–240 h (a) and initial part, 0–8 h (b). The experiment was performed in triplicate. Symbols: ■ shows mean results at each sampling occasion including standard deviation (SD) error bars. The symbols □, ^ and Δ show initial individual results.
Mechanisms
The biodegradation investigation proved that the neomycin decline in the in vitro experiment which included the mediator HBA (ECM2) was catalyzed by a laccase-HBA system (whole fungal cells not present). In the absence of HBA, no neomycin decline occurred. The highest removal degree (>80%) was present in the in vivo EC1 experiment excluding HBA. The most plausible explanations to the neomycin removal in the in vivo experiment EC1 are (i) extracellularly, (ii) intracellularly enzymatic catalyzed or (iii) ROS mediated degradation mechanisms. ROS are shortlived, highly reactive and origin from H2O2 which is produced by WRF species.[Citation45] They include the hydroxyl radical (•OH). One route of production of •OH in biological systems is the Fenton reaction.
The degradation and oxidation of cellulose by •OH to the gluconic acid lactone is described by Hammel et al.[Citation46]
The most plausible explanation to a neomycin removal in the in vitro ECM2 experiment is the laccase-HBA system with a higher redox potential than laccase itself. No influence from ROS or intracellularly enzymatic catalysis can be considered since living fungal cells were absent.
In the EC1 experiment, the neomycin removal could be characterized by zero and pseudo-first order kinetics. The declined removal degree (48%) in the in vivo experiment ECM1 which included HBA can be explained by the hydroxyl radical scavenging ability of HBA.
Some oxidation product ions, could be tentatively identified by their mass to charge ratios. See and . As previously mentioned, in the chapter “Characterization,” it cannot be excluded that at least partly, neosamine can be formed by other mechanisms than in-source fragmentation, provided that the retention time of this compound coincide with the retention time of neomycin. All other substances in (including structures B-E), eluted at tR < 3.9 min (neomycin). The acids (E) are most certainly not the end product, but intermediates in the catalysis of neomycin. The tentative identities of the oxidation products were determined in MS-mode, excluding isomer elucidations. Due to the low abundances of the ions, fragmentation using MS/MS was not applicable. In , the retention times, accurate and exact masses, ion species and mass errors are shown. The arrows in and indicate extracellular/intracellular enzymatic or reactive oxygen species (ROS) reactions including hydroxyl radicals which are responsible for (i) the hydrolysis of neomycin, and (ii) the following oxidation reactions. For the in vitro experiment ECM2, it was proven that these reactions are influenced by HBA-modified laccase since the structures were not present in the EC2 in vitro experiment in which HBA was excluded. Some of the structures may exist as open-chain structures (marked with *) in . It must be emphasized that the tentatively identified structures in and probably only represents some of the biodegradation products that are formed during the time course of the experiment. The oxidation products in were abundant in EC1 and ECM2.
Figure 7. Proposed biodegradation pattern of neomycin, where B-E show possible structural isomers of oxidation products of neosamine C (A). The tentative identities of the oxidation products (excluding isomer elucidation) could be verified by UHPLC-Q-TOF MS analyses. The *-sign indicates possible additional open-chain structures. Extracted ion chromatograms (EC1, 144 h) at m/z 157.0613 (C and D) and at m/z 175.0716 (E).
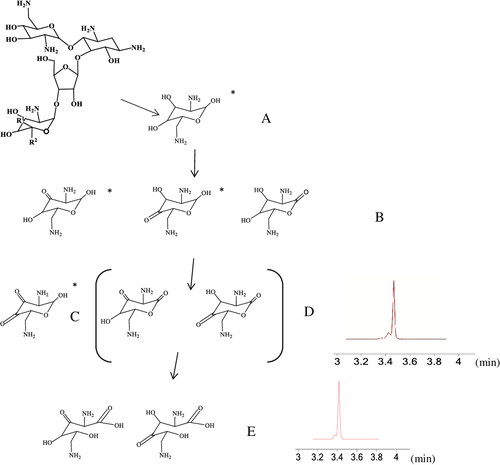
Figure 8. Proposed biodegradation pattern of neomycin, where G and H show possible structural isomers of oxidation products of 2-DOS (F). The tentative identities of the oxidation products (excluding isomer elucidation) could be verified by UHPLC-Q-TOF MS analyses.
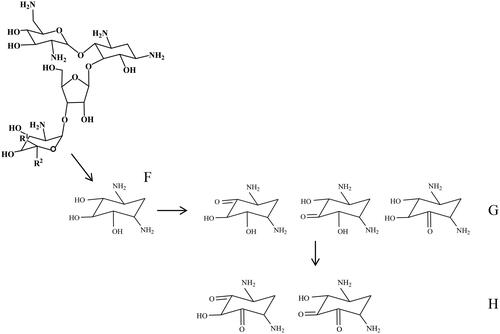
Table 2. Summary of the accurate mass measurements of hydrolysis and oxidation products of neomycin, as determined for their abundant adduct ions using UHPLC-Q-TOF MS.
In contrast to the oxidation products in , the products in , were abundant not only in EC1 and ECM2, but also in EC2 and ECM1. In the in vitro experiment EC2, no neomycin removal was observed. In the in vivo experiment ECM1, 48% neomycin was removed. The oxidation products in , are thus not correlated with the neomycin removal since they were present also in EC2.
A summary of the accurate mass measurements on the ions that were detected in full scan mode is shown in . The retention times for the oxidation products, are shorter compared with neomycin at tR 3.9 min. It is explained by the fact that these molecules include keto and carboxylic groups which are less polar than molecules that contain -OH moieties, and therefore should be less retained on the SeQuant® ZIC®-cHILIC column.
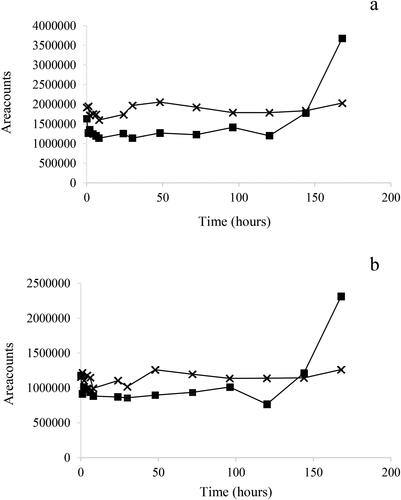
The time course of the oxidation products D and E are shown in . The time from the addition of neomycin to the first sampling was approximately 15 minutes. Interestingly, oxidation products D at m/z 157.0163 and oxidation product E, at m/z 175.0716 which are derived from neosamine, were only present in EC1 and ECM2 (see ). They could neither be detected in CC, nor in HKC. During the end of the time course, the concentrations increased in the fungal culture (EC1), while in the in vivo experiment ECM2, the levels were more or less constant. The increase of compounds D and E at the end of the EC1 experiment is explained by the presence of living fungal cells that secrete enzymes or by ROS. The stable concentration of the oxidation products, belonging to ECM2 can be explained by steady-state Michaeli-Menten kinetics.[Citation47] The presence of compounds D and E in the in vivo EC1 and in the in vitro ECM2 experiments indicate a similar degradation pattern although the experimental conditions were different.
Figure 9. Time course of oxidation product D at m/z 157.0613 (a) and oxidation product E at m/z 175.0716 (b). Symbols: EC1 (■) and ECM2 (Х).
Concerning the oxidation products F-H (derived from 2-DOS) at m/z 163.1080, 161.0923 and 141.0664, they were present in all experiments (in vivo and in vitro). As previously mentioned in the chapter “Characterization,” compound F (2-DOS), was also abundant in the neomycin calibration standards at the same retention time as neomycin (3.9 min.) which shows that 2-DOS is either an impurity, a hydrolysis product or an in-source fragment.
Conclusions
Under the used experimental conditions, including an approximate initial C:BM ratio of 25, it was possible to remove approximately 80% of neomycin using PUF-immobilized T. versicolor (in vivo). The biodegradation can be explained by extracellular/intracellular enzymatic or ROS activities in which the oxidation of the hydrolysis product neosamine play a role. The removal was inhibited (in vivo) by the redox mediator HBA, leading to a 48% removal degree. The inhibition can be explained by the ability of HBA to scavenge hydroxyl radicals that can participate in the in vivo biodegradation. In vitro experiments revealed that it was possible to remove 34% of neomycin in a laccase-HBA mediated process while in the absence of HBA, no removal could be detected. Oxidation products of neosamine were present in the in vitro experiment which contained HBA while they were lacking in the experiment that was performed without HBA. No correlation between identified 2-DOS oxidation products and neomycin decline could be seen. Although the study showed that it may be possible to biodegrade neomycin in vitro in a larger scale, and that a laccase-HBA system could be used, the best choice would be to use immobilized whole fungal cells. The reason is (i) that the removal degree is higher and (ii) the process would be more economically sustainable since no addition of laccase and HBA would be necessary.
Figure Caption ok
Acknowledgements
The authors would like to thank Martina Degerman, MSc at Cytiva AB, Uppsala, Sweden, for her skillful technical assistance.
The authors are also grateful to Ivana Eichlerová, PhD at the Institute of Microbiology, Academy of Sciences of the Czech Republic in Prague for supplying the T. versicolor.
Availability of data and materials
The data that support the findings of this study are available from the corresponding author at reasonable request.
Disclosure statement
No potential conflict of interest was reported by the authors.
Funding
This research received no specific grant from any funding agency in the public, commercial or not-for-profit sectors.
References
- Stanton, I. C.; Bethel, A.; Leonard, A.; Gaze, W. H.; Garside, R. What is the Research Evidence for Antibiotic Resistance Exposure and Transmission to Humans from the Environment? A Systematic Map Protocol. Environ. Evid. 2020, 9, 1–8. DOI: https://doi.org/10.1186/s13750-020-00197-6.
- Zhu, T. T.; Su, Z. X.; Lai, W. X.; Zhang, Y. B.; Liu, Y. W. Insights into the Fate and Removal of Antibiotics and Antibiotic Resistance Genes Using Biological Wastewater Treatment Technology. Sci. Total. Environ. 2021, 776, 145906–145915. DOI: https://doi.org/10.1016/j.scitotenv.2021.145906.
- Löffler, D.; Ternes, T. A. Analytical Method for the Determination of the Aminoglycoside Gentamicin in Hospital Wastewater via Liquid Chromatography-Electrospray-Tandem Mass Spectrometry. J. Chromatogr. A. 2003, 1000, 583–588. DOI: https://doi.org/10.1016/S0021-9673(03)00059-1.
- Liu, Y.; Yang, Y.; Cao, Y.; Qiu, J.; Kong, J.; Zhng, L.; Guo, Y.; Mingchuan, Z.; Cao, X.; Zhang, S. Pharmacokinetics of Neomycin Sulfate after Intravenous and Oral Administrations in Swine. J. Vet. Pharmacol. Ther. 2021, 44, 850–853. DOI: https://doi.org/10.1111/jvp.12981.
- Mingeot-Leclercq, M. P.; Glupczynski, Y.; Tulkens, P. M. Aminoglycosides: Activity and Resistance. Antimicrob. Agents Chemother. 1999, 43, 727–737. DOI: https://doi.org/10.1128/AAC.43.4.727.
- Waksman, S. A.; Lechevalier, H. A.; Harris, D. A. Neomycin-Production and Antibiotic Properties. J. Clin. Invest. 1949, 28, 934–1939. DOI: https://doi.org/10.1172/JCI102182.
- Kümmerer, K. Antibiotics in the Aquatic Environment - A Review-Part I. Chemosphere. 2009, 75, 417–434. DOI: https://doi.org/10.1016/j.chemosphere.2008.11.086.
- Subbiah, M.; Mitchell, S. M.; Ullman, J. L. β-lactams and Florfenicol Antibiotics Remain Bioactive in Soils While Ciprofloxacin, Neomycin, and Tetracycline Are Neutralized. Appl. Environ. Microbiol. 2011, 77, 7255–7260. DOI: https://doi.org/10.1128/AEM.05352-11.
- Tahrani, L.; Van Loco, J.; Mansour, H. B. Occurrence of Antibiotics in Pharmaceutical Industrial Wastewater, Wastewater Treatment Plant and Sea Waters in Tunisia. J. Water Health. 2016, 14, 208–213. DOI: https://doi.org/10.2166/wh.2015.224.
- Börjesson, S.; Dienues, O.; Jarnheimer, P. Å.; Olsen, B.; Matussek, A.; Lindgren, P. E. Quantification of Genes Encoding Resistance to Aminoglycosides, Beta-Lactams and Tetracyclines in Wastewater Environments by Real-Time PCR. Int. J. Environ. Health Res. 2009, 19, 219–230. DOI: https://doi.org/10.1080/09603120802449593.
- Khan, A. K.; Söderquist, B.; Jass, J. Prevalence and Diversity of Antibiotic Resistance Genes in Swedish Aquatic Environments Impacted by Household and Hospital Wastewater. Front. Microbiol. 2019, 10, 1–12. DOI: https://doi.org/10.3389/fmicb.2019.00688.
- Ullmann, I. F.; Tunsjø, H. S.; Andreassen, M.; Nielsen, K. M.; Lund, V.; Charnock, C. Detection of Aminoglycoside Resistant Bacteria in Sludge Samples from Norwegian Drinking Water Treatment Plants. Front. Microbiol. 2019, 10, 487. DOI: https://doi.org/10.3389/fmicb.2019.00487.
- Buss, L. N.; Yohe, T. T.; Cangiano, L. R.; Renaud, D. L.; Keunen, A. J.; Guan, L. L.; Steele, M. A. The Effect of Neomycin Inclusion in Milk Replacer on the Health, Growth, and Performance of Male Holstein Calves during Preweaning. J. Dairy Sci. 2021, 104, 8188–8201. DOI: https://doi.org/10.3168/jds.2020-19827.
- Jibril, A. H.; Okeke, IN.; Dalsgaard, A.; Olsen, J. E. Association between Antimicrobial Usage and Resistance in Salmonella from Poultry Farms in Nigeria. BMC Vet. Res. 2021, 17, 1–10. DOI: https://doi.org/10.1186/s12917-021-02938-2.
- Haulisah, N. A.; Hassan, L.; Bejo, S. K.; Jajere, S. M.; Ahmad, N. I. High Levels of Antibiotic Resistance in Isolates from Diseased Livestock. Front. Vet. Sci. 2021, 8, 652351. DOI: https://doi.org/10.3389/fvets.2021.652351.
- Snyder, L.; Champness, W. Macromolecular Synthesis: Gene Expression in Molecular Genetics of Bacteria, 2nd ed., Chap. 2; ASM Press: Washington, DC, 2003.
- Zorraquino, M. R.; Althaus, R. L.; Roca, M.; Molina, M. P. Effect of Heat Treatments on Aminoglycosides in Milk. J. Food Prot. 2009, 72, 1338–1341. DOI: https://doi.org/10.4315/0362-028x-72.6.1338.
- Zhou, J.; Ping, R.; Wu, H.; Liu, H.; Wang, X.; Ren, A.; Tian, S.; Ma, Y. Recycling of Neomycin Fermentation Residue Using SEA-CBS Technology: Growth Performance and Antibiotic Resistance Genes. Sci. Total Environ. 2022, 807, 150860–150869. DOI: https://doi.org/10.1016/j.scitotenv.2021.150860.
- Liu, Z.; Demeestere, K.; Van Hulle, S. Comparison and Performance Assessment of Ozone-Based AOPs in View of Trace Organic Contaminants Abatement in Water and Wastewater: A Review. J. Environ. Chem. Eng. 2021, 9, 105599. DOI: https://doi.org/10.1016/j.jece.2021.105599.
- Morozova, O. V.; Shumakovich, G. P.; Shleev, S. V.; Yaropolov, Y. I. Laccase Mediator Systems and Their Applications: A Review. Appl. Biochem. Microbiol. 2007, 43, 523–535. DOI: https://doi.org/10.1134/S0003683807050055.
- Cañas, A. I.; Camarero, S. Laccases and Their Natural Mediators: Biotechnological Tools for Sustainable Eco-Friendly Processes. Biotechnol. Adv. 2010, 28, 694–705. DOI: https://doi.org/10.1016/j.biotechadv.2010.05.002.
- Song, Y.; Jiang, J.; Qin, W.; Li, J.; Zhou, Y.; Gao, Y. Enhanced Transformation of Organic Pollutants by Mild Oxidants in the Presence of Synthetic or Natural Redox Mediators: A Review. Water Res. 2021, 189, 116667. DOI: https://doi.org/10.1016/j.watres.2020.116667.
- Lattanzio, V.; de Cicco, V.; di Venere, D.; Lima, G.; Salerno, M. Antifungal Activity of Phenolics against Fungi Commonly Encountered during Storage. Ital. J. Food Sci. 1994, 1, 23–30.
- Udayasoorian, C.; Prabu, P. C. Biodegradation of Phenols by Ligninolytic Fungus Trametes Versicolor. J. Biol. Sci. 2005, 5, 824–827. DOI: https://doi.org/10.3923/jbs.2005.824.827.
- Forney, L. J.; Reddy, C. A.; Tien, M.; Aust, S. D. The Involvement of Hydroxyl Radical Derived from H2O2 in Lignin Degradation by the White-Rot Fungus Phanerochaete chrysosporium. J. Biol. Chem. 1982, 257, 11455–11462. DOI: https://doi.org/10.1016/S0021-9258(18)33781-5.
- Huang, C. Z.; XU, L.; Sun, J. J.; Zhang, Z. H.; Fu, M. L.; Teng, H. Y.; YI, K. K. Allelochemical p-Hydroxybenzoic Acid Inhibits Root Growth via Regulating ROS Accumulation in Cucumber (Cucumis Sativus L.). J. Integr. Agricult. 2020, 19, 518–527. DOI: https://doi.org/10.1016/S2095-3119(19)62781-4.
- Daniel, G.; Volc, J.; Kubatova, E. Pyranose Oxidase, a Major Source of H(2)O(2) during Wood Degradation by Phanerochaete chrysosporium, Trametes versicolor, and Oudemansiella mucida. Appl. Environ. Microbiol. 1994, 60, 2524–2532. DOI: https://doi.org/10.1128/aem.60.7.2524-2532.1994.
- Prieto, A.; Möder, M.; Rodil, R.; Adrian, L.; Marco-Urrea, E. Degradation of the Antibiotics Norfloxacin and Ciprofloxacin by a White-Rot Fungus and Identification of Degradation Products. Bioresour. Technol. 2011, 102, 10987–10995. DOI: https://doi.org/10.1016/j.biortech.2011.08.055.
- Menger, F.; Gago-Ferrero, P.; Wiberg, K.; Ahrens, L. Wide-Scope Screening of Polar Contaminants of Concern in Water: A Critical Review of Liquid Chromatography-High Resolution Mass Spectrometry-Based Strategies. Trends Env. Anal. Chem. 2020, 28, e00102–11. DOI: https://doi.org/10.1016/j.teac.2020.e00102.
- Guironnet, A.; Sanchez-Cid, C.; Vogel, T. M.; Wiest, L.; Vulliet, E. Aminoglycosides Analysis Optimization Using Ion Pairing Liquid Chromatography Coupled to Tandem Mass Spectrometry and Application on Wastewater Samples. J. Chromatogr. A. 2021, 1651, 462133–462137. DOI: https://doi.org/10.1016/j.chroma.2021.462133.
- Stenholm, Å.; Hedeland, M.; Arvidsson, T.; Pettersson, C. E. Removal of Diclofenac from a Non-Sterile Aqueous System Using Trametes Versicolor with an Emphasis on Adsorption and Biodegradation Mechanisms. Environ. Technol. 2019, 40, 2460–2472. DOI: https://doi.org/10.1080/09593330.2018.1444098.
- Gao, D.; Zeng, Y.; Wen, X.; Qian, Y. Competition Stratiegies for the Incubation of White Rot Fungi under Non-Sterile Conditions. Process Biochem. 2008, 43, 937–944. DOI: https://doi.org/10.1016/j.procbio.2008.04.026.
- Gao, D.; Du, L.; Yang, J.; Wu, W. M.; Liang, H. A Critical Review of the Application of White Rot Fungus to Environmental Pollution Control. Crit. Rev. Biotechnol. 2010, 30, 70–77. DOI: https://doi.org/10.3109/07388550903427272.
- Johannes, C.; Majcherczyk, A. Natural Mediators in the Oxidation of Polycyclic Aromatic Hydrocarbons by Laccase Mediator Systems. Appl. Environ. Microbiol. 2000, 66, 524–528. DOI: https://doi.org/10.1128/AEM.66.2.524-528.2000.
- Barr, D. P.; Aust, S. D. Pollutant Degradation by White Rot Fungi. Rev. Environ. Contam. Toxicol. 1994, 138, 49–72. DOI: https://doi.org/10.1007/978-1-4612-2672-7_3.
- Huang, C.; Ren, D.; Kang, C.; Deng, Z.; Guo, H.; Zhang, S.; Zhang, X. Treatment of Nitrogen Heteocyclic Compounds (NHCs) in Coking Wastewater by White-Rot Fungi. Tecnol. Cienc. Agua. 2019, 10, 195–218. DOI: https://doi.org/10.24850/j-tyca-2019-04-10.
- Han, M.-J.; Han, M.-J.; Choi, H.-T.; Song, H.-G. Purification and Characterization of Laccase from the White Rot Fungus Trametes Versicolor. J. Microbiol. 2005, 43, 555–560.
- Stenholm, Å.; Hedeland, M.; Arvidsson, T.; Pettersson, C. E. Identification of Leachables from Trametes Versicolor in Biodegradation Experiments. Trends Green Chem. 2018, 4, 1–9. DOI: https://doi.org/10.21767/2471-9889.100024.
- ChemSpider. Chemical Structure Database, Royal Society of Chemistry. http://www.chemspider.com. Accessed 22 December 2019.
- Hanko, V. P.; Rohrer, J. S. Determination of Neomycin Sulfate and Impurities Using High-Performance Anion-Exchange Chromatography with Integrated Pulsed Amperometric Detection. J. Pharm. Biomed. Anal. 2007, 43, 131–141. DOI: https://doi.org/10.1016/j.jpba.2006.06.024.
- Sarmah, A. K.; Meyer, M. T.; Boxall, A. A Global Perspective on the Use, Sales, Exposure Pathways, Occurrence, Fate and Effects of Veterinary Antibiotics (VAs) in the Environment. Chemosphere. 2006, 65, 725–759. DOI: https://doi.org/10.1016/j.chemosphere.2006.03.026.
- Santana, C. S.; Ramos, M.; Velloso, C.; Aguiar, A. Kinetic Evaluation of Dye Decolorization by Fenton Processes in the Presence of 3-Hydroxyanthranilic Acid. IJERPH. 2019, 16, 1602–1616. DOI: https://doi.org/10.3390/ijerph16091602.
- Saarinen, T.; Orelma, H.; Grönqvist, S.; Andberg, M.; Holappa, S.; Laine, J. Adsorption of Different Laccases on Cellulose and Lignin Surfaces. Bioresources. 2009, 4, 94–110.
- Kirsch, A.; Ostendorf, K.; Euring, M. Oxygen Consumption of Laccase-Mediator-Systems (LMS). JMSR. 2015, 4, 49–57. DOI: https://doi.org/10.5539/jmsr.v4n3p49.
- Baldrian, P.; Valášková, V. Degradation of Cellulose by Basidiomycetous Fungi. FEMS Microbiol. Rev. 2008, 32, 501–521. DOI: https://doi.org/10.1111/j.1574-6976.2008.00106.x.
- Hammel, K. E.; Kapich, A. N.; Jensen, K. A., Jr.; Ryan, Z. C. Reactive Oxygen Species as Agents of Wood Decay by Fungi. Enzyme Microb. Technol. 2002, 30, 445–453. DOI: https://doi.org/10.1016/S0141-0229(02)00011-X.
- Schnell, S. Validity of the Michaelis-Menten Equation-Steady State of Reactant Stationaryassumption: That is the Question. FEBS J. 2014, 281, 464–472. DOI: https://doi.org/10.1111/febs.12564.