
ABSTRACT
Food authentication is an interesting issue for all parties in the food industry, including the fats and oils industry. Some unethical players try to blend high-quality foods, such as butter, with lower ones like lard, therefore, the analytical methods capable of analyzing the adulteration practices must be developed. This study used proton nuclear magnetic resonance spectroscopy in combination with high-performance liquid chromatography for the authentication of butter from lard adulteration. The identification of triacylglycerol composition of lard as a chemical marker for halal authentication is analyzed using high-performance liquid chromatography and high resolution nuclear magnetic resonance spectroscopy. The suitability of proton nuclear magnetic resonance provides a high-performance approach for determination butter adulterated with lard in their entirety of all proton bearing components. Peaks in the region of 2.60–2.84 ppm show special characteristics only present in lard. Only lard has its own unique characteristics which only polyunsaturated fatty acids would give signals 7 at δ 2.63, that corresponded to the chemical shift of the double-allylic methylene protons. In the same way, the intensity of signal at 2.63 ppm, due to methylenic protons in a position α to two double bonds, that is to say, due to the linoleic group. Furthermore, we also correlate some signals between 1H and 13C-NMR spectra for the confirmation of signals.
Introduction
Food authentication has received much attention from consumers, producers, and policy makers. The authenticity of food mainly focused on two domains: food safety and quality. However, this field becomes more complex due to fraud practices in manufacturing, such as adulteration and mislabeling. One of the main foods that play a role in feeding the population are dairy products. This dairy product is essential for everyone, especially for certain groups of consumers (women, children, and the elderly).[Citation1] The most expensive commodities derived from dairy products is milk fat. For this economical reason, the detection of foreign fat in milk fat is scrutinized issues. There are several ways of adulteration for milk fat, such as homogenization of skimmed milk with less expensive foreign fat and by direct incorporation of foreign fat in butter or butter fat. These frauds were developed in the 1980s[Citation2,Citation3–Citation5] and were standardized.[Citation6]
Butter is one of the milk fat products that is economically important to the dairy industry, high in nutrition, and functional to customers. Due to high standard of quality of the products, the authenticity of butter is of great importance for commercial and health reasons. Butter is the only one original product that exclusively made from cow milk. It is made by churning fresh or fermented cream or milk. It is high in lipid cholesterols and saturated fat, which consist of phospholipids, tocopherols, and carotenoids.[Citation7] Butter is one of the edible animal fats used as a finished product for cooking and as an ingredient in various alimentary preparations.
Recently, lard is commonly used as an edible animal fats raw material in food products. The presence of lard in food products can be viewed from two perspectives, economy and religion. On an economic perspective, some food products make good blends with lard to produce cost-effective products such as margarines, shortenings, and other oil-based foods.[Citation8] Therefore, the food industry likes to mix lard with butter to lessen the production cost.[Citation9] From a religious point-of-view, religions such as Islam and Judaism forbid their followers to consume and use food that contains lard or any pig-derived ingredient.[Citation10] For these reasons, analytical methods are urgently needed for rapid and reliable techniques to detect lard in food products.
Several research groups have developed the analytical methods to detect the presence of lard, mostly based chromatographic methods[Citation11] and differential scanning calorimetry;[Citation12] however, most of them are time and resource consuming.[Citation13,Citation14–Citation18] These disadvantages create an urgency to find simpler and effective methods to identify and quantify adulterated butter. In this study, we proposed proton nuclear magnetic resonance (1H-NMR) spectroscopy and high-performance liquid chromatography (HPLC) for analysis of butter from lard adulteration.
1H-NMR spectroscopy is a versatile spectroscopic technique for studying opaque heterogeneous samples that has already proven to have a number of useful applications in dairy research.[Citation19] 1H-NMR is an important tool in the study of food, lipids, oils, and fats, which has gained growing applications, particularly because of the great amount of information. It allows discrimination between oils of different composition in a very short period of time.[Citation20] Since the NMR spectra obtained are too complex to be analyzed visually, the classification of spectra in this study was carried out by coupled with chemometric analysis.[Citation21] Qualitative investigations based on the combination of NMR spectra and chemometrics of principal component analysis have been commonly applied in the fields of metabolic profiling,[Citation22] food technology,[Citation23,Citation24] and recently, for the classification of feverfew preparations.[Citation25] The present study highlights the application of 1H-NMR spectra combined with HPLC for identify the triacylglycerol (TAG) composition of lard as a chemical marker for Halal authentication.
Materials and methods
Sample preparation
A pure lard sample was extracted by rendering the adipose tissue from various parts of slaughtered pigs, which were obtained from several local markets in Selangor, Malaysia. Sampling was done in triplicates and consisted of three pig samples. Adipose tissues were heated using a microwave according to the method proposed by De Pedro et al.[Citation26] The extracted lard was filtered through double-folded muslin cloth, and anhydrous sodium sulfate was added to the extract to remove residual moisture. The extract was then filtered through Whatman No. 2 filter paper and stored at 4°C before further analysis.
Butter sample preparation
Fresh milk from the Universiti Putra Malaysia (UPM), Serdang dairy farm field was used as a raw material. The heavy cream was taken out from the milk by using a cream separator. The heavy cream then was shaken in the mixer with a medium-high speed until the color of cream changed to a pale yellow. The pale yellow buttermilk was collected and kept at –20ºC before further usage.
NMR measurement
A 10 mg sample of each sample was dissolved in 700 µL of deuterated methanol containing 0.5% tetramethysilane (TMS) and mixed using a vortex mixer. The sample was then sonicated for 1 h in a sonicator bath and left to solubilize for a further 12 h at room temperature. This was followed by centrifuging for 5 min to remove insoluble components, after that, the clear supernatant was transferred into NMR tubes. 1H-NMR spectra were recorded at 26ºC on a 500 MHz Varian INOVA NMR spectrometer operating at a proton NMR frequency of 499.887 MHz. Each 1H-NMR spectrum acquired over a spectrum width of 20 ppm, consisted of 64 scans requiring 15 min acquisition time. The resulting spectra were manually phased and base-line-corrected, using Chenomx software (v. 5.1, Alberta, Canada). The spectra were referenced to TMS at δ 0.00 ppm.
Bucketing of 1H-NMR spectra
1H-NMR spectra were automatically reduced to ASCII files using Chenomx software (v. 5.1, Alberta, Canada). Spectral intensities were binned by equal width (δ 0.04) corresponding to the region of δ 0.50–10.00. The region of δ 4.70–4.96 (water) and δ 3.28–3.33 (residual methanol) were excised from the analysis.
Analysis of TAG compositional by HPLC
The composition of TAG was analyzed using reverse-phase HPLC (Waters, Milford, MA) coupled with refractive index detector (Waters, Milford, MA). The oil samples were diluted in acetone (1:9 v/v) and directly injected into HPLC instrument. The column used in this study was a LiChroCART 100-RP-18 (12.5 cm × 4 mm i.d.; thickness 5 µm, Merck, Darmstadt). The mobile phase consisting of acetone: acetonitrile (63.5:36.5 v/v) and the flow rate was 1 mL/min at 30°C. For each analysis, 10 µL of sample solutions was injected into HPLC system. TAG peaks were analyzed by the Empower software (Milford, MA) and identified based on the retention time of TAG standards, which were then presented as percentage areas.
Determination of fatty acid composition
Fatty acid methyl esters (FAME) were prepared by dissolving a 50 mg portion of oil in 0.8 mL of hexane and adding a 0.2 mL portion of a 1 M solution of sodium methoxide (PORIM, 1995) followed by analysis on a gas chromatograph (Agillent Technologies, Singapore) fitted with an flame ionization detector (FID). The gas chromatography (GC) condition and fatty acid calculation were according to Marikkrar et al.[Citation27]
Results and discussion
Spectral analysis
Fats and oils are typically consisted of fatty acids esters of glycerol and some minor components. The 1H-NMR spectra of mixtures of fatty acid compounds such as TAG found in vegetable oils as well as animal fats and methyl esters are characterized by several salient regions of the fatty acid chains containing the signals of specific type of protons. The signals of these types of protons in the 1H-NMR spectra of vegetable oils were used to quantitate individual unsaturated fatty acids (USFA).
shows the typical 1H-NMR spectra of pure lard (A) and pure butter (B). Both spectrums of these samples consist of nine signals of variable intensity depending on the proportions of different acyl groups. These spectra signals are mainly due to the protons of the main components such as TAG, and their area is proportional to the number of hydrogen atoms of each kind presents in the sample. The range of chemical shifts at 0 to 4 ppm cover most the free fatty acids and fatty acids that attached to the glycerol while chemical shifts range 4 to 6 ppm is assigned to the signals of proton at glycerol backbone in butter and lard. The spectra of fats sample usually have the similar profile, with difference only apparent in the intensities of the peak. However, careful observation on the extended spectra shows significant differences between sample.[Citation20] General assignment of the signals to these spectra to the different kind of hydrogen atoms is well-known[Citation20,Citation28,Citation29] and is given in .
Table 1. Assignments of signals of 1H-NMR spectra from samples. Signal number agrees with those in .
Figure 1. 1H-NMR spectra of A: pure lard; and B: pure butter.
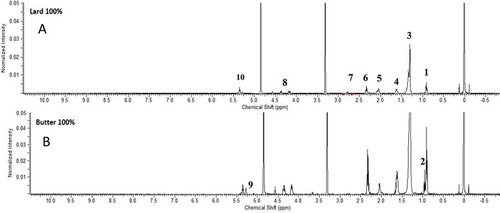
Signal 1 is produced by the overlapping of the triplet signals of methyl group hydrogen atoms of saturated, oleic (n-9) and linoleic (n-6) acyl groups and signal 2 is a triplet due to the methyl hydrogen atoms of n-3 acyl groups. The difference in chemical shifts between both methyl hydrogen atom signals is due to their proximity to the double bond of the chain. Signal 3 is due to the hydrogen atoms of those methylene groups either in position β or further from olefinic groups, or in position γ or further from carbonilic groups inside the triglyceride molecule. Signals 4 and 6 are due to methylene hydrogen atoms in β- and α-position, in relation to the carbonyl group, respectively. Signal 5 is due to α-methylene hydrogen atom in relation to a single-double bond, also named allylic hydrogen atoms, and signal 7 is due to the overlapping of the signals of α-methylene hydrogen atom in relation to two double bonds, also named bis-allylic hydrogen atoms. Signal 8 is due to the hydrogen atoms on 1 and 3 carbon atoms of the glyceryl group, and signal 9 is due to the hydrogen atom on the carbon atom 2 of the glyceryl group. This latter signal overlaps slightly with signal 10 due to olefinic hydrogen atoms of the different acyl groups.
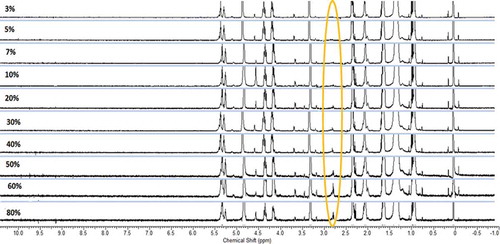
The 1H-NMR spectra of butter with 3% of lard to 80% of lard are shown in . The entire range of spectra looks similar with the naked eye, unless one observes very closely, especially in highlighted peak region 2.60–2.84 ppm. This is due to the similar composition between both of the samples. Taking into account the differences between the butter and lard spectra, it is obvious that peak intensities at 2.60–2.84 ppm are different. Therefore, these frequencies were selected to be optimized for analysis of lard in butter because 1H-NMR spectra variation was observed between lard and butter. Qualitatively, it is easy to differentiate between 3% lard and 80% lard in this region. The spectra of lard having a peak at 2.63 ppm which is known the overlapping of the signals of α-methylene hydrogen atom in relation to two double bonds, also named bis-allylic hydrogen atoms, whereas the spectra of butter has no peak at the 2.63 ppm.
Figure 2. 1H-NMR spectra of butter and lard mixtures showing changes in the height ratio at 2.60–2.84 ppm due to the increase of lard percentages at 0 to 10 ppm.
Fatty acid profile
As pointed out previously, the area of these 1H-NMR spectra signal is proportional to the number of protons of both samples butter and lard. The fatty acid profile of butter and lard is the major factor influencing the chemical and physical properties and subsequently their various applications. Evidently, NMR techniques alone will not be able to provide detailed information about the molar percentage of any specific fatty acid present in a mixture of TAG. This compositional information can only be provided by the chromatographic methods. The fatty acid composition of butter and lard are listed in . The major fatty acid composition of butter were myristic, palmitic, and oleic acids with value 14.79 ± 0.05, 31.29 ± 0.05, and 22.77 ± 0.13, respectively, while lard consist of palmitic, oleic, and linoleic with values 23.37 ± 0.22, 40.15 ± 0.31, and 17.29 ± 0.09, respectively. Butter has more saturated fatty acids (SFA) 61.68 compared to lard with a USFA value of 60.2.
Table 2. Fatty acid composition of butter and lard by gas chromatography mass spectrometry analysis.
TAG composition
TAG are the main constituent of vegetable oil and animal fat, and make up most of the fats digested by humans. They are important in that they allow the uptake and transport of fat-soluble vitamins. They also play a role in metabolism (unused, saturated, or monounsaturated fatty acids are stored by the body as triglycerides). However, triglyceride intake should be monitored because high levels of triglycerides have been linked to an increased risk of heart disease and stroke. compiled the TAG composition of butter and lard. Butter is actually a complex mixture of different saturated triglycerides. The profile differences can be attributed to the fact that these products are from different sources; butter is processed from cow milk or cream; whereas, lard is rendered from pig fatty tissues. The TAG peak identification in this study was based on retention time of TAG standards. Butter consists of shorter length of fatty acid compared to lard.
Table 3. Triacylglycerol (TAG) composition of lard, butter, and other animal fats.
The TAG distributional profiles of butter and lard are compared. The predominant TAGs of butter were CCLa (12.99 ± 0.02), CLaLa (12.34 ± 0.14), and LaLaLa (15.8 ± 0.18); while lard was POO (23.37 ± 0.07), palmitoyloleoyllinoleoyl (POL; 21.6 ± 0.58), and POS (18.14 ± 0.37). This is an agreement with the previous findings of Rashood et al.[Citation30] and Yanty et al.[Citation31] Lard itself has its own special characteristic in that it has high predominance SFA, especially palmitic acid at the sn-2 position, unlike most other fats and oils.[Citation32] The three TAGs namely LaLaLa, CLaLa, and CCLa were the only TAG species occurring in amounts higher than 10%. Most of the remaining peaks of the chromatogram represent either minor or trace levels of TAG species.
13C-NMR and heteronuclear multiple bond correlation (HMBC)
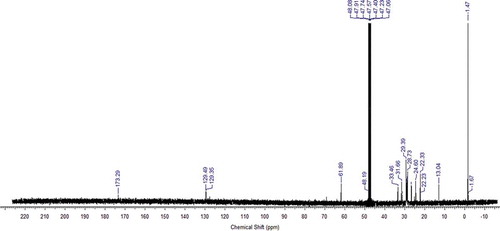
The high resolving power of 13C-NMR spectroscopy allows many of the positional isomers of long-chain fatty acids or esters to be differentiated. For example, in the spectrum of lard (), the shifts of the carbonyl region appear at δ173.29 signals correspond to different carbonyl carbons from fatty acid. In general, the chemical shift in this signal depends on the TAG, the stereospecific confirmation (fatty acid in α [sn-1,3] or β [sn-2] position in acylglycerol), and the distance (Δ) of the nearest double bond to the carbonyl carbon. Since the positional distribution of fatty acids in TAG seems to be unique for each species.[Citation33] The carbonyl region can be of value for lard identification. Additionally, it may be possible to discover if the lard has been subjected to adulteration from other species from this region of the spectra. In general, stereospecific analysis of TAG has shown that the positional distribution of fatty acids varies among plant and animal fat.[Citation34,Citation35] In vegetable oils, linoleic acid is mainly present in sn-2 position, while SFA are concentrated in the sn-1 and sn-3 positions.[Citation36] In animals, the stereospecifity varies among species[Citation33,Citation37] and among parts of the same animal. Studies of lard has shown that palmitic acid are preferentially esterified at the sn-2,[Citation38,Citation39] while saturated and monounsaturated fatty acid are preferably esterified at the sn-1,3 positions.[Citation34,Citation35] From the olefinic region 132.5–126.6 ppm of the 13C-NMR spectrum, information about USFA can be obtained.[Citation37] Since fatty acid composition varies among species and geographical origin, addition of different types of oil can be seen in this region. Olefinic carbon atoms in n-3 fatty acids display characteristic peaks because of the influence on the chemical shift from any methyl end group in the vicinity. The two resonances at 129.49 and 129.35 ppm, respectively, are unique for fatty acid with a double bond at n-3 position, and these peaks allow quantification of the relative concentration of n-3 fatty acid in lipid mixtures. As for the carbonyl region at 61.89 where resonances from glycerol carbons appear gives valuable information about the glycerol carbon resonances are influenced by the stereospecific conformation and the nature of the esterified fatty acid, namely the distance to the nearest double bond. For TAG the resonances from glycerol carbons esterified at sn-1, 3 and sn-2 positions are separated by approximately 7 ppm. Consistent with findings from the carbonyl regions, observations in this region confirm that several glycerol ester species in addition to TAGs are present in the lard.
Figure 3. 13C nuclear magnetic resonance (NMR) spectrum of lard.
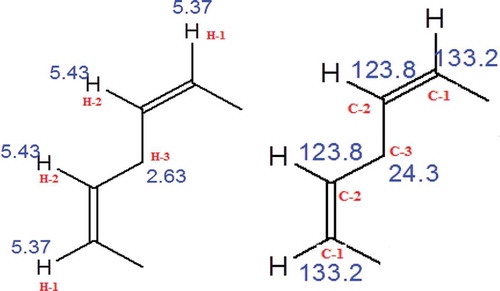
13C-NMR spectra of fatty acids provided a large number of signals spread over a wide range of chemical shifts, which made the spectrum appear complicated, but much more informative. Techniques of correlating signals between 1H-NMR and 13C-NMR spectra provided HMBC, is some of the latest technique in NMR spectroscopy from which structural details can be derived in great detail. To reconfirm these assignments, the HMBC spectrum was recorded (). This technique shows correlations of nuclei (carbon to carbon or carbon to proton) which are two or three bonds apart. shows the structural correlation between proton and carbon. The signal at δc 133.2 (C-1) was correlated to the proton signals at δH 5.37 (H-1). The signals at δc 123.8 (C-2) correlated to the proton signals at δH 5.43 (H-2) and the signal at δc 24.3 (C-3) correlated to the proton signals at δH 2.63 (H-3). These two- or three-bond connections reconfirmed the assignments of the carbon atom of the POL.
Figure 4. Heteronuclear multiple bonds correlation (HMBC) spectrum of lard.
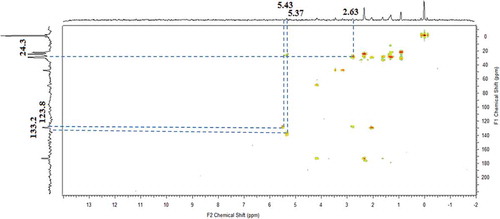
Figure 5. Structural correlation between proton and carbon.
Conclusion
The TAG composition of lard as a chemical marker for Halal authentication was successfully identified using high-resolution NMR spectroscopy. The suitability of 1H-NMR together with HPLC provided a high-performance approach for the determination of butter adulterated with lard in their entirety of all proton bearing components. Peaks in the region of 2.60–2.84 ppm shows special characteristics, present only in lard. Therefore, these frequencies were selected to be optimized for analysis of lard in butter, because 1H-NMR spectra variation was observed between lard and butter. Only lard have its own unique characteristics which only polyunsaturated fatty acids would give signals 7 at δ 2.63 which corresponded to the chemical shift of the double-allylic methylene protons. In the same way, the intensity of signal at 2.63 ppm, due to methylenic protons in a position α to two double bonds, that is to say, due to the linoleic group. Techniques of correlating signals between 1H and 13C-NMR spectra provided HMBC, which permitted confirmation of signals. This technique shows correlations of nuclei (carbon-to-carbon or carbon-to-proton) which are two or three bonds apart. These two- or three-bond connections reconfirmed the assignments of the carbon atom of the POL. This method is rapid, non-destructive, and easy to use. Great precision of a method is a requirement of quality control in the dairy product industry .Thus, the combination of 1H-NMR and HPLC could be a powerful alternative for identification of lard adulteration in butter.
Funding
Nurrulhidayah Ahmad Fadzillah acknowledges MyPhD for the scholarship to pursue the Ph.D. program in Halal Products Research Institute, Universiti Putra Malaysia (UPM). This research was supported by Universiti Putra Malaysia (UPM), also providing the funding support awarded to Professor Dr. Russly Ab Rahman through the RUGS 9316900 grant. She also acknowledges the Research Management Centre, Universiti Teknologi Malaysia for providing her with a postdoctoral research fellowship (project number QJ130000.21A2.02E45).
Additional information
Funding
References
- U.S. Department of Agriculture. Center for Nutrition Policy and Promotion. ChooseMyPlate.gov ( accessed 2011).
- Timms, R.E. Determination of Oxidative Deterioration of Milk Powder and Reconstituted Milk by Measurement of Chemiluminescence. Journal of Dairy Research 1982, 47, 295–303.
- Precht, D. Detection of Foreign Fat in Milk Fat. I Qualitative Detection by Triacylglycerol Formulae. European Journal of Food Research and Technology 1992, 194, 1–8.
- Precht, D. Detection of Adulterated Milk Fat by Fatty Acid and Triglyceride Analysis. Fett Wissens Technology 1991, 93, 538–544.
- Precht, D.; Mukherjee, K.D.; Weber, N.; Sherma, J. CRC Handbook of Chromatography, Analysis of Lipids; CRC Press: Boca Raton, FL, 1993; 123 pp.
- Commission of the European Communities: Detection of Foreign Fats in Milk Fat by Means of Gas Chromatographic Triglyceride Analysis. Doc. No VI/5202/90-EN, VI/2645/91.
- Jensen, R.G. The Composition of Bovine Milk Lipids: January 1995 to December 2000. Journal Dairy Research 2002, 85, 295–350.
- Marikkar, J.M.N.; Ghazali, H.M.; Che Man, Y.B.; Peiris, T.S.G.; Lai, O.M. Distinguishing Lard from Other Animal Fats in Admixtures of Some Vegetable Oils Using Liquid Chromatographic Data Coupled with Multivariate Data Analysis. Food Chemistry 2005, 91, 5–14.
- Che Man, Y.B.; Rohman, A.; Mansor, T.S.T. Differentiation of Lard from Other Edible Oils by Means of Fourier Transform Infrared Spectroscopy and Chemometrics. Journal of American Oil Chemist Society 2011, 88, 187–192.
- Regenstein, J.M.; Chaudry, M.M.; Regenstein C.E. Kosher and Halal in the Biotechnology Era. Applied Biotechnology Food Science and Policy 2003, 1, 95–108.
- Indrasti, D.; Che Man, Y.B.; Mustafa, S.; Hashim, D.M. Lard Detection Based on Fatty Acids Profile Using Comprehensive Gas Chromatography Hyphenated with Time-of-Flight Mass Spectrometry. Food Chemistry 2010, 122, 1273–1277.
- Marikkar, J.M.N.; Lai, O.M.; Ghazali, H.M.; Che Man, Y.B. Compositional and Thermal Analysis of RBD Palm Oil Adulterated with Lipase-Catalyzed Interesterified Lard. Food Chemistry 2002, 76, 249–258.
- Lipp, M. Review of Methods for the Analysis of Triglycerides in Milk Fat: Application for Studies of Milk Quality and Adulteration. Food Chemistry 1995, 54, 213–221.
- Contarini, G.; Povolo, M.; Bonfitto, E. The Present and Future for Controlling the Authenticity of Butter. Latte 1999, 24, 60–69.
- De la Fuente, M.A.; Ju´arez, M. Application of Chromatographic Techniques to the Study of Triglycerides and Sterols of Milk Fat. Food Science Technology and International 1999, 52, 103–119.
- Ulberth, F.; Buchgraber, M. Authenticity of Fats and Oils. European Journal of Lipid Science and Technology 2000, 102, 687–694.
- Kamm, W.; Dionisi, F.; Hischenhuber, C.; Engel, K.H. Authenticity of Fats and Oils. Food Reviews International 2001, 17, 249–290.
- Jee, M. Milk Fat and Other Animal Fats. In Oils and Fat Authentication; Jee, M.; Ed.;: Blackwell Publishing CRC Press: Reading, UK, 2002; 115–142 p.
- Duce, S.L.; Amin, M.H.G.; Horsefield, M.A.; Tyszka, M.; Hall, L.D. NMR Imaging of Dairy Products in Two Or Three Dimensions. International Dairy Journal 1999, 5, 311–319.
- Guillén, M.D.; Ruiz, A. High Resolution 1H Nuclear Magnetic Resonance in the Study of Edible Oils and Fats. Trends Food Science and Technology 2001, 12, 328–338.
- Lavine, B. Chemometrics. Analytical Chemistry 1998, 70, 209R–228R.
- Nicholson, J.; Lindon, J.; Holmes, E. Metabonomics: Understanding the Metabolic Responses of Living Systems to Pathophysiological Stimuli Via Multivariate Statistical Analysis of Biological NMR Spectroscopic Data. Xenobiotica 1999, 29, 1181–1189.
- Vogels, J.T.W.E.; Terwell, L.; Tas, A.C.; Dukel, F.; van der Greef, J. Detection of Adulteration in Orange Juices by a New Screening Method Using Proton NMR Spectroscopy in Combination with Pattern Recognition Techniques. Journal of Agriculture and Food Chemistry 1996, 44, 175–180.
- Belton, P.S.; Colqhoun, I.J.; Kemsley, E.K.; Degadillo, I.; Roma, P.; Dennis, M.K. Application of Chemometrics to the 1H Spectra of Apple Juices: Discrimination of Apple Varieties. Food Chemistry 1998, 61, 207–213.
- Bailey, N.J.C.; Sampson, J.; Hylands, P.J.; Nicholson, J.K.; Holmes, E. Multicomponent Metabolic Classification of Commercial Feverfew Preparations Via High-Field 1H-NMR Spectroscopy and Chemometrics. Planta Medica 2002, 68, 734–738.
- De Pedro, E.; Casillas, M.; Miranda, C. Microwave Oven Application in the Extraction of Fat from the Subcutaneous Tissue of Iberian Pig Ham. Meat Science 1997, 45, 45–51.
- Marikkrar, J.M.N.; Ghazali, H.M.; Long, K.; Lai, O.M. Lard Uptake and Its Detection in Selected Food Products Deep-Fried in Lard. Food Research International 2003, 36, 1047–1060.
- Miyake, T.; Watanabe, K.; Watanabe, T.; Oyaizu, H. Phylogenetic Analysis of the Genus Bifidobacterium and Related Genera Based on 16S rDNA Sequences. Microbiology Immunology 1998, 42, 661–667.
- Sacchi, R.; Francesco, A.; Paolillo, L. 1H and 13C NMR of Virgin Olive Oil. An Overview. Magnetic Resonance Chemistry 1997, 35, 133–145.
- Rashood, K.A.; Shaaban, R.R.A.; Moety, E.M.A.; Rauf, A. Triacylglycerols-Profiling by High Performance Liquid Chromatography: A Tool for Detection of Pork Fat in Processed Foods. Journal of Liquid Chromatography 1996, 18, 2661–2673.
- Yanty, N.A.M.; Marikkar, J.M.N.; Man, Y.B.C.; Long, K. Composition and Thermal Analysis of Lard Stearin and Lard Olein. Journal of Oleo Science 2011, 60, 333–338.
- Kallio, H.; Yli-Jokipii, K.; Kurniven, J.P.; Sjovall, O.; Tahvonen, R. Regioisomerism of Tracylglycerols In Lard, Tallow, Yolk, Chicken Skin, Palm Oil, Palm Olein, Palm Stearin, and a Transesterified Blend of Palm Stearin and Coconut Oil Analysed by Tandem Mass Spectrometry. Journal of Agriculture and Food Chemistry 2001, 49, 3363–3369.
- Aursand, M.; Standal, I.B.; Axelson, D.E. High-Resolution 13C Nuclear Magnetic Resonance Spectroscopy Pattern Recognition of Fish Oil Capsules. Journal of Agriculture and Food Chemistry 2007, 55, 38–47.
- Gunstone, F.D.; Seth, S. A Study of the Distribution of Eicosapentaenoic Acid and Docosahexaenoic Acid Between the α and β Glycerol Chains in Fish Oils by 13C-NMR Spectroscopy. Chemistry and Physics of Lipids 1994, 72, 119–126.
- Ando, Y.; Satake, M.; Takahashi, Y. Reinvestigation of Positional Distribution of Fatty Acids in Docosahexaenoic Acid-Rich Fish Oil Triacyl-Sn-Glycerols. Lipids 2000, 35, 579–582.
- Mannina, L.; Luchinat, C.; Emanuele, M.C.; Segre, A. Acyl Positional Distribution of Glycerol Tri-Esters in Vegetable Oils: A 13C-NMR Study. Chemistry and Physics of Lipids 1999, 103, 47–55.
- Aursand, M.; Grasdalen, H. Interpretation of the 13C-NMR Spectra of Omega-3 Fatty Acids and Lipid Extracted from the White Muscle of Atlantic Salmon (Salmo Salar). Chemistry and Physics of Lipids 1992, 62, 239–251.
- Christie, W.W.; Moore, J.H. A Comparison of the Structures of Triglycerides from Various Pig Tissues. Biochimia et Biophysica Acta 1970, 210, 46–56.
- Kagawa, M. Species Identification by the Positional Analysis of Fatty Acid Composition in Triacylglyceride of Adipose and Bone Tissues. Forensic Science International 1996, 79, 215–226.