
ABSTRACT
It is axiomatic that good measurements are integral to good public policy for environmental protection. The generalized term for “measurements” includes sampling and quantitation, data integrity, documentation, network design, sponsorship, operations, archiving, and accessing for applications. Each of these components has evolved and advanced over the last 200 years as knowledge of atmospheric chemistry and physics has matured. Air quality was first detected by what people could see and smell in contaminated air. Gaseous pollutants were found to react with certain materials or chemicals, changing the color of dissolved reagents such that their light absorption at selected wavelengths could be related to both the pollutant chemistry and its concentration. Airborne particles have challenged the development of a variety of sensory devices and laboratory assays for characterization of their enormous range of physical and chemical properties. Advanced electronics made possible the sampling, concentration, and detection of gases and particles, both in situ and in laboratory analysis of collected samples. Accurate and precise measurements by these methods have made possible advanced air quality management practices that led to decreasing concentrations over time. New technologies are leading to smaller and cheaper measurement systems that can further expand and enhance current air pollution monitoring networks.
Implications: Ambient air quality measurement systems have a large influence on air quality management by determining compliance, tracking trends, elucidating pollutant transport and transformation, and relating concentrations to adverse effects. These systems consist of more than just instrumentation, and involve extensive support efforts for siting, maintenance, calibration, auditing, data validation, data management and access, and data interpretation. These requirements have largely been attained for criteria pollutants regulated by National Ambient Air Quality Standards, but they are rarely attained for nonroutine measurements and research studies.
Introduction
There is no substitute for accurate, precise, and representative measurements to support good atmospheric science, which in turn drives good public policy. Atmospheric measurements of trace gases and airborne particles have been an essential part of air quality management since the 19th century (Brimblecombe, Citation1978; Davidson, Citation1979; Stern, Citation1982). Measurements have relied on the creativity of analytical chemists and engineers. Pollutant gases were found to cause color changes when bubbled through reactive solutions, enabling wavelength- and chemical-specific light absorption—“tapping the rainbow.” Arie Haagen-Smit (Haagen-Smit and Fox, Citation1954) used rubber band cracking to determine ambient ozone (O3) concentrations by the depth of the cracks. Frits Went (Citation1960) associated a blue haze with oxidation of biogenic carbon emissions and recognized the importance of natural hydrocarbons in forming aerosols. There have been many measurement advances since these early efforts, from instrumentation to codification of site design and management.

In the United States, air quality management falls within the jurisdiction of the Clean Air (CAA), which provides legal authority to protect human health and the environment from pollution exposure (Bachmann, Citation2007; Chow et al., Citation2007b). The original CAA legislation was passed in 1963, but details of the air quality management system and technology-based federal standards used today were embodied in the landmark CAA revision of 1970. Important provisions were added in the 1977 and 1990 CAA amendments. The legal framework for air quality management calls for established criteria and procedures to constrain debates to common terms. This requires documentation from measurements and other assessments, including modeling of emissions to ambient concentrations accounting for atmospheric processes. This framework places prescriptive constraints on measurements in the form of standard reference methods, monitoring site criteria, and data management practices.
The U.S. air quality management system adopted risk-based National Ambient Air Quality Standards (NAAQS) for health and environment, as well as technology-based emission standards for mobile and stationary sources. The CAA also included technology- and risk-based standards for toxic pollutants from stationary sources, with risk determined by health and ecological system responses to gaseous and particulate matter (PM) pollutant concentrations (Biswas and Wu, Citation2005; Chow et al., Citation2005b; Citation2006a; Eklund et al., Citation2014; Ferris, Citation1978; Goldstein, Citation1983; Grahame et al., Citation2014; Hu and Shy, Citation2001; Lighty et al., Citation2000; Lippmann, Citation1988; Mukerjee, Citation1998a, Citation1998b; Pope and Dockery, Citation2006; Sinclair et al., Citation2014; Vedal, Citation1997; Watson et al., Citation1997b). NAAQS indicators, averaging times, tolerance levels, statistical forms, and compliance measurements have changed with improved technical information about pollution and its effects.
What is involved in good measurement practice for air quality characterization? In a general sense, measurements are defined as a process involving sampling and quantitation, data integrity and documentation, archiving and access, and network design and operations. This critical review (CR) traces the evolution of air quality measurements, mainly over the last century. It anticipates potential improvements in future years based on current research. The CR focuses on NAAQS-related pollutant measurements, which have improved with scientific interactions and policy development for risk reduction. An important part of the latter interaction has advanced the understanding of emissions, atmospheric processes, and estimates of health and ecosystem exposures.
The CR contains examples derived from the authors’ collective experience of more than 200 person-years with field and laboratory measurements. This is not a comprehensive review, which would require dozens of experts from the public and private sectors who have contributed to the current state of knowledge about the measurement process. Instead, this CR surveys examples from the authors’ experience, and their familiarity with the Air & Waste Management Association’s (A&WMA) journal publications, to illustrate the elements of the measurement process (Watson et al., Citation1995a).
Several other resources are available for greater depth. The U.S. Environmental Protection Agency (EPA, Citation2017e) has amassed a large portfolio of reports and publications related to ambient and source measurements, along with data archiving and use in models. Other reviews are available for: (a) methods and instrumentation (American Society for Testing Materials International [ASTM], Citation2017; Chow, Citation1995; Chow et al., Citation2008a; Cohen and McCammon, Citation2001; Hidy et al., Citation2009; Hoff and Christopher, Citation2009; Katz, Citation1980; Kulkarni et al., Citation2011; Lodge, Citation1989; McKee et al., Citation1973; Mueller, Citation1980; NARSTO, Citation2010; Parrish and Fehsenfeld, Citation2000; Ruzer and Harley, Citation2013; Solomon and Sioutas, Citation2008; Watson et al., Citation1995b; Wexler and Johnston, Citation2008); (b) data verification and audits (U.S.EPA, Citation1994, Citation2013, Citation2017a, Citation2017m); (c) archiving and access (CIRA, Citation2017; U.S.EPA, Citation2017c); and (d) network design, sampler siting, and operations (Chow et al., Citation2002a; Mueller et al., Citation1983a; Scheffe et al., Citation2007; Watson et al., Citation1997a).
Since this is the 110th anniversary of the A&WMA, it is timely to summarize an important component of the Association’s contributions. This is facilitated through the perspective of A&WMA’s longest member (65 years), Dr. Peter K. Mueller, who was a pioneer and long-time practitioner of quality-assured air quality measurements. Dr. Mueller’s experience includes field and laboratory methods development, data integrity, archiving and access, site selection, network design, and operations. The CR cites examples of his work and those of his colleagues.
Major measurement efforts have been invested in the criteria pollutants: (1) sulfur oxides (SOx), measured as sulfur dioxide (SO2); (2) carbon monoxide (CO); (3) ozone and related photochemical oxidants, measured as ozone (O3); (4) nitrogen oxides (NOx), measured as nitrogen dioxide (NO2); (5) PM, measured as respirable (PM2.5) and inhalable (PM10) size fractions (mass of particles with aerodynamic diameters <2.5 and 10 µm); and (6) particulate lead measured in total suspended particulates (TSP). TSP (PM with aerodynamic diameters <~30 µm) was the original NAAQS indicator, but subsequent research demonstrated that PM2.5 and PM10 indicators were more closely associated with adverse environmental effects.
Because O3 and much of the PM2.5 are formed from noncriteria gases, reactive nitrogen species (NOy), NOz (= NOy – [NO2 + NO]), and volatile organic compounds (VOCs) are often measured to evaluate sources and control strategies. Some components of PM and VOCs are also regulated as hazardous (toxic) air pollutants (HAPS) through source category emission limits.
Methods and instrumentation
Gases
The gaseous criteria pollutants are commonly known trace species in the atmosphere, largely associated with fuel combustion. SO2 has been recognized since Roman times, and was emitted from sulfur candles to freshen wine barrels (Smith et al., Citation2014). The discovery of nitrogen oxide, (NO) and NO2, along with CO between 1772 and 1799 is attributed to the English chemist and philosopher Joseph Priestley (FamousInventors, Citation2017). Priestley showed, for example, that CO differed from carbon dioxide (CO2) in fuel combustion emissions. CO was known and studied in the late 1200s when the Spanish alchemist Arnold of Villanova described a poisonous gas produced by incomplete combustion of wood. Special mention of toxicity of the gas was noted, including by Johann Baptista van Helmont in 1644, when he nearly died from inhaling a gas termed carbonum, presumably a mixture of CO and CO2 (ScienceEncyclopedia, Citation2017).
The Dutch chemist Van Marum appears to be the first person to detect O3 by its smell. In his 1826 experiments, he mentioned the characteristic odor around his electrifier, which likely resulted from O3 (Stolarski, Citation2017). Schoenbein later mentioned in 1840 an odor from his experiments, calling this trace air contaminant “ozone,” extracted from ozein, a Greek word for scent (Rubin, Citation2001). Following his discovery, Schoenbein researched reaction mechanisms of O3 with organic material. From Schoenbein’s research, O3 was quantified using an iodate-based oxidation method (Byers and Saltzman, Citation1958). These observations are relevant today for addressing preindustrial O3 background levels and for modeling the global radiative balance (Cooper et al., Citation2014; Mickley et al., Citation2004). The first sustained, quantitative urban measurements appear to have been made in Paris in the 1870s, and later in Lansing, MI, 1876–1880 (Bojkov, Citation1986).
Most of the early U.S. chemical measurements of pollutant gases were semiquantitative, using passive detectors such as rubber cracking for O3 and chemical reactive pads that changed color with exposure. NAAQS compliance measurements required quantitative, continuous or semicontinuous operation, low detection limits, knowledge and accounting of interferences, thermal, pressure, and humidity stability, minimal operator attention, fast response times, quantitative consistency with standard reference methods, and acceptable accuracy and precision.
Sulfur dioxide
Like most trace gas observations, semicontinuous SO2 measurements relied on wet chemical methods, with sampling at known flow rates through bubblers containing aqueous solutions of reagents that reacted with the gas. The standard reference method through the 1950s to the present is the West-Gaeke (Trieff et al., Citation1968; West and Gaeke, Citation1956a, Citation1956b) pararosanaline colorimetric analysis. This method was robust for its time, and remains a reference standard, but it has a nominal accuracy of ±10% and a detection limit of 5–75 ppbv, depending on sample duration and aqueous absorber volume. This detection and accuracy level was insufficient for U.S. ambient conditions after 1980 (Reisinger et al., Citation1989). For continuous SO2 measurements with lower detection limits and relatively fast response times, instruments employing coulometric, flame photometric, or pulsed fluorescence principles have been adopted (Demerjian, Citation2000; Hansen et al., Citation2003). Accuracy of these instruments is approximately the same as for the pararosanaline method, including calibration and reference standards, but detection limits are much lower, depending on the use of inlet denuders or prefilters to minimize interferences from other sulfur compounds.
Carbon monoxide
CO measurements have focused on urban conditions where gas concentrations are in the ppmv range owing to high engine exhaust emissions. The CO reference method uses nondispersive infrared (NDIR) absorption (Jacobs et al., Citation1959; McKee et al., Citation1973). Commercial instruments can detect levels <100 ppbv for hourly averages with appropriate calibration referenced to primary standards. Parrish and Fehsenfeld (Citation2000) describe contemporary research-oriented options to obtain <1 ppbv detection limits while avoiding interferences from water vapor and CO2. These include sampling with sterile, stainless-steel canisters followed by gas chromatographic analysis in the laboratory, differential absorption spectroscopy, and tunable diode absorption spectroscopy.
Oxides of nitrogen
Nitrogen oxides (NO2, NO, NOx,) quantification methods have evolved to address both the NO2 NAAQS and as precursors (the “Yin”) to O3 and secondary PM formation. NOx as NO plus NO2 is a combustion product deriving from oxidation of the nitrogen in air as well as in the fuel. NOx measurement has developed in an ambiguous way, with substantive interferences identified from “reactive nitrogen” species (including NOz) identified in the laboratory and in the ambient air. The latter include inorganic and organic nitrates.
NO2 monitoring in the 1960s was conducted with a bubbler system using the colorimetric method of Saltzman (Citation1954), which was believed to be free of interferences from O3, SO2, hydrogen sulfide (H2S) and aldehydes, except for acetaldehyde. The method has a sensitivity of a few ppbv with a 10-minute sample duration. Later in the 1970s alternatives to the wet chemical-bubbler method were explored (Kothny and Mueller, Citation1965, Citation1966, Citation1968; Mueller et al., Citation1966, Citation1968), and were later supplanted with chemiluminescent detection as the standard reference method (Dunlea et al., Citation2007; Spicer et al., Citation1994; Winer et al., Citation1974; Zhang et al., Citation2010). NO detection involves the reaction with O3 to produce electromagnetic radiation from an excited NO2 product proportional to the O3 concentration. The NO2 instrument uses a heated catalytic surface that reduces NO2 to NO followed by quantitation of the resulting NO concentration. A high fractional and stable conversion efficiency is critical to this device. Molybdenum is used with conversions of NO2 to NO exceeding 80%; and a ferrous sulfate coating has also been used. The chemiluminescence instrument is simple and robust for urban applications, but for low NOx concentrations, other reactive nitrogen species, particularly nitric acid (HNO3) and peroxyacetylnitrate (PAN), interfere with the concentration determinations (Winer et al., Citation1974). Other NOx instruments based on tunable diode laser spectroscopy, luminol chemiluminescence, or cold trapping followed with electron spin resonance detection have been used (Parrish and Buhr, Citation1993; Zhang et al., Citation2010).
Characterizing the complicated nature of nitrogen oxide speciation beyond NOx has challenged scientists since the 1970s (Muller and Rudolph, Citation1989; Nicksic et al., Citation1967). Early PAN and other organonitrates were monitored in Riverside, CA, for several years using a chromatograph with an electron capture detector (Darley et al., Citation1963). The abundance of reactive nitrogen species (NOy) has been useful for inferring NOx reaction pathways during photochemical processing, which is accomplished by placing the converter catalyst at the top of the sampling line to convert HNO3 and PAN to NO prior to their deposition within the sampling line (Fahey et al., Citation1985).
Ozone
O3 is not directly emitted, but derives from reactions of NOx and VOCs, including those from both natural and manmade sources. Haagen-Smit (Citation1950) found indications in Los Angeles, CA of unusual vegetation damage, which he suspected was attributable to O3 exposure. Using the cracking rate of rubber bands exposed to polluted air (Bradley and Haagen-Smit, Citation1951), high O3 levels were found. Systematic ground-level O3 monitoring began in the Los Angeles area in the 1950s. From 1959 to 1975, the California Air Resources Board (CARB) adopted a non-buffered potassium iodide wet chemical method (Altshuller et al., Citation1959), which was found to have interferences from NO2 and other trace oxidants such as peroxide, and PAN. As a consequence, the method was identified operationally as a total oxidant measure. O3 measurements evolved from wet chemical to instrumental methods in the 1970s (DeMore et al., Citation1975; DeMore and Patapoff, Citation1976). The method most commonly applied since the 1970s uses ultraviolet (UV) absorption at 254 nm (Hearn, Citation1961). The second method involves chemiluminescence from the reaction of O3 with NO or with a reactive VOC, such as ethylene (Hodgeson et al., Citation1970). Electrochemical–potassium iodide sensors have been used in sondes to measure the vertical structure of O3 concentrations (Lin, Citation2008). The UV absorption method has minimal interferences, believed to be associated with aromatic compounds (Huntzicker and Johnson, Citation1979; Kleindienst et al., Citation1993; Leston et al., Citation2005; Ollison et al., Citation2013; Spicer et al., Citation2010). Chemiluminescent instruments offer improved detection limits compared with UV absorption, but they are more complex to operate. Electrochemical devices are lightweight and suitable for balloon ascents, but they have interferences from trace oxidants, as found with other iodine techniques. Even in the case of national preference for UV O3 monitoring, interferences such as water vapor add a minor bias to the ambient measurements, which need to be accounted for as O3 levels continue to decline (Spicer et al., Citation2010).
Important adjuncts for O3 research measurements are peroxides, hydroperoxides, and free radical species of “ROx,” with R being an organic root of H, as well as NOz. The highly reactive oxygen species are difficult to measure without interferences from species of much higher concentrations, even though attempts to do so date back to the 1970s (Anderson, Citation1987; Sauer et al., Citation1997; Weinstein-Lloyd et al., Citation1996).
Volatile organic compounds
VOCs are a superset of the nonmethane hydrocarbons (NMHCs) originating from a variety of natural and anthropogenic sources (Schuette and Mueller, Citation1964) that represent the “Yang” of tropospheric O3 production. They are not criteria pollutants but are both the precursors and end products of reactions that create O3 and important PM components. VOCs include designated air toxics (toxins) and HAPs (EPA, Citation2017d). Measurement of these reactive species has become increasingly important as emission controls reduce anthropogenic VOCs. Elevated levels of natural VOCs, such as terpenes and isoprene in the eastern United States, have moved O3 chemistry to the NOx-limited regime, focusing additional emission controls on large emitters (Hales, Citation2003; NARSTO, Citation2000; National Research Council [NRC], Citation1991).
VOCs are commonly sampled in stainless-steel canisters or Tedlar bags (Gholson et al., Citation1989; Koziel et al., Citation2005; McClenny et al., Citation1991) for gas chromatographic analysis in the laboratory. U.S. EPA’s (Citation2017b) Photochemical Assessment Monitoring Stations (PAMS) have acquired a large database of VOC concentrations (Watson et al., Citation2001) by this method, but it is switching to continuous in situ gas chromatographs (GCs). There have been a number of attempts to produce a reliable continuous monitor, ranging from early NMHC devices using GC separation of methane (CH4) from other NMHCs and flame ionization detection (FID) to continuous, species-specific chromatographic differentiation with mass spectroscopic detection (Leinster et al., Citation1977). The accuracy, precision, and reliability of these in-situ GCs have improved since then and they continue to improve (Badjagbo et al., Citation2007). Oxygenated VOCs, including aldehydes, and other species have been investigated using canister samples (Blanchard et al., Citation2010a) and 2,4-Dinitrophenylhydrazine (DNPH) cartridges (Grosjean and Grosjean, Citation1996; Ho et al., Citation2014).
Future potential for gas instrumentation
Scheffe et al. (Citation2009) proposed an expanded gas and particle network that goes beyond compliance monitoring (Chow and Watson, Citation2008) to accomplish multiple objectives, including measurement of additional species for research, as well as source and receptor modeling. This expansion pointed to the need for measuring species such as ammonia (NH3), NOy, and oxidants other than O3. U.S. EPA’s (Citation2017g) NCore network is a step along the way, while the recently discontinued Southeastern Aerosol Research and Characterization (SEARCH) network (Hansen et al., Citation2003) and the Supersites program (Solomon et al., Citation2008) provide examples of combined regulatory and research measurements. At the other end of the spectrum are advances being made for inexpensive and portable microsensors (Dye et al., Citation2014; Snyder et al., Citation2013; Wang et al., Citation2012) and their packaging that are based on electrochemical, metal oxide semiconductor, and optical principles. Although these are not yet comparable to reference methods (South Coast Air Management District [SCAQMD], Citation2017), their development is ongoing and rapid.
Remote sensing of air quality from space is also improving (Hidy et al., Citation2009; Hoff and Christopher, Citation2009) from the first application by Randerson (Citation1968). With continuing experience analyzing and interpreting remote sensing and satellite based observations for gases (especially O3, NO2, CO, and formaldehyde) and for particles (Fishman et al., Citation2008; Wetzel et al., Citation1995), these are becoming a useful complement to ground-based measurements, although satellite-based estimates are limited to spatial scales of 10–30 km, cloudless periods, and daylight hours. Gibbs (Citation2017) outlines surface-based potential for spectroscopic measurements with instruments having open path lengths of 5–200 m. This capability is considered a candidate reference method by the U.S. EPA for O3, NO2, and CO.
Aerosol particles
PM has been recognized for centuries as a pollutant through its visible plumes, widespread smoke, and deposition to surfaces (Halliday, Citation1961). PM is a complex mixture of components ranging from <~0.002 to ~30 µm aerodynamic diameters, limited at the low end by rapid diffusion to surfaces and at the upper end by gravitational deposition. Their chemical composition consists of hundreds to thousands of individual compounds, with the major components (>1%) operationally defined in terms of as organic carbon (OC), elemental carbon (EC, sometimes imprecisely termed black carbon, BC), sulfate (SO4), nitrate (NO3), ammonium (NH4), geological minerals (sometimes called “fugitive dust” or “Soil”), salt (NaCl), and water (Chow et al., Citation2015). These and other species, including metals, are accounted for indirectly by the total PM mass concentration. Lead (Pb) is the only element singled out as a criteria pollutant. The adverse effects of PM are well documented in toxicological, controlled human, and epidemiological studies that find PM exposure to be a significant risk to the public (Biswas and Wu, Citation2005; Chow et al., Citation2005b; Citation2006a; Eklund et al., Citation2014; Grahame et al., Citation2014; Lighty et al., Citation2000; Mauderly and Chow, Citation2008; Pope and Dockery, Citation2006). PM affects other aspects of public welfare, including visibility impairment, ecosystem and material damage, and soiling nuisances. PM components also affect weather and climate through alteration of cloud formation, precipitation, and radiative forcing (Chow et al., Citation2003; Fiore et al., Citation2015; Kleinman et al., Citation2015; Watson, Citation2002).
Particle size and mass concentration
The study of atmospheric aerosols has taken place since the 19th century, when workers characterized optical phenomena such as light scattering and absorption, with perhaps most notably for air pollution the Ringlemann smoke test to evaluate plume opacity (Griebling, Citation1952). Small particles were identified as nuclei triggering hydrometeor formation in cloud processes. An early interest in nuclei led to the use of hand-held counters employing water supersaturation by air sample expansion with subsequent deposition on a ruled plate with manual counting under a microscope (Aitken, Citation1890). These early instruments yielded a total number concentration of particles that were identified not only with clouds but also with ions present in the air. Nuclei concentrations from these devices were found to be dominated by particles of <0.1 µm diameter (Junge, Citation1954, Citation1963) and to vary geographically with contrasts between urban and rural environments (Landsberg, Citation1938; Mohnen and Hidy, Citation2010). Early studies (Whytlaw-Gray et al., Citation1923) also included optical microscopic detection and characterization of individual particles sampled on slides, and analysis by means of the electrical mobility of charged particles (Knutson and Whitby, Citation1975a, Citation1975b), revealing the complexity of particle size and composition. Optical microscopic analysis was limited by resolution of fine particles (>~0.4 µm), and prior to computerized image processing it was time-consuming for atmospheric measurements. Computer-controlled scanning electron microscopy provides a wider range of sizes and characteristics that can be classified by pattern recognition techniques (Casuccio et al., Citation1983). Junge (Citation1955) applied electrical mobility of charged particles to resolve particle size of <1 µm diameter.
Size-specific particle collection methods used for post-sampling analysis apply staged impactors, centrifuges, diffusion batteries, and size-selective inlets (Chow, Citation1995; Hidy, Citation1984a). The Lundgren (Citation1967) and MOUDI (Marple et al., Citation1981, Citation2014) impactors, combined with appropriate substrates and an after-filter, allowed for size-resolved chemical analysis (Countess et al., Citation1981; Pitchford and Green, Citation1997). Chemists at the California Air and Industrial Hygiene Laboratory made early progress in evaluating and applying size-specific measurements (Helwig and Mueller, Citation1959, Citation1960; Mueller et al., Citation1959; Mueller and Givens, Citation1961; Mueller, Citation1967).
Light-scattering intensity based on Mie theory, as distinct from Raleigh scattering of gases, has been applied in several PM systems to quantify short-duration concentration changes, although the PM/scattering relationship is highly dependent on the size distribution, chemical composition, and liquid water content (Chow et al., Citation2006b). After the 1970s, continuous particle size distributions were quantified using the Whitby aerosol analyzer (Whitby et al., Citation1972), which combined a nuclei counter, an electrical mobility analyzer, and an optical counter. This novel device showed the universal presence of different modes in the particle number, surface, or volume versus size distributions, which in turn were related to chemical composition, atmospheric transformations, and source origins (Hidy et al., Citation1980; Whitby and Sverdrup, Citation1980).
Early PM monitoring quantified blackening of filter material, as measured by attenuation of reflected or transmitted light. This measurement was implemented as British smoke (BS) (Hill, Citation1936) and the coefficient of haze (COH) (Gruber and Alpaugh, Citation1954; Hemeon et al., Citation1953) methods. BS was used to evaluate the health impact of the London smog event in 1952 and a later 1960 event in New York City (Bachmann, Citation2007). The experience gained from blackened filter monitoring in England and the United States provided important input into the decisions for a PM reference method in 1969, resulting in a gravimetric mass concentration measure using filtration.
The original PM NAAQS relied on TSP as the indicator because the monitor was widely used by the Public Health Service in the National Air Sampling Network (NASN) in 1953 (Bachmann, Citation2007). The size range defined by the peaked roof high-volume (hivol, ~1100 L/min) filter sampler was termed TSP (McKee et al., Citation1972; Watson et al., Citation1989). In the process of reviewing the PM standard, the U.S. EPA used respiratory-tract penetration information to define a new measure, “inhalable particles,” as well as a separate measure that established a distinction between fine and inhalable coarse particles (initially PM15) (Miller et al., Citation1979). The U.S. EPA then established research networks to measure both inhalable particles and PM2.5 (Spengler and Ferris, Citation1985; Watson et al., Citation1981). These data permitted replacement of the TSP indicator with 24-hr and annual average PM10 indicators in 1987. The PM2.5 indicator was established in 1997 and with limits revised in 2006 (Bachmann, Citation2007; Cao et al., Citation2013).
shows how filter-based PM samplers have evolved since the 1950s from the TSP devices to refinements by selective particle size fractions. Medium-, low-, and mini-volume (i.e., medvol, ~113 L/min; lovol, 16.7 L/min; minivol, 5 L/min) samplers had smaller footprints and power requirements and could accommodate filter materials less prone to artifacts and more amenable to chemical analysis (Chow and Watson, Citation2013; Watson and Chow, Citation2011). These samplers draw air through a filter for 24-hr durations and the filters are weighed before and after sampling, with the net weight divided by the sample volume to determine TSP, PM10, and PM2.5 mass concentrations.
Figure 1. Evolution of PM filter samplers from the 1950s to present, from upper left to lower right.
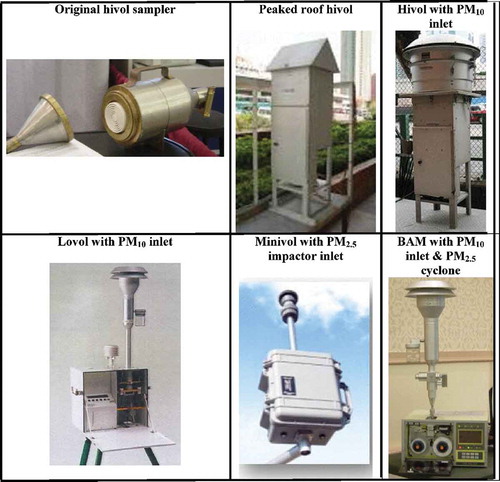
The early monitoring for TSP had a major flaw from the filter media initially used. The hivol sampler’s glass-fiber filter was found to adsorb gases such as SO2 and nitric acid (Lee and Wagman, Citation1966; Spicer and Schumacher, Citation1979), resulting in the later use of Teflon-membrane filters in lovol samplers. In the 1980s, a Teflon-coated glass fiber filter was developed to counteract the SO2 interference (Mueller et al., Citation1983b). The particulate nitrate interference required use of a denuder for removing NOz gases during sampling (Bowermaster and Shaw, Citation1981; Chow et al., Citation2005a; Hansen et al., Citation2003; Sickles and Hodson, Citation1989). Quartz fiber filters are known to adsorb organic vapors (Chow et al., Citation2010a), and measures must be taken to correct for this (Watson et al., Citation2009). Teflon-membrane filters have been found to be the most stable substrate for precise and accurate gravimetric measurements (Feeney et al., Citation1984).
Several continuous methods have been designated as Federal Equivalent Methods (FEM) suitable for compliance monitoring when they are shown to be equivalent to the hivol, medvol, or lovol Federal Reference Methods (FRM). These include the tapered elemental oscillating microbalance (TEOM) (Allen et al., Citation1997; Patashnick and Rupprecht, Citation1991), the beta attenuation monitor (BAM) (Cooper, Citation1975; Hsu et al., Citation2016; Wedding and Weigand, Citation1993), and the Grimm optical particle counter (OPC) (Grimm and Eatough, Citation2009; Hansen et al., Citation2010).
Although not currently regulated as a separate PM fraction, there is growing interest in the ultrafine particles (UP) (aerodynamic diameters <100 nm) fraction. UP is a small fraction of PM2.5 mass, but it dominates particle number (PN) concentrations (Biswas and Wu, Citation2005; Chow et al., Citation2005b; Chow and Watson, Citation2007). It is hypothesized that large PN counts overwhelm the human body’s removal mechanisms. It has been demonstrated that some of these particles can pass from the lung into the blood stream for transport into vital organs (Donaldson et al., Citation2013). This indicates that the early Aitken PN measurements systems are still relevant today.
Particle chemistry
PM chemical composition is useful for identifying potential contributors to high mass concentrations, tracking concentration changes related to emission reduction strategies (accountability), and verifying air quality models (Watson et al., Citation2016). Composition also is required to identify and quantify ambient lead concentrations to comply with the lead NAAQS. As noted earlier, major PM components are OC, EC, minerals (“soil”), SO4, NO3, NH4, and possibly Na and Cl. These components are used to calculate chemical light extinction budgets (Pitchford et al., Citation2007) in support of the U.S. EPA’s Clean Air Visibility Rule. Elements are quantified from filter samples by x-ray fluorescence (XRF) (Watson et al., Citation1999), atomic absorption spectroscopy (AAS) (Butler et al., Citation2013), or inductively coupled plasma mass spectroscopy (ICP-MS) (Michalski, Citation2016). Anions and cations are analyzed by ion chromatography (IC) (Chow and Watson, Citation1999, Citation2017), and carbon fractions (including OC and EC) by thermal/optical carbon analysis (Chow et al., Citation2007a) are applied to filter samples from the nonurban IMPROVE and urban Chemical Speciation (CSN) networks. illustrates the filter/analysis configuration currently in use, as well as other methods that can be applied to future or archived filters.
Figure 2. Filter samples are commonly acquired in PM compliance and speciation networks (IMPROVE, Citation2017; U.S.EPA, Citation2017i). Shading indicates the analyses and outputs that are currently obtained from these samples. Nonshaded boxes show additional possible analyses for source markers and secondary organic aerosol (SOA) end products applicable to sample remnants or solution extracts. More descriptions of analytical methods and specific chemical species are detailed in Chow and Watson (Citation2013) and Watson et al. (Citation2016) Abbreviations are: (1) FTIR, Fourier-transform infrared spectroscopy; (2) GRAV, gravimetric analysis; (3) IC-CD, ion chromatography with conductivity detection; (4) IC-PAD, IC with pulsed amperometric detection; (5) ICP-MS, inductively coupled plasma–mass spectrometry; (6) ID-TD-GC/MS, in situ derivatization–thermal desorption–gas chromatography/mass spectrometry; (7) TD-GC/MS, thermal desorption–gas chromatography/mass spectrometry; (8) TOC, total organic carbon analysis; (9) TOR/TOT, thermal–optical reflectance and transmittance for organic and elemental carbon (OC and EC); (10) UV-VIS, ultraviolet–visible light absorption (200–1100 nm) on filters; (11) XRF, x-ray fluorescence spectroscopy; (12) WSOC, water-soluble organic carbon; and (13) WSON, water-soluble organic nitrogen.
In situ PM chemical measurements are useful for evaluating diurnal changes and for real-time forecasting (Chow et al., Citation2008a; Demerjian and Mohnen, Citation2008; Watson et al., Citation1998a; Wexler and Johnston, Citation2008). Continuous SO4, NO3, and other ions are quantified by flash volatilization and field ICs (Chow et al., Citation2008b; Grover et al., Citation2006; Hering et al., Citation1999; Hogrefe et al., Citation2004; Weber et al., Citation2001; Weber et al., Citation2003). Limited elemental analysis on BAM filter tapes is possible (Watson et al., Citation2012), and the filter tape system has been incorporated into continuous XRF elemental monitors (Kimoto et al., Citation2010; Yanca et al., Citation2006). The aerosol mass spectrometer (AMS) (Jayne et al., Citation2000; Nash et al., Citation2006) has partially implemented the ideal of Friedlander (Citation1970, Citation1971) to quantify size and chemical composition with high time-resolution. The aerosol chemical speciation monitor (ACSM) (Ng et al., Citation2011) uses principles similar to the AMS, but with less complexity, for long-term monitoring of several major PM components. Several in situ instruments couple aerosol collection, thermal desorption, and GC and/or MS detection for selected (usually nonpolar) organic compounds (Cropper, Citation2016; Goldstein et al., Citation2008; Williams et al., Citation2007).
Since the 1900s Pb has been regarded as a highly toxic chemical. By the 1960s, airborne lead in cities associated with vehicle exhaust was being monitored nationally. In 1978, a NAAQS was promulgated limiting lead concentrations in the air based on elemental analysis of samples on TSP glass-fiber filters. The designation of the latter sampling medium has been retained even though in the 1960s to 1980s it was well known that most of the lead of historical exposure resided in the smaller than PM2.5 range from combustion of leaded motor vehicle fuels (Habibi, Citation1970; Mueller et al., Citation1964). Continued focus on TSP observations for lead reflects recognition of the metal in coarse particles associated with metal-contaminated roadway and tailings dust or leaded-paint chips (Cho et al., Citation2011)
The carbonaceous fraction of PM is of increasing interest owing to its potential adverse health effects and its markers for source contributions. After the 1950s, solvent-extractable methods were adopted as OC measures (typical solvents were propanol, benzene, or water), which obtained a fraction of the PM OC and arose from concerns about potentially carcinogenic polycyclic organic matter (POMs), including polycyclic aromatic hydrocarbons (PAHs) such as benzo[a]pyrene (Colucci and Begeman, Citation1965; Hangebrauck et al., Citation1964; Thomas et al., Citation1960). Benzene-soluble organics (BSOs) were measured and reported in the 1960s (Faoro, Citation1975), as this was believed to be one PM component of concern in TSP. BSO was not limited to PAHs, however, and as greater OC speciation was achieved, BSO was abandoned. POM emissions have been regulated as HAPs, and the potential contribution of these and other complex organic compounds to observed effects and continues to be an area of active research (Kim et al., Citation2013).
Since a single solvent removes only a fraction of the OC, the sum of its mass with those of other species resulted in an underaccounting for PM mass (Mueller et al., Citation1971). PM carbon is separated into OC, EC, and sometimes carbonate carbon (CC) fractions by thermal-optical techniques (Faust, Citation1950; Huntzicker et al., Citation1982; Mueller et al., Citation1971, Citation1972a, Citation1982a, Citation1982b; Watson et al., Citation2005; Wolff and Klimisch, Citation1982). Carbon fractions are liberated at different temperatures in inert (H2) and oxidizing (2 to 10% O2 in He) environments, with the liberated carbon compounds converted to methane (CH4) for flame ionization detection (FID). Unfortunately, the differentiation between OC and EC is not completely temperature dependent, as some of the OC chars to EC as temperature rises in the inert atmosphere. This is partially compensated for by monitoring reflected and/or transmitted laser light during the analysis to quantify and correct for the charring. Still, there are differences among instruments and protocols with different heating programs and optical monitoring (Chow et al., Citation2001; Citation2004; Schmid et al., Citation2001). A standard protocol has been adopted for IMPROVE and CSN that has been kept consistent since 1986 (Chow et al., Citation1993, Citation2007a, Citation2011). This protocol allows for tracking of long-term EC reductions in response to control measures (Chen et al., Citation2012; Murphy et al., Citation2011). A semicontinuous version of the thermal/optical analyzer is in use (Bauer et al., Citation2009; Grover et al., Citation2008, Citation2009; Turpin et al., Citation1990), but it only uses transmittance for the charring correction, which differs from the reflectance correction.
Exploratory measurements of the organic composition of aerosols indicated the complexity of species from many sources (Blanchard et al., Citation2014; Cautreels and van Cauwenberghe, Citation1976; Mazurek et al., Citation1993; Schuetzle et al., Citation1975). Interest in speciated OC has expanded with identification and characterization of sources, products of atmospheric reactions, and potential adverse health effects. Studies of filter or in situ samples using various methods indicates thousands of OC species present in particles (Diab et al., Citation2015; Grabowsky et al., Citation2011). Thermal desorption from filters with GC-MS identification (Chow et al., Citation2007c; Hays and Lavrich, Citation2007; Ho and Yu, Citation2004; Ho et al., Citation2008) forgoes the need for large filter samples and solvent extractions.
Semicontinuous OC and EC measurements have emerged using thermal and optical approaches (Grover et al., Citation2009; Turpin et al., Citation1990). For BC, which is determined by its light-absorbing rather than chemical properties, the aethalometer (Hansen et al., Citation1984) is most widely used, as a more robust implementation of the BS and COHs monitors. The latest aethalometer (Drinovec et al., Citation2015) measures light attenuation at seven wavelengths (370 to 950 nm) as the filter tape collects PM and corrects for filter loading biases. This allows BC to be separated from “brown carbon” (BrC), which is related to the smoldering phase of biomass burning and (some components of secondary organic aerosols, SOA) produced by atmospheric reactions (Barrett and Sheesley, Citation2014; Chow et al., Citation2010b). The photoacoustic detection of BC and BrC (Arnott et al., Citation1999) employs a principle discovered by Alexander Graham Bell (Citation1881) in which light-absorbing particles are illuminated with a modulated laser, thereby creating heating and cooling of the surrounding air that manifests itself as a sound wave detected by a sensitive microphone.
An important differentiation of OC derives from its sources. Primary organic aerosol (POA) is identified with emission sources, while SOA is the product of atmospheric reactions of VOCs and other species (Poschl, Citation2005; Robinson et al., Citation2010). The difference is important since POA and SOA have distinct chemical compositions, size distributions, and sources. SOA contains more oxygenated material than POA, and its control requires reductions in gas as well as PM emissions. Oxygenated, also termed polar, compounds do not elute well through chromatographic columns, and require derivatization for GC-MS detection (Halket and Zaikin, Citation2006; Ho and Yu, Citation2002; Isaacman et al., Citation2014; Orasche et al., Citation2011). The in situ AMS fragments organic compounds into patterns that have been associated with polar and nonpolar compounds, with potential for separating SOA from POA (Kroll et al., Citation2011).
Future prospects for PM measurements
BAMs are being installed at more locations for compliance purposes, owing to their ability sample every day with a 1-hr duration, their real-time data availability, and their lower manpower requirements. Aethalometers are also being operated at several locations. These are cost-effective, durable, and easy-to-use instruments.
The more complex ICs and AMS are still used mostly for special studies, as they require more expertise, manpower, and maintenance. These devices may become more routine in the future. Aerosol spectrometry will likely be an important approach for long-term monitoring for POA and SOA indicators in special cases.
Progress is still being made to exploit space-based measurements for estimating ground-level concentrations (Al-Hamdan et al., Citation2009; Alston et al., Citation2011; Catizone et al., Citation2014; Christopher and Gupta, Citation2010). For regulatory comparisons these should be seen as complements to, rather than replacements of, the ground-based measurements.
As illustrates, there is much potential to obtain more detailed chemical and optical characterization of existing filter samples. This need not be done on a routine basis, but it could be of great value for improving understanding of PM effects on visibility and climate, better quantifying source contributions through more specific marker species, and understanding secondary PM formation processes. Since most of these filters and their extracts are archived, the potential exists to better evaluate the effects of specific emission reduction strategies.
There is continuing development of low-cost, low-power sensors for PM mass, number, and chemical composition (Jovasevic-Stojanovic et al., Citation2015; Marc et al., Citation2012; Snyder et al., Citation2016; Syms and Wright, Citation2016; Zhang et al., Citation2016). There are the same cost/accuracy considerations as there are for the gas monitors, but there may be a reasonable trade-off between improved spatial and temporal resolution at the expense of some accuracy and precision. In situ organic speciation using a limited set of compounds relative to sources, atmospheric chemistry, and health-relevant indicator species could appear in the next several years.
Dry and wet deposition
Deposition measurements have been of interest in the study of welfare effects such as material damage, acid rain, and nutrient loadings to water bodies. Deposition measurements also have been used to constrain regional-scale air quality model results for addressing secondary NAAQS intended to protect public welfare. Dry deposition is difficult to measure directly. Simple methods were adopted for dry collection, including glass plates or buckets for particle fallout (Egami et al., Citation1989; Gruber and Jutze, Citation1957), treated surfaces (Davidson et al., Citation1985), and sensitive vegetation (Hart et al., Citation1988; Temple et al., Citation1981; Wesely and Hicks, Citation1977). These early techniques yielded useful qualitative data for characterizing deposition, but they lacked the ability to produce quantitative data that could be linked to ambient concentrations. Contemporary dry deposition has been inferred from the product of ambient gas or particle concentrations and deposition velocities determined from measurements under similar surface and meteorological conditions (Hicks et al., Citation1980, Citation1985; Hicks and McMillen, Citation1988). U.S. EPA’s CASTNeT (Baumgardner et al., Citation1999; Lavery et al., Citation2009; Mueller, Citation2003; EPA, Citation2017j) program acquires week-long averages of species important to dry deposition, along with meteorological data, to select deposition velocities. Dry deposition estimates are somewhat artificial since they depend on rates determined in limited terrain and seasonal conditions and do not reflect complex surface geography (Ma and Daggupaty, Citation2000; Sickles and Shadwick, Citation2015), but they allow trends to be detected when consistently measured over many years.
Wet deposition is measured using a bucket to collect water samples, having an automatic opening covering when precipitation is occurring. The collected water is transferred to a laboratory for anion and cation analysis (Coffey et al., Citation1984; Hidy et al., Citation1984; Hidy, Citation1984b; Lynch and Kerchner, Citation2005; Smith, Citation1852). This method is an extension of early methods of precipitation sampling (Ducros, Citation1815; Smith, Citation1852) using open buckets to estimate total deposition, not only collecting rainwater, but fallout of vegetation debris, insects, and so on. With companion measurements of precipitation rate, wet deposition is reported in terms of precipitation water concentration and rate of wet deposition. Considerable effort was made by the National Atmospheric Deposition Program (NADP, Citation2017) and other initiatives (Topol and Schwall, Citation1986; Watson et al., Citation1991) to evaluate the bucket sampler and ensure that the observations were reproducible and comparable over a broad range of site locations. Other than sample preservation to minimize chemical processes taking place after collection, there remains ambiguity in sampling for snow and ice particles using the bucket design.
Future prospects for deposition measurements
For dry deposition, improvements in the well-known vertical gradient method (Horváth et al., Citation1998) could be implemented, particularly in instrumenting a spatially diverse network in susceptible ecosystems. The CASTNeT method that relates average surface concentrations is coarse and arbitrary, but it appears to meet the needs of the ecosystem analysis and air quality modeling communities for the foreseeable future. At low priority could be sampling and chemical analysis combined with semi-automated water chemistry.
Integrity, documentation, and access
Data recording, verification, documentation, quality assessment, and dissemination are required as part of monitoring. Prior to electronic recording, scientists recorded measurements and their results in logbooks. In the early to mid 20th century, measurements were preserved using handwritten records and stripchart recordings. The main reason that hourly averages are used for most continuous measurements is that this was the minimum practical duration that could be coded by a technician interpolating strip chart traces with a ruler and recording the results on a coding sheet. Strip charts were supplanted after the 1970s with data loggers and ultimately by on-site computers (Sem et al., Citation1980). Later telecommunication linkages were made between the on-site computers and central data centers. Recording the raw data from instruments calibrated with traceable standards is the first step in establishing the integrity of the results (Watson et al., Citation2013). Essential to quantification of environmental conditions are the establishment of the accuracy, precision, and comparability of collected data.
Since the 1970s, field collection activities and laboratory analyses have been guided by the use of standard operating procedures (SOPs), which include protocols for instrument or sample record keeping, regularly-scheduled instrument performance checks, calibrations for reference gases with mixtures traceable to primary standards, and periodic audits of the data acquisition process. SOPs include calibrations for flow rates, integrity of inlet absorbers, and tests with standard particle size samples for size segregation. In the case of laboratory characterization, traceable standards are needed for calibration of analytical instruments, and temperature and humidity conditions are tracked for sample storage. Quality assurance (QA) is formalized through independent audits of field conditions, operational and custody records, collocated field and laboratory intercomparisons, and tracing through the process of data validation (Chow et al., Citation2011; TNI, Citation2016; EPA, Citation2007, Citation20132013, Citation2017m; Watson et al., Citation2013). illustrates the QA process. Although this “ideal” framework is specified, it’s unclear how closely the requirements are followed in practice. Some low-molecular-weight hydrocarbons and substituted aromatics measured in PAMs are suspect (Blanchard et al., Citation2010a, Citation2010b; Parrish and Fehsenfeld, Citation2000). The degree to which formal data quality verification is followed in special research campaigns is often variable and requires careful reading of the methodology in such studies and sometimes consultation with investigators to insure the comparability of data relative to long-term records.
Figure 3. Schematic diagram of the data verification process (Environment Canada, Citation2015).
Data validation can be a tedious process of record checking for instrument or sampling-analytical performance. Raw data (termed “Level 0”) need to be edited and flagged for instrument downtime, zero and span checks, obvious electronic noise, and data anomalies (e.g., sudden spikes not associated with plume encounters, deviations from expected diurnal cycles, deviations from zero and span values, and concentrations less than zero. Data are considered at “Level 1” validation after this. Level 2 validation involves examining relationships among data from different sources. This is especially relevant to speciated PM2.5 and involves comparing the sum of measured species with gravimetric mass, balancing anions with cations, and comparing redundant measurements (such as S by XRF and SO4 by IC). Level 3 validation takes place during the data analysis process, as illustrated by the PAMS analysis cited in the preceding. Level 3 does not necessarily invalidate the data, but it serves to warn other analysts of potentially suspect values. Unfortunately, most data sets never go through the Level 3 process.
For archiving, at or below the detection limit, data may be arbitrarily reported at one-half the “detection limit” or zero (Kushner, Citation1976). For low concentrations, detection limit needs to be precise in definition. There is a difference between lower detection limit (LDL), the smallest concentration that a method can recognize a positive response, and the lower quantifiable limit (LQL), which is the smallest that can be quantified in an environmental sample (defined as one standard deviation of the dynamic blank or the LDL, whichever is higher). Arbitrary or ambiguous assignment of a low concentration below an LQL can potentially introduce a positive bias in reported long-term trends of an unknown magnitude. In much of the historic monitoring data, accounting for quantification of low levels is not possible. The detection limit issue is just one example of the need to document the validation of openly reported data. This documentation will aid users to qualify results and perform analysis relative to other studies.
The history of organizing and releasing air quality data has a complex and tortured path since the 1960s (NRC, Citation2007). Precomputer data were reported in paper tabulations with minimal descriptions of acquisition and verification. Many of these reports are difficult, if not impossible, to find. To alleviate this, several agencies are scanning them into historical archives, and individual investigators are posting them on scientific networking sites (e.g., researchgate.net). With the advent of computer processing and access in the 1970s, data were acquired, and stored in large central facilities using magnetic tapes. Access by individual investigators was still difficult and depended on requests submitted to the archivists. Early attempts to organize data collections resulted in cumbersome and expensive development of software for storage and access. As the mini- to microcomputers became available after the 1980s, data management improved in “simplicity” and user-friendliness, but it was still necessary for the data archiver to extract the data, record the data on compatible media, and physically send them to the user. Today, access to many data sets is available to researchers and the public via the Internet. A “tragedy” in this transition is that many major, costly studies and early data collections have been lost or have not been converted to the contemporary access levels. These collections preceded and justified major changes in pollutant emissions and ambient conditions, but they are largely lost to investigators interested in long-term changes in emissions and concentrations, or to health and ecological trend studies requiring such data. Data curation requires a long-term commitment that is not always available. For example, the North American Research Strategy for Tropospheric Ozone (NARSTO) data repository (NARSTO, Citation2009) that was intended to be such an archive sponsored in perpetuity by NASA now returns the message, “The page you requested was not found.”
Attempts have been made to construct data management frameworks for complex and heterogeneous data sets (Hackney et al., Citation1994). Such frameworks are difficult to design, organize, and maintain, especially when they need to accommodate emission inventories, combined gas and particle data at the surface or aloft in aircraft overflights, and remotely sensed spectral information. In the 1980s, the federal government sought to construct a massive data management system for air monitoring combined with the national emission inventory. Initial public access into the federal system was cumbersome, but continuing evolution of accessibility has improved.
Network design and operations
Air quality measurement systems can be expensive to establish and operate, and their deployment needs to be planned to achieve stated goals. Although compliance is the main purpose of most networks, they are also important for tracking trends, providing health alerts and forecasts (when data are available in real time), determining source contributions, relating concentrations to adverse effects, and evaluating air quality models. The State and Local Air Monitoring Stations (SLAMS) (EPA, Citation2017h) provide the backbone for criteria pollutant compliance monitoring. The National Air Monitoring Stations (NAMS) are a SLAMS subset intended to operate over long periods to track trends. The National Air Toxics Trends Stations (NATTS) EPA, Citation2017k) quantify HAPs and their changes with time. A near-road NO2 network was recently established to evaluate potentially higher exposures near traffic sources (EPA, Citation2017f). The IMPROVE (IMPROVE, Citation2017), CSN (EPA, Citation2017i), NCore (EPA, Citation2017g), PAMS (EPA, Citation2017b), CASTNeT (EPA, Citation2017j), and NADP (NADP, Citation2017) networks have been discussed previously. Other federal, state, and local agencies also operate air quality monitors for special studies and long-term trends. Although it may seem that these networks are redundant, many of their instruments are collocated for QA of instrument performance. NCore sites, for example, are included in NAMS, also acquire CSN samples, and most are in the PAMS network. Many of the nonurban IMPROVE sites also acquire CASTNeT and NADP samples. Several “crowd-sourced” air quality and meteorological networks (AcrobaticIndustries, Citation2017; COSM, Citation2017; Muller et al., Citation2013), in which citizens operate inexpensive monitors in outdoor and indoor environments, have been established, but the accuracy of the measurements is questionable.
Several guidance documents are available for monitor siting (Koch and Rector, Citation1987; EPA, Citation1975, Citation1997, Citation2012; Watson et al., Citation1998a). Most air quality monitors intend to represent neighborhood (~1–4 km), urban (4–100 km), or regional (~100-1000 km) scales (Chow et al., Citation2002a). Concentration differences between these monitors indicate the increment contributed on that scale. Microscale (10–100 m) and middle-scale (~100–1000 m) sites are termed special-purpose monitors (SPMs) and are operated at roadsides and fencelines to assess source contributions. Minivol and small light scattering devices have been used effectively as SPMs for PM2.5 and PM10 (Chow et al., Citation1999, Citation2000, Citation2002b, Citation2006b), as the measurements achieved are not intended to determine compliance. The near-road NO2 sites are an exception. Non-SPM siting criteria include minimum and maximum elevations above ground level, setbacks from nearby sources (e.g., major roadways), lack of obstructions (e.g., trees, tall buildings), and collocation with other instruments. Operational criteria include long-term site commitment (favoring public facilities such as schools, fire/police stations, libraries, and government buildings), security, sufficient electric power and access, space, and environmental control (heating and cooling). These requirements may result in substantial expense and limitations on where stations are located. As noted, the use of small portable samplers can ease many of these constraints.
The raison d’etre of the national long-term monitoring networks has evolved to address various clean air regulations, with NAAQS compliance being the most prominent. Changes in air quality with emissions appear in long-term averaging, which reduces meteorological “noise.” Documenting such changes reveals the success versus disappointments of management decisions. One well-known 1980s example documented the partial failure of a VOC-based control for O3 reduction, leading to modification of Title 1 requirements in the 1990 CAA and increased emphasis on NOx reduction in the 1990s (Hales, Citation2003; Hidy et al., Citation2000; NRC, Citation1991). Long-term data from air monitoring also facilitated a number of epidemiological studies addressing PM size fractions, which assisted in rationalizing PM NAAQS revisions.
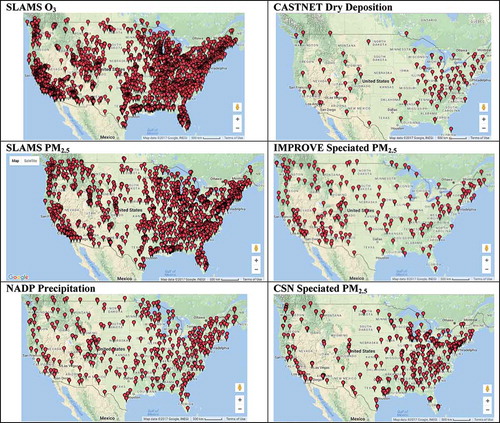
U.S. data are also useful to benchmark U.S. environmental quality with that in other countries, especially in North America (Hidy et al., Citation2011). Data have been used to test multi-spatial scale models of source-ambient concentration relationships and air chemistry, and for verifying or projecting conditions resulting from different emission reduction strategies. As indicated in the examples of , long-term data are limited by their spatial coverage and pollutant specificity. The data are also limited by temporal coverage using consistent measurement methods. Needs for testing hypotheses of theoretical chemistry include VOCs, various reactive nitrogen and condensed carbon components, and a host of other trace species, only a fraction of which are currently available. Testing of models at low concentrations at or near the LDLs or LQLs is of interest for today’s models to distinguish statistically occurrences where averaged model and measured values may diverge.
Figure 4. Examples of monitoring locations for selected pollutants from long-term continental U.S. networks. More specific maps by pollutant and location are available online (CIRA, Citation2017; EPA, Citation2017c).
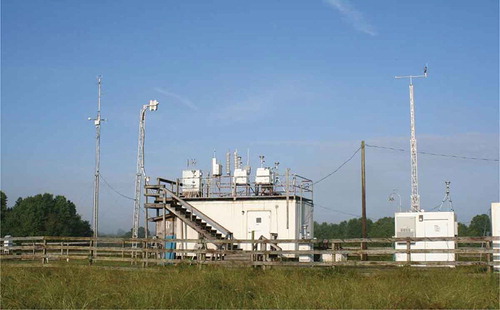
Advances in atmospheric chemistry since the 1960s have benefited from hypothesis testing during “small” field campaigns versus “big science” studies with major investments in intellectual and material resources. Big science studies generally are funded in excess of 2016 US$ 10 million. Solomon et al. (Citation2000) inventoried international oxidant studies, and identifies several of the subsequent U.S. air quality initiatives and their objectives, showing a continuing interest in O3 and PM even after more than a half century of study. Small resource initiatives are exploratory with less formal attention given to study design. Larger efforts have required more careful planning to achieve study goals, recruit sponsors, and coordinate efforts of multiple investigators. A typical station used for large comprehensive field studies is shown in . Such stations include both criteria gas and PM measurements, meteorological observations, and addition gas and PM observables to meet research objectives.
Table 1. Example field programs characterizing U.S. air quality after 1990.
Figure 5. Example of a contemporary SEARCH station measuring gases and particles along with surface meteorological parameters at nonurban location in Yorkville, GA, that acquired data during 1999–2016. (Photo courtesy of Eric Edgerton.)
Large or major field experiments often begin with an exploratory program that creates hypotheses that need to be tested at additional locations, over longer time periods, and with an increased number of observables. For example, the Pasadena aerosol study of 1969 (Hammerle and Pierson, Citation1975; Hidy et al., Citation1972; Lundgren, Citation1972; Miller et al., Citation1972; Mueller et al., Citation1972a, Citation1972b; Novakov et al., Citation1972) paved the way for the more comprehensive Aerosol Characterization Experiment (ACHEX) in the early 1970s (Hidy et al., Citation1974a, Citation1974b; Hidy, Citation1974, Citation1975).
The technical literature has “exploded” since the 1960s and is full of complex studies generating new data and interpretations. The history of acquiring data from these studies begins with limited access controlled by investigators for “first-rights-of-analysis.” Data from many large studies are never released for public scrutiny. With several NAAQS becoming more stringent based on these studies, public access to special-study data has become policy relevant. Specialized studies and field experiments, especially as practiced today, produce heterogeneous collections that are often poorly documented and poorly organized for public use or comparability with long-term data. Thorough planning and documentation of operations and QA were major components of coordinated studies after the 1970s (Blumenthal et al., Citation1993; Hansen et al., Citation1983; Mueller et al., Citation1980, Citation1982b, Citation1983a; Mueller and McDade, Citation1986; Tombach et al., Citation1987; Topol et al., Citation1983; Watson et al., Citation1988, Citation1998b). More recent field campaigns have been of the form where an agency such as the National Oceanic and Atmospheric Administration (NOAA) or National Aeronautics and Space Administration (NASA) provides an infrastructure in which academic researchers with specialized instruments and external sponsorship (usually the National Science Foundation or the U.S. EPA) participate. The use of historical data for insights about pollution reduction or atmospheric chemistry is often neglected in favor of applying and testing new instruments or methods. There is a history of costly studies over the years whose sponsors and investigators did not support more in-depth analysis and interpretation of the acquired data.
Study design falls within two extremes: (1) a single site with an array of basic (criteria pollutant) and experimental instrumentation to address details of chemistry, and (2) a spatially diverse program with limited advanced instrumentation superimposed on a backbone network to characterize multiple-scale phenomena. Emissions and meteorology are often drawn from other sources. Measurements aloft are acquired by tall towers, balloons, or aircraft, or inferred from space-based sensors. Special project durations may range from a few weeks to a year, with enhancements during forecasted episodes of high concentrations.
Measurement campaigns may be scheduled only to find the sampling period preselected based on “climatology” does not experience the intense pollution events that are major study objectives. This occurred during ACHEX, when the first summer study yielded no cases of intense smog, and Dr. Mueller made the case for additional sponsorship to add the next summer. Another example is the Southeastern Ozone and Aerosol Study (SOAS), which in 2013 (Carlton et al., Citation2013) encountered unusually clean air in Alabama for most of the 6-week sampling period.
Study planners are often asked, “How many samples are needed?” A standard answer is “The more the better,” but this is not always practical or acceptable to sponsors. The Massive Atmospheric Transport Experiment (MATEX) design (Hidy et al., Citation1985a, Citation1985b, Citation1987) went to great lengths to evaluate methods and costs for establishing the influence of long-range transport of power-plant sulfur emissions in the eastern United States using reactive sulfur isotopes combined with nonreactive chlorohydrocarbon tracer gases. This analysis established that the simple concept of co-released reactive and nonreactive gases was impractical owing to the high costs for sulfur isotopic plume tracing and ambient sampling. MATEX evolved into a simpler design, the EMEFS (Hidy, Citation1987; AES, Citation1993; Ruff et al., Citation1985), which favored spatial monitors placed specifically for improved model evaluation. The EMEFS design did not analyze the need for sites to characterize both regional-scales >100 km and neighborhood to urban scales <100 km. Analysis of this “nesting” component would have been welcome to both modelers and measurers.
Field programs require well-trained field and laboratory technicians, as well as knowledgeable supervisors. Study logistics involve maintenance of shelters, equipment, and sampling methods through a range of weather conditions. In addition, the logistics of supplying the sites with gases, filters, and other equipment in a timely way is essential to minimize risk of losing a sequence of data for future analysis. Maintaining spare instrumentation for replacement of the inevitable broken units is also essential for the operations. Even in cases of a campaign covering 1 to 2 months, the success of experiments depends on continuous operations, timely calibrations, and scheduled audits. If careful attention to these “housekeeping” activities is not given, the project can fail to achieve its goals.
Resources and sponsorship
Underlying the preceding discussion is the practical limitation of scientific ideal versus available resources. Resources need to come from multiple institutional sponsorships, including participation from the federal, state, local, and private sectors. The participation of multiple stakeholders, including both the regulated and regulating bodies, throughout the processes of experiment design, field sampling, laboratory analysis, data verification and dissemination, data analysis and modeling, and reporting greatly facilitates the acceptance of study conclusions. The coordination of sponsors and contributors needs to have concurrence from a hierarchy of decision makers. This requires involvement of both technical experts and policymakers, usually through the organization of separate committees representing these interests. Industry research and trade organizations, such as the Electric Power Research Institute (EPRI), the American Petroleum Institute (API), and the Coordinating Research Council (CRC), have developed mutual benefits and trust by working with regulators such as the U.S. EPA and California Air Resources Board (CARB). When there is a common belief that “good science makes for good policy,” private–public sector cosponsorship with stakeholder buy-in has been an important element for successful environmental research.
A good example of this approach is NARSTO (Citation2017) (duration 1994–2012), which included participants from the U.S., Canadian, and Mexican governments, universities, and industries. NARSTO’s goal was to develop policy-relevant scientific perspectives on ozone and related atmospheric science applicable to the North American continent. The goal was to be achieved through experiments, data analysis and interpretation, and context of experience from past and ongoing research. In addition to coordinating a major field program in the eastern United States and supporting a study in southern California, NARSTO produced several reviews and supporting information by widely recognized scientists, which greatly assisted in informing policymakers about multinational perspectives that were important for air quality management (Hales, Citation2003; Hidy et al., Citation2011; McMurry et al., Citation2004; Mobley et al., Citation2005). Other examples of multi-institutional partnerships include the long-standing motor-vehicle and other industry support of the Health Effects Institute (HEI) and the interactions with National Institute for Environmental Health Sciences (NIEHS). Through the National Research Council (NRC), environmental research has been reviewed critically since the 1960s. The U.S. EPA also has a long-standing grant program that has been coordinated with the National Science Foundation to support academic research.
Measurement accessibility and the products of research
Accessibility to both data collections and products of analysis and interpretation is an important element of the measurement “paradigm.” The emergence or “publication” of such data also should be timely to insure adequate recognition and attention from the use community in policy refinements. This requirement is almost universally neglected in the planning and execution of measurement programs. Often the user community, especially policymakers, is aware of measurements and experiments, but their results do not make a timely entry into information debates, or regulatory assessments that are used to inform policymakers. This limitation is inherent in the time scales for substantive advancement of knowledge versus the regulatory time schedule for decision making. Timeliness is critical in experimental design and execution if they are to be useful to stakeholders. Methods to address a range of questions by interpreting large targeted databases have reached the air quality literature in recent years (Blanchard et al., Citation2013a, Citation2013b; Hand et al., Citation2012a, Citation2012b, Citation2014; Hidy et al., Citation2014; Murphy et al., Citation2011; U.S.EPA, Citation2017l). In contrast, relatively little has been done to integrate the data from many different and potentially overlapping projects that add spatial and temporal information to analyses presented in the literature. Part of this is due to insufficient sponsorship for data analysis, which has been a chronic issue in large projects long before the contemporary air quality studies. Many study investments lose financial support for in-depth analysis beyond summary statistics at the end of the field exercises (e.g., Atmospheric Environment Service [AES], Citation1993; Mueller et al., Citation1982b; Tombach et al., Citation1987). There are a few examples of substantial investment in analysis of data. These include the SURE (Mueller et al., Citation1980), many publications on the IMPROVE-CSN and SOS-SEARCH projects (Chameides and Cowling, Citation1995), and the New York State Energy Research and Development Authority (NYSERDA) efforts to add analysis and interpretation to its field studies. Measurements, representing good atmospheric science accessible in public forums, have proven to be essential for public policy development. Over the years, some observational scientists have overtly tried to bring their work to inform policymakers through various means, ranging from oral briefings, to formal conferences, to written communications. Other means have been effective, including participation in advisory groups for the U.S. EPA and other entities (e.g. the EPA Science Advisory Board, and the Clean Air Scientific Advisory Committee), CARB, cooperative entities like the Southern Appalachian Mountains Initiative (SAMI) (National Park Service [NPS], Citation2002), regional planning organizations (Kinsman and Mathai, Citation2014), and the NRC. Through these routes the measurement analyses have found their way into approaches for pollution management, achieving a practical balance between historical and future public risk.
Summary
Chemical species monitoring for risk characterization began, in today’s terms, with a crudely specified set of sensors and data collectors minimally describing urban conditions and major plume exposure. Over the years since the 1960s monitoring technology has advanced to provide for automated and archived quantitative measurements for the criteria pollutants that cover major regions of the United States for urban and nonurban conditions. The measurement process has expanded from instrumentation and siting alone to a complex system aimed at documenting changing risk to humans and ecosystems in time and space, with data accessible to stakeholders and the general public.
Data acquired from research measurements have also expanded with major public investment in specialized studies involving surface and aircraft observations. The combination of monitoring and experimentation has enhanced knowledge of atmospheric processes that extend the ability to develop computerized air quality models that parallel meteorological models. The elements of the environmental measurement system embedded in the principles articulated by the NRC (Citation2007), summarized in , now receive attention from the scientific community. Future activities of the measurement community will continue to enhance the national capabilities and provide adequate stewardship of data resources.
Table 2. Environmental Data Management Principles (NRC, 2007).
The remaining questions relate to the significance or value of the large collection of measurements, and their analysis and interpretation have affected public policy. Historically, the 1950s to 1970s brought forth a range of “good” science and “bad” science (or perhaps more appropriately, “primitive” science) that affected decisions. However post-1980 contemporary air monitoring as prescribed in the CAA and scientific campaigns seeking knowledge of atmospheric chemistry provides an important, scientifically well-founded, objective basis for environmental policymaking. There are numerous examples of key information from ambient measurements ranging from selective reduction of pollution emissions to indicators of human exposure to air toxins. Measured long-term trends in criteria and related pollutants have given policymakers confidence that exposure risks are being reduced across the United States. North American policies for changes in acid-forming species measured from deposition have constrained the effects of these species affecting terrestrial and aquatic ecosystems. The measurements have given the public and policymakers’ perspective on the limits of pollution management in relation to natural sources of atmospheric gas and particle components.
Researchers who acquire measurements for various purposes logically hope that their communicated results have a tangible influence on processes for environmental risk reduction. It is often difficult to identify the influence of specific research in the policymaking arena, but every study adds to the “weight of evidence” (Linkov et al., Citation2009) that is needed to make good decisions. This CR also represents a possible crossroads for the A&WMA critical reviews. The long-standing contributions of atmospheric chemistry have created technical solutions to problems that have matured air quality management in the United States. Continued research based on measurements will inform management practitioners, but may need different communication media for A&WMA members.
Acknowledgment
Acknowledgement is expressed here to our many colleagues for their contributions to measurement technologies over the years, without whom the current state of the art would be far behind in its evolution; and to our sponsors of monitoring and field research whose major investment made possible the sustained effort to characterize air chemistry and its potential for exposure risk to the public and to our neighboring ecosystems. The authors appreciate the comments and suggestions of John Bachmann, retired from the U.S. Environmental Protection Agency, for improving the initial draft of this article.
Additional information
Notes on contributors
George M. Hidy
The authors are long-term members of the Air & Waste Management Association (A&WMA) and its Critical Review and Publication Committees, and have made many contributions to the Journal of the Air & Waste Management Association (JA&WMA), EM Magazine, annual meetings, and specialty conferences.
Dr. George M. Hidy currently is a principal of Envair/Aerochem, a former co-editor of JA&WMA, a former chair of the Critical Review Committee, and author of the 1984 and 2010 A&WMA Critical Reviews.
Peter K. Mueller
Dr. Peter K. Mueller is a principal of Tropochem and the longest continuing member of A&WMA (65 years).
Samuel L. Altshuler
Samuel L. Altshuler is an air quality consultant and former member of the Bay Area Air Quality Management District advisory board.
Judith C. Chow
Dr. Judith C. Chow is a research professor at the Desert Research Institute, a former chair of the Critical Review Committee, and author of the 1995 A&WMA Critical Review.
John G. Watson
Dr. John G. Watson is a research professor at the Desert Research Institute, a former chair of the Critical Review Committee, and author of the 2002 A&WMA Critical Review.
References
- Acrobatic Industries. 2017. Smart citizen system. Acrobatic Industries. https://acrobotic.com/smart-citizen ( accessed March 1, 2017).
- AES, 1993. The Eulerian Model Evaluation and Field Study (EMEFS) for acid deposition. Atmospheric Environment Service (AES), Environment Canada, Ottawa, ON.
- Aitken, J. 1890. On a simple pocket dust-counter. Proceedings of the Royal Society of Edinburgh XVIII:39–53.
- Al-Hamdan, M.Z., W.L. Crosson, A.S. Limaye, D.L. Rickman, D.A. Quattrochi, M.G. Estes, J.R. Qualters, A.H. Sinclair, D.D. Tolsma, K.A. Adeniyi, and A.S. Niskar. 2009. Methods for characterizing fine particulate matter using ground observations and remotely sensed data: Potential use for environmental public health surveillance. J. Air Waste Manage. Assoc. 59:865–81. doi:10.3155/1047-3289.59.7.865
- Allen, G.A., C. Sioutas, P. Koutrakis, R. Reiss, F.W. Lurmann, and P.T. Roberts. 1997. Evaluation of the TEOM method for measurement of ambient particulate mass in urban areas. J. Air Waste Manage. Assoc. 47:682–9. doi:10.1080/10473289.1997.10463923
- Alston, E.J., I.N. Sokolik, and B.G. Doddridge. 2011. Investigation into the use of satellite data in aiding characterization of particulate air quality in the Atlanta, Georgia metropolitan area. J. Air Waste Manage. Assoc. 61:211–25. doi:10.3155/1047-3289.61.2.211
- Altshuller, A.P., C.M. Schwab, and M. Bare. 1959. Reactivity of oxidizing agents with potassium iodide reagent. Anal. Chem. 31:1987–90. doi: 10.1021/ac60156a030.
- American Society for Testing Materials International. 2017. Annual book of ASTM standards. Conshohocken, PA: American Society for Testing Materials International.
- Anderson, J.G. 1987. Free radicals in the Earth’s atmosphere: Their measurement and interpretation. Annu. Rev. Phys. Chem. 38:489–520. doi:10.1146/annurev.physchem.38.1.489
- Arnott, W.P., H. Moosmüller, C.F. Rogers, T. Jin, and R. Bruch. 1999. Photoacoustic spectrometer for measuring light absorption by aerosol: Instrument description. Atmos. Environ. 33:2845–52.
- Atmospheric Environment Service. 1993. The Eulerian Model Evaluation and Field Study (EMEFS) for acid deposition. Atmospheric Environment Service (AES), Environment Canada, Ottawa, ON. https://nepis.epa.gov ( accessed March 1, 2017).
- Bachmann, J.D. 2007. Will the circle be unbroken: A history of the US national ambient air quality standards—2007 Critical review. J. Air Waste Manage. Assoc. 57:652–97. doi:10.3155/1047-3289.57.6.652
- Badjagbo, K., S. Moore, and S. Sauve. 2007. Real-time continuous monitoring methods for airborne VOCs. Trends Anal. Chem. 26:931–40. doi:10.1016/j.trac.2007.07.004
- Barrett, T.E., and R.J. Sheesley. 2014. Urban impacts on regional carbonaceous aerosols: Case study in central Texas. J. Air Waste Manage. Assoc. 64:917–26. doi:10.1080/10962247.2014.904252
- Bauer, J.J., X.Y. Yu, R. Cary, N. Laulainen, and C. Berkowitz. 2009. Characterization of the Sunset semi-continuous carbon aerosol analyzer. J. Air Waste Manage. Assoc. 59:826–33. doi:10.3155/1047-3289.59.7.826
- Baumgardner, R.E., S.S. Isil, J.J. Bowser, and K.M. Fitzgerald. 1999. Measurements of rural sulfur dioxide and particle sulfate: Analysis of CASTNET data, 1987 through 1996. J. Air Waste Manage. Assoc. 49:1266–79. doi:10.1080/10473289.1999.10463966
- Bell, A.G. 1881. Production of sound by radiant energy. Manufact. Builder 15:156–8. doi:10.1080/14786448108627053
- Biswas, P., and C.Y. Wu. 2005. 2005 Critical çeview: Nanoparticles and the environment. J. Air Waste Manage. Assoc. 55:708–46. doi:10.1080/10473289.2005.10464656
- Blanchard, C.L., G.M. Hidy, and S. Tanenbaum. 2010a. NMOC, ozone, and organic aerosol in the southeastern United States, 1999–2007: 2. Ozone trends and sensitivity to NMOC emissions in Atlanta, Georgia. Atmos. Environ. 44:4840–9.
- Blanchard, C.L., G.M. Hidy, S. Tanenbaum, R. Rasmussen, R. Watkins, and E. Edgerton. 2010b. NMOC, ozone, and organic aerosol in the southeastern United States, 1999–2007: 1. Spatial and temporal variations of NMOC concentrations and composition in Atlanta, Georgia. Atmos. Environ. 44:4827–39.
- Blanchard, C.L., G.M. Hidy, S. Tanenbaum, E.S. Edgerton, and B.E. Hartsell. 2013a. The Southeastern Aerosol Research and Characterization (SEARCH) study: Temporal trends in gas and PM concentrations and composition, 1999–2010. J. Air Waste Manage. Assoc. 63:247–59. doi:10.1080/10962247.2012.748523
- Blanchard, C.L., G.M. Hidy, S. Tanenbaum, E.S. Edgerton, and B.E. Hartsell. 2013b. The Southeastern Aerosol Research and Characterization (SEARCH) study: Spatial variations and chemical climatology, 1999–2010. J. Air Waste Manage. Assoc. 63:260–75. doi:10.1080/10962247.2012.749816
- Blanchard, C.L., J.C. Chow, E.S. Edgerton, J.G. Watson, G.M. Hidy, and S. Shaw. 2014. Organic aerosols in the southeastern United States: Speciated particulate carbon measurements from the SEARCH network, 2006 to 2010. Atmos. Environ. 95:327–33. doi:10.1016/j.atmosenv.2014.06.050
- Blumenthal, D.L., F.W. Lurmann, H.H. Main, J.D. Prouty, P.G. Cleary, G.E. Start, N.R. Ricks, R.H. Thuillier, P.A. Solomon, A.W. Gertler, J.G. Watson, and J.R. Pederson. 1993. Field program plan for the San Joaquin Valley Air Quality Study (SJVAQS) and the Atmospheric Utility Signatures, Predictions, and Experiments (AUSPEX) Program. Sonoma Technology, Inc., Santa Rosa, CA.
- Bojkov, R.D. 1986. Surface ozone during the 2nd half of the 19th century. J. Climate Appl. Meteorol. 25:343–52. doi:10.1175/1520-0450(1986)025<0343:sodtsh>2.0.co;2.
- Bowermaster, J.W., and R.W. Shaw. 1981. A source of gaseous HNO3 and its transmission efficiency through various materials. J. Air Pollut. Control Assoc. 31:787–820. doi:10.1080/00022470.1981.10465279
- Bradley, C.E., and A.J. Haagen-Smit. 1951. The application of rubber in the quantitative determination of ozone. Rubber Chem. Technol., 24:750–5. doi:10.5254/1.3543103
- Brimblecombe, P. 1978. Air pollution in industrializing England. J. Air Pollut. Control Assoc. 28:115–8. doi:10.1080/00022470.1978.10470577
- Butler, O.T., W.R.L. Cairns, J.M. Cook, and C.M. Davidson. 2013. Atomic spectrometry update. Environmental analysis. J. Anal. Atom. Spectrom. 28:177–216. doi:10.1039/c2ja90077g
- Byers, D.H., and B.E. Saltzman. 1958. Determination of ozone in air by neutral and alkaline iodide procedures. Am. Ind. Hyg. Assoc. J. 19:251–7. doi:10.1080/00028895809343585
- Cao, J.J., J.C. Chow, S.C. Lee, and J.G. Watson. 2013. Evolution of PM2.5 measurements and standards in the U.S. and future perspectives for China. Aerosol Air Qual. Res. 13:1197–21. doi:10.4209/aaqr.2012.11.0302
- Carlton, A.G., A. Goldstein, J.F. Jimenez, R.W. Pinder, J. DeGouw, B.J. Turpin, A. Guenther, R.C. Cohen, P. Shepson, S. Shaw, C., Wiedinmyer, J.D. Surratt, and J. Pierce. 2013. The Southern Oxidant and Aerosol Study (SOAS): Measuring and modeling at the interface of air quality and climate change to understand biosphere‐atmosphere interactions. Rutgers University, New Brunswick, NJ. climate.envsci.rutgers.edu/soas/SOAS_White_Paper_final.pdf (accessed March 1, 2017).
- Casuccio, G.S., P.B. Janocko, R.J. Lee, J.F. Kelly, S.L. Dattner, and J.S. Mgebroff. 1983. The use of computer controlled scanning electron microscopy in environmental studies. J. Air Pollut. Control Assoc. 33:937–43. doi:10.1080/00022470.1983.10465674
- Catizone, P.A., S.E. Zell, C.R. Arrington, M.B. Newman, S.F. Weber, and R.J. White. 2014. Comparative statistical study of hourly precipitation determined by radar-based Stage IV and ground-based methods in the North Central United States. J. Air Waste Manage. Assoc. 64:291–308. doi:10.1080/10962247.2013.872209
- Cautreels, W., and K. van Cauwenberghe. 1976. Determination of organic compounds in airborne particulate matter by gas chromatography–mass spectrometry. Atmos. Environ. 10:447. doi:10.1016/0004-6981(76)90025-1
- Chameides, W.L., and E.N. Cowling. 1995. The state of the Southern Oxidants Study (SOS): Policy-relevant findings in ozone pollution research. Southern Oxidants Study, North Carolina State University, Raleigh, NC. https://www.ncsu.edu/sos/pubs/sos1/State_of_SOS_1.pdf ( accessed March 1, 2017).
- Chen, L.-W.A., J.C. Chow, J.G. Watson, and B.A. Schichtel. 2012. Consistency of long-term elemental carbon trends from thermal and optical measurements in the IMPROVE network. Atmos. Meas. Tech. 5:2329–38. doi:10.5194/amt-5-2329-2012
- Cho, S.H.-H., J. Richmond-Bryant, J. Thornburg, J. Portzer, R. Vanderpool, K. Cavender, and J. Rice. 2011. A literature review of concentrations and size distributions of ambient airborne Pb-containing particulate matter. Atmos. Environ. 45:5005–15. doi:10.1016/j.atmosenv.2011.05.009
- Chow, J.C. 1995. Critical review: Measurement methods to determine compliance with ambient air quality standards for suspended particles. J. Air Waste Manage. Assoc. 45:320–82. doi:10.1080/10473289.1995.10467369
- Chow, J.C., J.G. Watson, L.C. Pritchett, W.R. Pierson, C.A. Frazier, and R.G. Purcell. 1993. The DRI thermal/optical reflectance carbon analysis system: Description, evaluation and applications in U.S. air quality studies. Atmos. Environ. 27A:1185–201. doi:10.1016/0960-1686(93)90245-T
- Chow, J.C., and J.G. Watson. 1999. Ion chromatography in elemental analysis of airborne particles. In Elemental analysis of airborne particles, vol. 1, ed. S. Landsberger and M. Creatchman, 97–137. Amsterdam, The Netherlands: Gordon and Breach Science.
- Chow, J.C., J.G. Watson, M.C. Green, D.H. Lowenthal, D.W. DuBois, S.D. Kohl, R.T. Egami, J.A. Gillies, C.F. Rogers, C.A. Frazier, and W. Cates. 1999. Middle- and neighborhood-scale variations of PM10 source contributions in Las Vegas, Nevada. J. Air Waste Manage. Assoc. 49:641–54. doi:10.1080/10473289.1999.10463837
- Chow, J.C., J.G. Watson, M.C. Green, D.H. Lowenthal, B.A. Bates, W. Oslund, and G. Torres. 2000. Cross-border transport and spatial variability of suspended particles in Mexicali and California’s Imperial Valley. Atmos. Environ. 34:1833–43. doi:10.1016/S1352-2310(99)00282-4
- Chow, J.C., J.G. Watson, D. Crow, D.H. Lowenthal, and T.M. Merrifield. 2001. Comparison of IMPROVE and NIOSH carbon measurements. Aerosol Sci. Technol. 34:23–34. doi:10.1080/02786820119073
- Chow, J.C., J.P. Engelbrecht, J.G. Watson, W.E. Wilson, N.H. Frank, and T. Zhu. 2002a. Designing monitoring networks to represent outdoor human exposure. Chemosphere 49:961–78. doi:10.1016/S0045-6535(02)00239-4
- Chow, J.C., J.G. Watson, S.A. Edgerton, E. Vega, and E. Ortiz. 2002b. Spatial differences in outdoor PM10 mass and aerosol composition in Mexico City. J. Air Waste Manage. Assoc. 52:423–34. doi:10.1080/10473289.2002.10470791
- Chow, J.C., J.G. Watson, A. Herzog, S.M. Benson, G.M. Hidy, W.D. Gunter, S.J. Penkala, and C.M. White. 2003. 2003 Critical review discussion—Separation and capture of CO2 from large stationary sources and sequestration in geological formations. J. Air Waste Manage. Assoc. 53:1172–82. doi:10.1080/10473289.2003.10466274
- Chow, J.C., J.G. Watson, L.-W.A. Chen, W.P. Arnott, H. Moosmüller, and K.K. Fung. 2004. Equivalence of elemental carbon by thermal/optical reflectance and transmittance with different temperature protocols. Environ. Sci. Technol., 38:4414–22. doi:10.1021/es034936u
- Chow, J.C., J.G. Watson, D.H. Lowenthal, and K.L. Magliano. 2005a. Loss of PM2.5 nitrate from filter samples in central California. J. Air Waste Manage. Assoc. 55:1158–68. doi:10.1080/10473289.2005.10464704
- Chow, J.C., J.G. Watson, N. Savage, J. Solomon, Y.S. Cheng, P.H. McMurry, L.M. Corey, G.M. Bruce, R.C. Pleus, P. Biswas, and C.Y. Wu. 2005b. 2005 Critical review discussion: Nanoparticles and the environment. J. Air Waste Manage. Assoc. 55:1411–17. doi:10.1080/10473289.2005.10464743
- Chow, J.C., J.G. Watson, J.L. Mauderly, D.L. Costa, R.E. Wyzga, S. Vedal, G.M. Hidy, S.L. Altshuler, D. Marrack, J.M. Heuss, G.T. Wolff, C.A. Pope, and D.W. Dockery. 2006a. 2006 Critical review discussion—Health effects of fine particulate air pollution: Lines that connect. J. Air Waste Manage. Assoc. 56:1368–80. doi:10.1080/10473289.2006.10464545
- Chow, J.C., J.G. Watson, Park, K., Lowenthal, D.H., Robinson, N.F. and Magliano, K.L. 2006b. Comparison of particle light scattering and PM2.5 mass in central California. J. Air Waste Manage. Assoc. 56:398–410. doi:10.1080/10473289.2006.10464515
- Chow, J.C. and J.G. Watson. 2007. Survey of measurement and composition of ultrafine particles. Aerosol Air Qual. Res. 7:121–73.
- Chow, J.C., J.G. Watson, L.-W.A. Chen, M.-C.O. Chang, N.F. Robinson, D.L. Trimble, and S.D. Kohl. 2007a. The IMPROVE_A temperature protocol for thermal/optical carbon analysis: Maintaining consistency with a long-term database. J. Air Waste Manage. Assoc. 57:1014–23. doi:10.3155/1047-3289.57.9.1014
- Chow, J.C., J.G. Watson, H.J. Feldman, J. Nolan, B.R. Wallerstein, G.M. Hidy, P.J. Lioy, H.C. McKee, J.D. Mobley, K. Bauges, and J.D. Bachmann. 2007b. 2007 Critical review discussion—Will the circle be unbroken: A history of the U.S. National Ambient Air Quality Standards. J. Air Waste Manage. Assoc. 57:1151–63. doi:10.3155/1047-3289.57.10.1151
- Chow, J.C., J.Z. Yu, J.G. Watson, S.S.H. Ho, T.L. Bohannan, M.D. Hays, and K.K. Fung. 2007c. The application of thermal methods for determining chemical composition of carbonaceous aerosols: A review. J. Environ. Sci. Health A 42:1521–41. doi:10.1080/10934520701513365
- Chow, J.C., P. Doraiswamy, J.G. Watson, L.-W.A. Chen, S.S.H. Ho, and D.A. Sodeman. 2008a. Advances in integrated and continuous measurements for particle mass and chemical composition. J. Air Waste Manage. Assoc. 58:141–63. doi:10.3155/1047-3289.58.2.141
- Chow, J.C., and J.G. Watson. 2008. New directions: Beyond compliance air quality measurements. Atmos. Environ. 42:5166–8. doi:10.1016/j.atmosenv.2008.05.004.
- Chow, J.C., J.G. Watson, D.H. Lowenthal, K. Park, P. Doraiswamy, K. Bowers, and R. Bode. 2008b. Continuous and filter-based measurements of PM2.5 nitrate and sulfate at the Fresno Supersite. Environ. Monit. Assess. 144:179–89. doi:10.1007/s10661-007-9987-5
- Chow, J.C., J.G. Watson, L.-W.A. Chen, J. Rice, and N.H. Frank. 2010a. Quantification of PM2.5 organic carbon sampling artifacts in US networks. Atmos. Chem. Phys. 10:5223–39.
- Chow, J.C., J.G. Watson, M.C. Green, and N.H. Frank. 2010b. Filter light attenuation as a surrogate for elemental carbon. J. Air Waste Manage. Assoc. 60:1365–75. doi:10.3155/1047-3289.60.11.1365
- Chow, J.C., J.G. Watson, J. Robles, X.L. Wang, L.-W.A. Chen, D.L. Trimble, S.D. Kohl, R.J. Tropp, and K.K. Fung. 2011. Quality assurance and quality control for thermal/optical analysis of aerosol samples for organic and elemental carbon. Anal. Bioanal. Chem. 401:3141–52. doi:10.1007/s00216-011-5103-3.
- Chow, J.C., and J.G. Watson. 2013. Chemical analyses of particle filter deposits. In Aerosols handbook: Measurement, dosimetry, and health effects, 2nd ed., ed. L. Ruzer and N.H. Harley, 179–204. New York, NY: CRC Press/Taylor & Francis.
- Chow, J.C., D.H. Lowenthal, L.-W.A. Chen, X.L. Wang, and J.G. Watson. 2015. Mass reconstruction methods for PM2.5: A review. Air Qual. Atmos. Health 8:243–63. doi:10.1007/s11869-015-0338-3
- Chow, J.C., and J.G. Watson. 2017. Enhanced ion chromatographic speciation of water-soluble PM2.5 to improve aerosol source apportionment. Aerosol Sci. Eng.,1:1–18. doi:10.1007/s41810-017-0002-4
- Christopher, S.A., and P. Gupta. 2010. Satellite remote sensing of particulate matter air quality: The cloud-cover problem. J. Air Waste Manage. Assoc. 60:596–602. doi:10.3155/1047-3289.60.5.596
- CIRA. 2017. Federal Land Manager Environmental Database (FED). Colorado State University, Fort Collins, CO. http://views.cira.colostate.edu/fed ( accessed March 1, 2017).
- Coffey, P.E., P.W. Summers, G.T. Wolff, J.L. Durham, G.J. Foley, H.C. McKee, E.R. Altwicker, G.M. Hidy. 1984. Critical review discussion: Source receptor relationships for acid deposition—Pure and simple. J. Air Pollut. Control Assoc. 34:905–19.
- Cohen, B.S., and C.S. McCammon, Jr. 2001. Air sampling instruments for evaluation of atmospheric contaminants, 9th ed. Cincinnati, OH: American Conference of Govnmental Industrial Hygienists, Inc. doi:10.1080/00022470.1965.10468342
- Colucci, J.M., and C.R. Begeman. 1965. The automotive contribution to airborne polynuclear aromatic hdrocarbons in Detroit. J. Air Pollut. Control Assoc. 15:113–22. doi:10.1080/00022470.1965.10468342
- Cooper, D.W. 1975. Statistical errors in beta absorption measurements of particulate mass concentration. J. Air Pollut. Control Assoc. 25:1154–5. doi:10.1080/00022470.1975.10470192
- Cooper, O.R., D.D. Parrish, J. Ziemke, N.V. Balashov, M. Cupeiro, I.E. Galbally, S. Gilge, L. Horowitz, N.R. Jensen, J.-F. Lamarque, V. Naik, S.J. Oltsmans, J. Schwab, D.T. Shindell, A.M. Thompson, V. Thouret, Y. Wang, and R.M. Zbinden. 2014. Global distribution and trends of trophospheric ozone: An observation-based review. Elem. Sci. Anth. 2:1–28. doi:10.12952/journal.elementa.000029
- COSM. 2017. Air quality egg. Sensemakers, New York, NY. http://airqualityegg.com ( accessed March 1, 2017).
- Countess, R.J., S.H. Cadle, P.J. Groblicki, and G.T. Wolff. 1981. Chemical analysis of size segregated samples of Denver’s ambient particulate. J. Air Pollut. Control Assoc. 31:247–52. doi:10.1080/00022470.1981.10465216
- Croes, B.E., and E.M. Fujita. 2003. Overview of the 1997 Southern California Ozone Study (SCOS97-NARSTO). Atmos. Environ. 37:S3–S26. doi:10.1016/S1352-2310(03)00379-0.
- Cropper, P.M. 2016. Determination of fine particulate matter composition and development of the organic aerosol monitor. PhD dissertation, Brigham Young University, Provo, UT. http://scholarsarchive.byu.edu/cgi/viewcontent.cgi?article=6667&context=etd ( accessed March 1, 2017).
- Darley, E.F., K.A. Kettner, and E.R. Stephens. 1963. Analysis of peroxyacyl nitrates by gas chromatography with electron capture detection. Anal. Chem. 35:589–91. doi:10.1021/ac60197a028.
- Davidson, C.I. 1979. Air pollution in Pittsburgh: A historical perspective. J. Air Pollut. Control Assoc. 29:1035–41. doi:10.1029/JD090iD01p02123
- Davidson, C.I., S.E. Lindberg, J.A. Schmidt, L.C. Cartwright, and L.L. Landis. 1985. Dry deposition of sulfate onto surrogate surfaces. J. Geophys. Environ. 90:2123–30. doi:10.1016/S1352-2310(99)00452-5
- Demerjian, K.L. 2000. A review of national monitoring networks in North America. Atmos. Environ. 34:1861–84. doi:10.3155/1047-3289.58.2.216
- Demerjian, K.L., and V.A. Mohnen. 2008. Synopsis of the temporal variation of particulate matter composition and size. J. Air Waste Manage. Assoc. 58:216–33. doi:10.3155/1047-3289.58.2.216
- DeMore, W.B., J.C. Romanovsky, M. Feldstein, W.J. Hamming, and P.K. Mueller. 1975. Comparison of oxidant calibration procedures. California Air Resources Board Ad Hoc Oxidant Measurement Committee, Sacramento, CA.
- DeMore, W.B., and M. Patapoff. 1976. Comparison of ozone determinations by ultraviolet photometry and gas-phase titration. Environ. Sci. Technol. 10:897–9. doi:10.1021/es60120a012
- Diab, J., T. Streibel, F. Cavalli, S.C. Lee, H. Saathoff, T. Mamakos, J.C. Chow, L.-W.A. Chen, J.G. Watson, O. Sippula, and R. Zimmermann. 2015. Hyphenation of a EC/OC thermal-optical carbon analyzer to photo ionization time-of-flight mass spectrometry: A new off-line aerosol mass spectrometric approach for characterization of primary and secondary particulate matter. Atmos. Meas. Tech. 8:3337–53. doi:10.5194/amt-8-3337-2015
- Donaldson, K., R. Duffin, J.P. Langrish, M.R. Miller, N.L. Mills, C.A. Poland, J. Raftis, A. Shah, C.A. Shaw, and D.E. Newby. 2013. Nanoparticles and the cardiovascular system: a critical review. Nanomedicine 8:403–23. doi:10.2217/nnm.13.16
- Drinovec, L., G. Mocnik, P. Zotter, A.S.H. Prevot, C. Ruckstuhl, E. Coz, M. Rupakheti, J. Sciare, T. Muller, A. Wiedensohler, and A.D.A. Hansen. 2015. The “dual-spot” Aethalometer: An improved measurement of aerosol black carbon with real-time loading compensation. Atmos. Meas. Tech. 8:1965–79. doi:10.5194/amt-8-1965-2015
- Ducros, M. 1815. Observation d’une Pluie Acide. J. Pharm. Chim. 7:273–7.
- Dunlea, E.J., S.C. Herndon, D.D. Nelson, R.M. Volkamer, F. San Martini, P.M. Sheehy, M.S. Zahniser, J.H. Shorter, J.C. Wormhoudt, B.K. Lamb, E.J. Allwine, J.S. Gaffney, N.A. Marley, M. Grutter, C. Marquez, S. Blanco, B. Cardenas, A. Retama, C.R.R. Villegas, C.E. Kolb, L.T. Molina, and M.J. Molina. 2007. Evaluation of nitrogen dioxide chemiluminescence monitors in a polluted urban environment. Atmos. Chem. Phys. 7:2691–704. doi:10.5194/acp-7-2691-2007
- Dye, T.S., B.J. Gordon, and P.T. Roberts. 2014. Air sensors: Quality data for the right application. EM 20:22–7.
- Egami, R.T., J.G. Watson, C.F. Rogers, M.G. Ruby, M.J. Rood, and J.C. Chow. 1989. Particle fallout container measurement of dustfall from the atmosphere. In Methods of air sampling and analysis, 3rd ed., ed. J.P. Lodge, 440–5. Chelsea, MI: Lewis.
- Eklund, A.G., J.C. Chow, D.S. Greenbaum, G.M. Hidy, M.T. Kleinman, J.G. Watson, and R.E. Wyzga. 2014. Public health and components of particulate matter: The changing assessment of black carbon—Critical review discussion. J. Air Waste Manage. Assoc. 64:1221–31. doi:10.1080/10962247.2014.960218
- Environment Canada. 2015. Canadian ambient air quality standards. Environment Canada, Ottawa, Ontario. http://www.ec.gc.ca/default.asp?lang=En&n=56D4043B-1&news=A4B2C28A-2DFB-4BF4-8777-ADF29B4360BD ( accessed March 1, 2017).
- Fahey, D.W., C.S. Eubank, G. Hübler, and F.C. Fehsenfeld. 1985. Evaluation of a catalytic reduction technique for the measurement of total reactive odd-nitrogen, NOy in the atmosphere. J. Atmos. Chem. 3:435–68. doi:10.1007/BF00053871
- FamousInventors. 2017. Joseph Priestley. Famous Inventors. http://www.famousinventors.org/joseph-priestley ( accessed March 1, 2017).
- Faoro, R.B. 1975. Trends in concentrations of benzene soluble suspended particulate fraction and benzo(a)pyrene. J. Air Pollut. Control Assoc. 25:638–40. doi:10.1080/00022470.1975.10470124
- Faust, G.T. 1950. Thermal analysis studies on carbonates I. Aragonite and calcite. Am. Miner. 38:207–24.
- Feeney, P., T. Cahill, J. Olivera, and R. Guidara. 1984. Gravimetric determination of mass on lightly-loaded membrane filters. J. Air Pollut. Control Assoc. 34:376–7. doi:10.1080/00022470.1984.10465760
- Ferris, B.G., Jr. 1978. Critical review: Health effects of exposure to low levels of regulated air pollutants: A critical review. J. Air Pollut. Control Assoc. 28:482–97. doi:10.1080/00022470.1978.10470621
- Fiore, A.M., V. Naik, and E.M. Leibensperger. 2015. Air quality and climate connections. J. Air Waste Manage. Assoc. 65:645–85. doi:10.1080/10962247.2015.1040526
- Fishman, J., K.W. Bowman, J.P. Burrows, A. Richter, K.V. Chance, D.P. Edwards, R.V. Martin, G.A. Morris, R.B. Pierce, J.R. Ziemke, J.A. Al-Saadi, J.K. Creilson, T.K. Schaack, and A.M. Thompson. 2008. Remote sensing of tropospheric pollution from space. Bull. Am. Meteorol. Soc. 89:805–21. doi:10.1175/2008BAMS2526.1
- Friedlander, S.K. 1970. The characterization of aerosols distributed with respect to size and chemical composition—I. Aerosol Sci. Technol. 1:295–307. doi:10.1016/0021-8502(70)90003-0
- Friedlander, S.K. 1971. The characterization of aerosols distributed with respect to size and chemical composition II. Classification and design of aerosol measuring devices. Aerosol Sci. Technol. 2:331–40. doi:10.1016/0021-8502(71)90058-9
- Gholson, A.R., J.F. Storm, R.K.M. Jayanty, R.G. Fuerst, T.J. Logan, and M.R. Midgett. 1989. Evaluation of canisters for measuring emissions of volatile organic air pollutants from hazardous waste incineration. J. Air Pollut. Control Assoc. 39:1210–7. doi:10.1080/08940630.1989.10466614
- Gibbs, D. 2017. IR/UV spectrometry for air pollution monitoring. IEEE Blog. http://www.grss-ieee.org/iruv-spectrometry-for-air-pollution-monitoring ( accessed March 1, 2017).
- Goldstein, A.H., D.R. Worton, B.J. Williams, S.V. Hering, N.M. Kreisberg, O. Panic, and T. Gorecki. 2008. Thermal desorption comprehensive two-dimensional gas chromatography for in-situ measurements of organic aerosols. J. Chromatogr. A 1186:340–7. doi:10.1016/j.chroma.2007.09.094
- Goldstein, B.D. 1983. Toxic substances in the atmospheric environment—A critical review. J. Air Pollut. Control Assoc. 33:454–67.
- Grabowsky, J., T. Streibel, M. Sklorz, J.C. Chow, A. Mamakos, and R. Zimmermann. 2011. Hyphenation of a carbon analyzer to photo-ionization mass spectrometry to unravel the organic composition of particulate matter on a molecular level. Anal. Bioanal. Chem. 401:3153–64. doi:10.1007/s00216-011-5425-1
- Grahame, T.J., R.J. Klemm, and R.B. Schlesinger. 2014. Public health and components of particulate matter: The changing assessment of black carbon: Critical review. J. Air Waste Manage. Assoc. 64:620–60. doi:10.1080/10962247.2014.912692
- Griebling, R.T. 1952. Maximilien Ringelmann—Man of mystery. Air Repair 2:4–6.
- Grimm, H., and D.J. Eatough. 2009. Aerosol measurement: The use of optical light scattering for the determination of particulate size distribution, and particulate mass, including the semi-volatile fraction. J. Air Waste Manage. Assoc. 59:101–7. doi:10.3155/1047-3289.59.1.101
- Grosjean, E., and D. Grosjean. 1996. Carbonyl collection efficiency of the DNPH-coated C18 cartridge in dry air and in humid air. Environ. Sci. Technol. 30:859–63. doi:10.1021/es950297e
- Grover, B.D., N.L. Eatough, D.J. Eatough, J.C. Chow, J.G. Watson, J.L. Ambs, M.B. Meyer, P.K. Hopke, R. Al-Horr, D.W. Later, and W.E. Wilson. 2006. Measurements of both non-volatile and semi-volatile fractions of fine particulate matter in Fresno, CA. Aerosol Sci. Technol. 40:811–26. doi:10.1080/02786820600615071
- Grover, B.D., M. Kleinman, N.L. Eatough, D.J. Eatough, R.A. Cary, P.K. Hopke, and W.E. Wilson. 2008. Measurement of fine particulate matter nonvolatile and semi-volatile organic material with the Sunset Laboratory Carbon Aerosol Monitor. J. Air Waste Manage. Assoc. 58:72–7. doi:10.3155/1047-3289.58.1.72
- Grover, B.D., N.L. Eatough, W.R. Woolwine, D.J. Eatough, and R.A. Cary. 2009. Modifications to the Sunset Laboratory carbon aerosol monitor for the simultaneous measurement of PM2.5 nonvolatile and semi-volatile carbonaceous material. J. Air Waste Manage. Assoc. 59:1007–17. doi:10.3155/1047-3289.59.8.1007
- Gruber, C.W., and E.L. Alpaugh. 1954. The automatic filter paper sampler in an air pollution measurement program. Air Repair 4:143–72. doi:10.1080/00966665.1954.10467658.
- Gruber, C.W., and G.A. Jutze. 1957. The use of sticky paper in an air pollution monitoring program. J. Air Pollut. Control Assoc. 7:115–7. doi:10.1080/00966665.1957.10467787.
- Haagen-Smit, A.J. 1950. The air pollution problem in Los Angeles. Eng. Sci. 14:7–13.
- Haagen-Smit, A.J., and M.M. Fox. 1954. Photochemical ozone formation with hydrocarbons and automobile exhaust. Air Repair 4:105–36. doi:10.1080/00966665.1954.10467649.
- Habibi, K. 1970. Characterization of particulate lead in vehicle exhaust: Experimental techniques. Environ. Sci. Technol. 4:239–48. doi:10.1021/es60038a001
- Hackney, R.J., V. Hughes, K.L. Magliano, E.M. Niccum, W. Phelps, J.G. Watson, and J.A. Anderson. 1994. SJVAQS/AUSPEX and SARMAP data management. In Planning and managing regional air quality, modeling and measurement studies, ed. P.A. Solomon, 301–34. Boca Raton, FL: CRC Press.
- Hales, J.M. 2003. NARSTO fine-particle and ozone assessments. Environ. Pollut. 123:393–7. doi:10.1016/S0269-7491(03)00021-6
- Halket, J.M., and V.G. Zaikin. 2006. Derivatization in mass spectrometry—7. On-line derivatization/degradation. Eur. J. Mass Spectrom. 12:1–13. doi:10.1255/ejms.785
- Halliday, E.C. 1961. A historical review of atmospheric pollution. Geneva, Switzerland: World Health Organization.
- Hammerle, R.H., and W.R. Pierson. 1975. Sources and elemental composition of aerosol in Pasadena, California, by energy-dispersive x-ray fluorescence. Environ. Sci. Technol. 9:1058–68. doi:10.1021/es60110a008
- Hand, J.L., K.A. Gebhart, B.A. Schichtel, and W.C. Malm. 2012a. Increasing trends in wintertime particulate sulfate and nitrate ion concentrations in the Great Plains of the United States (2000–2010). Atmos. Environ. 55:107–10.
- Hand, J.L., B.A. Schichtel, W.C. Malm, and M.L. Pitchford. 2012b. Particulate sulfate ion concentration and SO2 emission trends in the United States from the early 1990s through 2010. Atmos. Chem. Phys, 12:10353–65.
- Hand, J.L., B.A. Schichtel, W.C. Malm, S. Copeland, J.V. Molenar, N.H. Frank, and M.L. Pitchford. 2014. Widespread reductions in haze across the United States from the early 1990s through 2011. Atmos. Environ. 94:671–9. doi:10.1016/j.atmosenv.2014.05.062
- Hangebrauck, R.P., D.J. Von Lehmden, and J.E. Meeker. 1964. Emissions of polynuclear hydrocarbons and other pollutants from heat-generation and incineration processes. J. Air Pollut. Control Assoc. 14:267–78.
- Hansen, A.D.A., H. Rosen, and T. Novakov. 1984. The aethalometer—An instrument for the real-time measurement of optical absorption by aerosol particles. Sci. Total Environ. 36:191–6. doi:10.1016/0048-9697(84)90265-1
- Hansen, D.A., J.G. Watson, P.S. Bhardwaja, R.J. Farber, R. Kelso, W.C. Malm, P.K. Mueller, M.L. Pitchford, and W.E. Wilson. 1983. The SCENES: A major air quality and visibility research study in the southwestern United States. Proceedings, 76th Annual Meeting of the Air Pollution Control Association. Pittsburgh, PA: Air & Waste Management Association.
- Hansen, D.A., E.S. Edgerton, B.E. Hartsell, J.J. Jansen, N. Kandasamy, G.M. Hidy, and C.L. Blanchard. 2003. The Southeastern Aerosol Research and Characterization Study: Part 1—Overview. J. Air Waste Manage. Assoc. 53:1460–71. doi:10.1080/10473289.2003.10466318
- Hansen, D.A., Edgerton, E., Hartsell, B., Jansen, J., Burge, H., Koutrakis, P., Rogers, C., Suh, H., Chow, J.C., Zielinska, B., McMurry, P.H., Mulholland, J., Russell, A. and Rasmussen, R. 2006. Air quality measurements for the aerosol research and inhalation epidemiology study. J. Air Waste Manage. Assoc. 56:1445–58. doi:10.1080/10473289.2006.10464549
- Hansen, J.C., W.R. Woolwine, B.L. Bates, J.M. Clark, R.Y. Kuprov, P. Mukherjee, J.A. Murray, M.A. Simmons, M.F. Waite, N.L. Eatough, D.J. Eatough, R. Long, and B.D. Grover. 2010. Semicontinuous PM2.5 and PM10 mass and composition measurements in Lindon, Utah, during winter 2007. J. Air Waste Manage. Assoc. 60:346–55. doi:10.3155/1047-3289.60.3.346
- Hart, R., P.G. Webb, R.H. Biggs, and K.M. Portier. 1988. The use of lichen fumigation studies to evaluate the effects of new emission sources on Class I areas. J. Air Pollut. Control Assoc. 38:144–7. doi:10.1080/08940630.1988.10466361
- Hays, M.D., and R.J. Lavrich. 2007. Developments in direct thermal extraction gas chromatography-mass spectrometry of fine aerosols. Trends Anal. Chem. 26:88–102. doi:10.1016/j.trac.2006.08.007
- Hearn, A.G. 1961. The absorption of ozone in the ultra-violet and visible regions of the spectrum. Proceedings of the Physical Society 78:932. doi:10.1088/0370-1328/78/5/340
- Helwig, H.L., and P.K. Mueller. 1959. Aerosol sampling and particle sizing of outside atmospheres. Air & Industrial Hygiene Laboratory, California Department of Health Services, Berkeley, CA.
- Helwig, H.L., and P.K. Mueller. 1960. Particle sizing and analysis on community air pollution studies, Proceedings, Third Air Pollution Research Seminar, New Orleans, LA.
- Hemeon, W.C.L., G.F. Haines, Jr., and H.M. Ide. 1953. Determination of haze and smoke concentrations by filter paper samplers. Air Repair 3:22–8. doi:10.1080/00966665.1953.10467585.
- Hering, S.V., M. Stolzenburg, and N. Kreisberg. 1999. Automated fine particle nitrate and PM2.5 measurements for method evaluation and secondary aerosol characterization. Electric Power Research Institute, Palo Alto, CA. https://crcao.org/reports/recentstudies00-02/crcepri.pdf ( accessed March 1, 2017).
- Hicks, B.B., M.L. Wesely, and J.L. Durham. 1980. Critique of methods to measure dry deposition. Argonne National Laboratory, Argonne, IL.
- Hicks, B.B., D.D. Baldocchi, R.P. Hosker, Jr., B.A. Hutchison, D.R. Matt, R.T. McMillen, and L.C. Satterfield. 1985. On the use of monitored air concentrations to infer dry deposition (1985). NOAA, Air Resources Laboratory, Silver Springs, MD.
- Hicks, B.B., and R.T. McMillen. 1988. On the measurement of dry deposition using imperfect sensors and in non-ideal terrain. Boundary-Layer Meteorol., 42:79–94. doi:10.1007/bf00119876.
- Hidy, G.M. 1974. Characterization of aerosols in California. Rockwell International, Thousand Oaks, CA.
- Hidy, G.M. 1984a. Aerosols: An industrial and environmental science. San Diego, CA: Acadamic Press.
- Hidy, G.M. 1984b. Critical review: Source receptor relationships for acid deposition: Pure and simple. J. Air Pollut. Control Assoc. 34:518–31. doi:10.1080/00022470.1984.10465770
- Hidy, G.M. 1987. Conceptual design of a massive aerometric tracer experiment (MATEX). J. Air Pollut. Control Assoc. 37:1137–57. doi:10.1080/08940630.1987.10466308
- Hidy, G.M., P.K. Mueller, Y. Tokiwa, and S. Twiss. 1972. Aerometric factors affecting the evolution of the Pasadena aerosol. In Aerosols and atmospheric chemistry, ed. G.M. Hidy, 219–36. New York, NY: Academic Press.
- Hidy, G.M., B.R. Appel, R.J. Charlson, W.E. Clark, D. Covert, S.K. Friedlander, R.D. Giauque, S.L. Heisler, W.W. Ho, J.J. Huntzicker, T. Novakov, L.W. Richards, R.C. Ragaini, T.B. Smith, G.M. Sverdrup, S. Twiss, A.P. Waggoner, H.H. Wang, J.J. Wesolowski, K.T. Whitby, and W.H. White. 1974a. Characterization of aerosols in California (ACHEX), vol. IV: Analysis and interpretation of Data. Rockwell International, Thousand Oaks, CA.
- Hidy, G.M., B.R. Appel, R.J. Charlson, W.E. Clark, D. Covert, R.D. Giauque, S. Green, S.L. Heisler, J.J. Huntzicker, R.B. Husar, K. Kubler, G. Lauer, P.K. Mueller, T. Novakov, R.C. Ragaini, T.B. Smith, E.R. Stephens, H.H. Wang, J.J. Wesolowski, and K.T. Whitby. 1974b. Characterization of aerosols in California (ACHEX), vol. II: Experimental methods and analytical techniques. Rockwell International, Thousand Oaks, CA.
- Hidy, G.M., B.R. Appel, R.J. Charlson, W.E. Clark, S.K. Friedlander, D.H. Hutchison, T.B. Smith, J.K. Suder, J.J. Wesolowski, and K.T. Whitby. 1975. Summary of the California Aerosol Characterization Experiment. J. Air Pollut. Control Assoc. 25:1106–14. doi:10.1080/00022470.1975.10470183
- Hidy, G.M., P.K. Mueller, D. Grosjean, B.R. Appel, and J.J. Wesolowski. 1980. The character and origins of smog aerosols. In A digest of results from the California Aerosol The Character and Origins of Smog Aerosols: A Digest of Results from the California Aerosol Characterization Experiment (ACHEX). New York, NY: John Wiley and Sons.
- Hidy, G.M., D.A. Hansen, R.C. Henry, K. Ganesan, and J.F. Collins. 1984. Trends in historical acid precursor emissions and their airborne and precipitation products. J. Air Pollut. Control Assoc. 34:333–54. doi:10.1080/00022470.1984.10465754
- Hidy, G.M., A. Bass, and D.A. Hansen. 1985a. Feasibility and design of the Massive Aerometric Tracer Experiment (MATEX), vol. 2: Experimental alternatives and evaluation methodology: Supporting studies. Environmental Research & Technology, Inc., Newbury Park, CA.
- Hidy, G.M., D.A. Hansen, and A. Bass. 1985b. Feasibility and design of the Massive Aerometric Tracer Experiment (MATEX), vol. 1 Presentation of the MATEX design concept. Environmental Research & Technology, Inc., Newbury Park, CA.
- Hidy, G.M., J.M. Hales, P.M. Roth, and R.D. Scheffe. 2000. Fine particles and oxidant pollution: Developing an agenda for cooperative research. J. Air Waste Manage. Assoc. 50:613–32. doi:10.1080/10473289.2000.10464035
- Hidy, G.M., J.R. Brook, J.C. Chow, M.C. Green, R.B. Husar, C. Lee, R.D. Scheffe, A. Swanson, and J.G. Watson. 2009. Remote sensing of particulate pollution from space: Have we reached the promised land?: Critical review discussion. J. Air Waste Manage. Assoc. 59:1130–9. doi:10.3155/1047-3289.59.10.1130
- Hidy, G.M., J. Brook, K. Demerjian, L. Molina, W.R. Pennell, and R. Scheffe. 2011. Technical challenges of multipollutant air quality management. New York, NY: Springer.
- Hidy, G.M., C.L. Blanchard, K. Baumann, E. Edgerton, S. Tannenbaum, S. Shaw, E. Knipping, I. Tombach, J. Jansen, and J. Walters. 2014. Chemical climatology of the southeastern United States, 1999–2013. Atmos. Chem. Phys. 14:11893–914. doi:10.5194/acp-14-11893-2014
- Hill, A.S.G. 1936. Measurement of the optical densities of smokestains of filter papers. Trans. Faraday Soc. 32:1125–31. doi:10.1039/tf9363201125
- Ho, S.S.H., and J. Yu. 2002. Feasibility of collection and analysis of airborne carbonyls by on-sorbent derivatization and thermal desorption. Anal. Chem. 74:1232–40. doi:10.1021/ac015708q
- Ho, S.S.H., and J.Z. Yu. 2004. In-injection port thermal desorption and subsequent gas chromatography-mass spectrometric analysis of polycyclic aromatic hydrocarbons and n-alkanes in atmospheric aerosol samples. J. Chromatogr. A 1059:121–9. doi:10.1016/j.chroma.2004.10.013
- Ho, S.S.H., J.Z. Yu, J.C. Chow, B. Zielinska, J.G. Watson, E.H.L. Sit, and J.J. Schauer. 2008. Evaluation of an in-injection port thermal desorption-gas chromatography/mass spectrometry method for analysis of non-polar organic compounds in ambient aerosol samples. J. Chromatogr. A 1200:217–27. doi:10.1016/j.chroma.2008.05.056.
- Ho, S.S.H., J.C. Chow, J.G. Watson, S.H.S. Ip, K.F. Ho, W.T. Dai, and J.J. Cao. 2014. Biases in ketone measurements using DNPH-coated solid sorbent cartridges. Anal. Methods 6:967–74. doi:10.1039/c3ay41636d
- Hodgeson, J.A., K.J. Krost, A.E. O’Keeffe, and R.K. Stevens. 1970. Chemiluminescent measurement of atmospheric ozone. Response characteristics and operating variables. Anal. Chem. 42:1795–802. doi:10.1021/ac50160a056
- Hoff, R.M., and S.A. Christopher. 2009. Remote sensing of particulate pollution from space: Have we reached the promised land? A critical review. J. Air Waste Manage. Assoc. 59:645–75. doi:10.3155/1047-3289.59.6.645
- Hogrefe, O., J.J. Schwab, F. Drewnick, G.G. Lala, S. Peters, K.L. Demerjian, K. Rhoads, H.D. Felton, O.V. Rattigan, L. Husain, and V.A. Dutkiewicz. 2004. Semicontinuous PM2.5 sulfate and nitrate measurements at an urban and a rural location in New York: PMTACS-NY summer 2001 and 2002 campaigns. J. Air Waste Manage. Assoc. 54:1040–60. doi:10.1080/10473289.2004.10470972
- Horváth, L., Z. Nagy, and T. Weidinger. 1998. Estimation of dry deposition velocities of nitric oxide, sulfur dioxide, and ozone by the gradient method above short vegetation during the TRACT campaign. Atmos. Environ. 32:1317–22. doi:10.1016/S1352-2310(97)00192-1
- Hsu, Y.M., X.L. Wang, J.C. Chow, J.G. Watson, and K.E. Percy. 2016. Collocated comparisons of continuous and filter-based PM2.5 measurements at Fort McMurray, Alberta, Canada. J. Air Waste Manage. Assoc. 66:329–39. doi:10.1080/10962247.2015.1136362
- Hu, S.W., and C.M. Shy. 2001. Health effects of waste incineration: A review of epidemiologic studies. J. Air Waste Manage. Assoc. 51:1100–9. doi:10.1080/10473289.2001.10464324
- Huntzicker, J.J., and R.L. Johnson. 1979. Investigation of an ambient interference in the measurement of ozone by ultrviolet absorption photometry. Environ. Sci. Technol. 13:1414–6. doi:10.1021/es60159a005
- Huntzicker, J.J., R.L. Johnson, J.J. Shah, and R.A. Cary. 1982. Analysis of organic and elemental carbon in ambient aerosols by a thermal-optical method. In Particulate carbon: Atmospheric life cycle, ed. G.T. Wolff and R.L. Klimisch, 79–88. New York, NY: Plenum Press.
- IMPROVE. 2017. Interagency monitoring of protected visual environments. National Park Service, Ft. Collins, CO. http://vista.cira.colostate.edu/IMPROVE ( accessed March 1, 2017)
- Isaacman, G., N.M. Kreisberg, L.D. Yee, D.R. Worton, A.W.H. Chan, J.A. Moss, S.V. Hering, and A.H. Goldstein. 2014. Online derivatization for hourly measurements of gas- and particle-phase semi-volatile oxygenated organic compounds by thermal desorption aerosol gas chromatography (SV-TAG). Atmos. Meas. Tech. 7:4417–29. doi:10.5194/amt-7-4417-2014
- Jacobs, M.B., M.M. Braverman, and S. Hochheiser. 1959. Continuous determination of carbon monoxide and hydrocarbons in air by a modified infrared analyzer. J. Air Pollut. Control Assoc. 9:110–4. doi:10.1080/00022470.1959.10467879.
- Jayne, J.T., D.L. Leard, X. Zhang, P., Davidovits, K.A. Smith, C.E. Kolb, and D.R. Worsnop. 2000. Development of an aerosol mass spectrometer for size and composition analysis of submicron particles. Aerosol Sci. Technol. 33:49–70. doi:10.1080/027868200410840
- Jovasevic-Stojanovic, M., A. Bartonova, D. Topalovic, I. Lazovic, B. Pokric, and Z. Ristovski. 2015. On the use of small and cheaper sensors and devices for indicative citizen-based monitoring of respirable particulate matter. Environ. Pollut. 206:696–704. doi:10.1016/j.envpol.2015.08.035
- Junge, C.E. 1954. The chemical composition of atmospheric aerosols: I. Measurements at Round Hill Field Station, June–July, 1953. J. Meteorol. 11:323–33. doi:10.1175/1520-0469(1954)011<0323:TCCOAA>2.0.CO;2
- Junge, C.E. 1955. The size distribution and aging of natural aerosols as determined from electrical and optical data on the atmosphere. J. Meteorol. 12:13–25. doi:10.1175/1520-0469(1955)012<0013:TSDAAO>2.0.CO;2.
- Junge, C.E. 1963. Air chemistry and radioactivity. New York, NY: Academic Press.
- Katz, M. 1980. Critical review: Advances in the analysis of air contaminants. J. Air Pollut. Control Assoc. 30:528–57. doi:10.1080/00022470.1980.10465980
- Kim, K.H., S.A. Jahan, E. Kabir, and R.J.C. Brown. 2013. A review of airborne polycyclic aromatic hydrocarbons (PAHs) and their human health effects. Environ. Int. 60:71–80. doi:10.1016/j.envint.2013.07.019
- Kimoto, T., Y. Mitani, S. Kou, T. Azuhata, Y. Toyazaki, T.M. Merrifield, and J. Tisch. 2010. A new dichotomous XRF analyzer for aerosol chemical speciation. In Proceedings, Leapfrogging opportunities for air quality improvement, ed. J.C. Chow, J.G. Watson, and J.J. Cao, 91–103. Pittsburgh, PA: Air & Waste Management Association.
- Kinsman, J.D., and C.V. Mathai. 2014. I can see clearly now: Implementing the regional haze rules. EM 20:6–7.
- Kleindienst, T.E., E.E. Hudgens, D.F. Smith, F.F. McElroy, and J.J. Bufalini, J.J. 1993. Comparison of chemiluminescence and ultraviolet ozone monitor responses in the presence of humidity and photochemical pollutants. J. Air Waste Manage. Assoc. 43:213–22. doi:10.1080/1073161X.1993.10467128
- Kleinman, M.T., J.D. Bachmann, H.J. Feldman, D. McCabe, J.J. West, and A.F. Fiore. 2015. Connecting air quality and climate change: Critical review discussion. J. Air Waste Manage. Assoc. 65:1283–91. doi:10.1080/10962247.2015.1095599
- Knutson, E.O., and K.T. Whitby. 1975a. Aerosol classification by electric mobility: Apparatus, theory, and applications. J. Aerosol Sci. 6:443–51. doi:10.1016/0021-8502(75)90060-9
- Knutson, E.O., and K.T. Whitby. 1975b. Accurate measurement of aerosol electric mobility moments. J. Aerosol Sci. 6:453–60. doi:10.1016/0021-8502(75)90061-0
- Koch, R.C., and H.E. Rector. 1987. Network design and optimum site exposure criteria for particulate matter. GEOMET Technologies, Inc., Rockville, MD. https://www3.epa.gov/ttnamti1/archive/files/ambient/criteria/reldocs/4-87-009.pdf ( accessed March 1, 2017).
- Kothny, E.L., and P.K. Mueller. 1965. A method for oxides of nitrogen above 100 ppm. Proceedings, Seventh Conference on Methods in Air Pollution Studies. Berkeley, CA: California State Department of Public Health.
- Kothny, E.L., and P.K. Mueller. 1966. Sub-minute continuous nitrogen dioxide analysis. Proceedings, International Clean Air Congress. London, UK: IUAPPA.
- Kothny, E.L., and P.K. Mueller. 1968. Formulation and temperature effects on the azo-dye reagents for NO2 determination. Proceedings, 9th Conference on Methods in Air Pollution and Industrial Hygiene Studies.
- Koziel, J.A., J.P. Spinhirne, J.D. Lloyd, D.B. Parker, D.W. Wright, and F.W. Kuhrt. 2005. Evaluation of sample recovery of malodorous livestock gases from air sampling bags, solid-phase microextraction fibers, Tenax TA sorbent tubes, and sampling canisters. J. Air Waste Manage. Assoc. 55:1147–57. doi:10.1080/10473289.2005.10464711
- Kroll, J.H., N.M. Donahue, J.L. Jimenez, S.H. Kessler, M.R. Canagaratna, K.R. Wilson, K.E. Altieri, L.R. Mazzoleni, A.S. Wozniak, H. Bluhm, E.R. Mysak, J.D. Smith, C.E. Kolb, and D.R. Worsnop. 2011. Carbon oxidation state as a metric for describing the chemistry of atmospheric organic aerosol. Nature Chem. 3:133–9. doi:10.1038/nchem.948
- Kulkarni, P., P.A. Baron, and K. Willeke. 2011. Aerosol measurement principles, techniques and applications, 3rd ed. Hoboken, NJ: John Wiley & Sons, Inc.
- Kushner, E.J. 1976. On determining the statistical parameters for pollution concentration from a truncated data set. Atmos. Environ. 10:975–9. doi:10.1016/0004-6981(76)90205-5
- Landsberg, H. 1938. Atmospheric condensation nuclei. Eigebn. Kosm. Phys. 3:155–252.
- Lavery, T.F., C.M. Rogers, R. Baumgardner, and K.P. Mishoe. 2009. Intercomparison of Clean Air Status and Trends Network nitrate and nitric acid measurements with data from other monitoring programs. J. Air Waste Manage. Assoc. 59:214–26. doi:10.3155/1047-3289.59.2.214
- Lee, R.E., and J. Wagman. 1966. A sampling anomaly in the determination of atmospheric sulfate concentration. AIHA J. 27:266–71. doi:10.1080/00028896609342826
- Leinster, P., R. Perry, and R.J. Young. 1977. Detection and measurement of volatile hydrocarbons at ambient concentrations in atmosphere. Talanta 24:205–13. doi:10.1016/0039-9140(77)80138-0.
- Leston, A.R., W.M. Ollison, C.W. Spicer, and J. Satola. 2005. Potential interference bias in ozone standard compliance monitoring. J. Air Waste Manage. Assoc. 55:1464–72. doi:10.1080/10473289.2005.10464749
- Lighty, J.S., J.M. Veranth, and A.F. Sarofim. 2000. Critical review: Combustion aerosols: Factors governing their size and composition and implications to human health. J. Air Waste Manage. Assoc. 50:1565–618. doi:10.1080/10473289.2000.10464197
- Lin, C.H. 2008. Impact of downward-mixing ozone on surface ozone accumulation in southern Taiwan. J. Air Waste Manage. Assoc. 58:562–79. doi:10.3155/1047-3289.58.4.562
- Linkov, I., D. Loney, S. Cormier, F.K. Satterstrom, and T. Bridges. 2009. Weight-of-evidence evaluation in environmental assessment: Review of qualitative and quantitative approaches. Sci. Total Environ. 407:5199–205. doi:10.1016/j.scitotenv.2009.05.004
- Lippmann, M. 1988. Critical review: Health significance of pulmonary function responses to airborne irritants. J. Air Pollut. Control Assoc. 38:881–7. doi:10.1080/08940630.1988.10466427
- Lodge, J.P. 1989. Methods of air sampling and analysis, 3rd ed. Chelsea, MI: Lewis.
- Lundgren, D.A. 1967. An aerosol sampler for determination of particle concentration as a function of size and time. J. Air Pollut. Control Assoc. 17:243–7. doi:10.1080/00022470.1967.10468972
- Lundgren, D.A. 1972. Mass distribution data from the 1969 Pasadena smog experiment. In Aerosols and atmospheric chemistry, ed. G.M. Hidy, 265–70. New York, NY: Academic Press.
- Lynch, J.A., and M. Kerchner. 2005. The National Atmospheric Deposition Program: 25 Years of monitoring in support of science and policy: An ammonia workshop: The state of science and future needs. Environ. Pollut. 135:343–6. doi:10.1016/j.envpol.2004.11.008
- Ma, J., and S.M. Daggupaty. 2000. Effective dry deposition velocities for gases and particles over heterogeneous terrain. J. Appl. Meteorol. 39:1379–90. doi:10.1175/1520-0450(2000)039<1379:EDDVFG>2.0.CO;2
- Marc, M., B. Zabiegala, and J. Namiesnik. 2012. Mobile systems (portable, handheld, transportable) for monitoring air pollution. Crit. Rev. Anal. Chem. 42:2–15.
- Marple, V., B. Olson, F. Romay, G. Hudak, S.M. Geerts, and D. Lundgren. 2014. Second generation micro-orifice uniform deposit impactor, 120 MOUDI-II: Design, evaluation, and application to long-term ambient sampling. Aerosol Sci. Technol. 48:427–33. 10.1080/02786826.2014.884274
- Marple, V.A., B.Y.H. Liu, and G.A. Kuhlmey. 1981. A uniform deposit impactor. J. Aerosol Sci. 12:333–7. doi:10.1016/0021-8502(81)90022-7
- Mauderly, J.L., and J.C. Chow. 2008. Health effects of organic aerosols. Inhal. Toxicol. 20:257–88. doi:10.1080/08958370701866008
- Mazurek, M.A., L.M. Hildemann, G.R. Cass, B.R.T. Simoneit, and W.F. Rogge. 1993. Methods of analysis for complex organic aerosol mixtures from urban emission sources of particulate carbon. In Sampling and analysis of airborne pollutants, ed. E.D. Winegar and L.H. Keith, 177–90. Boca Raton, FL: Lewis.
- McClenny, W.A., J.D. Pleil, G.F. Evans, K.D. Oliver, M.W. Holdren, and W.T. Winberry. 1991. Canister-based method for monitoring toxic VOCs in ambient air. J. Air Waste Manage. Assoc. 41:1308–18. doi:10.1080/10473289.1991.10466924
- McKee, H.C., R.E. Childers, O. Saenz, T.W. Stanley, and J.H. Margeson. 1972. Collaborative testing of methods to measure air pollutants: I. The high volume method for suspended particulate matter. J. Air Pollut. Control Assoc. 22:342–7. doi:10.1080/00022470.1972.10469643
- McKee, H.C., R.E. Childers, J.H. Margeson, and T.W. Stanley. 1973. Collaborative testing of methods to measure air pollutants II. The non-dispersive infrared method for carbon monoxide. J. Air Pollut. Control Assoc. 23:870–5. doi:10.1080/00022470.1973.10469857
- McMurry, P.H., M.F. Shepherd, and J.S. Vickery. 2004. Particulate matter science for policy makers—A NARSTO assessment. Cambridge, UK: Cambridge University Press.
- Michalski, R. 2016.. Application of IC-MS and IC-ICP-MS in Environmental Research. New York, NY: Wiley.
- Mickley, L.J., D.J. Jacob, B.D. Field, and D. Rind. 2004. Climate response to the increase in tropospheric ozone since preindustrial times: A comparison between ozone and equivalent CO2 forcings. J. Geophys. Res. Atmos. 109: 16. doi:10.1029/2003JD003653
- Miller, F.J., D.E. Gardner, J.A. Graham, R.E. Lee, W.E. Wilson, and J.D. Bachmann. 1979. Size considerations for establishing a standard for inhalable particulates. J. Air Pollut. Control Assoc. 29:610–5. doi:10.1080/00022470.1979.10470831
- Miller, M.S., S.K. Friedlander, and G.M. Hidy. 1972. A chemical element balance for the Pasadena aerosol. J. Colloid Interface Sci. 39:165–76. doi:10.1016/0021-9797(72)90152-X
- Mobley, J.D., M. Deslauriers, and L. Rojas-Brachos. 2005. Improving emission inventories for effective air-quality management across North America—A NARSTO assessment. NARSTO, Pasco, WA. http://www.narsto.org/emission_inventory_1 ( accessed March 1, 2017)
- Mohnen, V., and G.M. Hidy. 2010. Measurements of atmospheric nanoparticles (1875–1980). Bull. Am. Meteorol. Soc. 91:1525-U1147. doi:10.1175/2010BAMS2929.1
- Mueller, P. K. 1967. Aerosol investigations—California State Dept. of Public Health. J. Air Pollut. Control Assoc. 17:583–4. doi:10.1080/00022470.1967.10469029
- Mueller, P.K. 1980. Comments on “Advances in the analysis of air contaminants.” J. Air Pollut. Control Assoc. 30:988–90.
- Mueller, P.K., H.L. Helwig, and C.L. Peterson. 1959. Some performance characteristics of the Goetz model “E” aerosol spectrometer. Proceedings, 52nd Annual Meeting of the Air Pollution Control Association Pittsburgh, PA: Air & Waste Management Association.
- Mueller, P.K., and R. Givens. 1961. Dynamic calibration and data interpretation of a light-scattering instrument. J. Air Pollut. Control Assoc. 11:576–81.
- Mueller, P.K., H.L. Helwig, A.E. Alcocer, W. Gong, and E. Jones. 1964. Concentration of fine particles and lead in auto exhaust. In Symposium on air pollution methods, 60–73. Special tech. publ. 352. Conshohocken, PA: ASTM International.
- Mueller, P.K., E.L. Kothny, N.O. Fansah, and Y. Tokiwa. 1966. Design of azo-dye reagents for nitrogen dioxide analyses. Proceedings, 59th Annual Meeting of the Air Pollution Control Association, Pittsburgh, PA: Air & Waste Management Association.
- Mueller, P.K., N.O. Fansah, Y. Tokiwa, and E.L. Kothny. 1968. Series vs. parallel continuous analysis for NO, NO2 and NOx II. Laboratory data. Proceedings, 9th Conference on Methods in Air Pollution and Industrial Hygiene Studies, Berkeley, CA: Air & Industrial Hygiene Laboratory, California Department of Health Services.
- Mueller, P.K., R.W. Mosley, and L.B. Pierce. 1971. Carbonate and noncarbonate carbon in atmospheric particles. In Proceedings of the Second International Clean Air Congress, ed. H.M. Englund and W.T. Beery, 532–9. New York, NY: Academic Press.
- Mueller, P.K., R.W. Mosley, and L.B. Pierce. 1972a. Chemical composition of Pasadena aerosol by particle size and time of day IV. Carbonate and noncarbonate carbon content. In Aerosols and atmospheric chemistry, ed. G.M. Hidy, 295–9. New York, NY: Academic Press.
- Mueller, P.K., R.W. Mosley, and L.B. Pierce. 1972b. Chemical composition of Pasadena aerosol by particle size and time of day. J. Colloid Interface Sci. 39:235–9.
- Mueller, P.K., G.M. Hidy, K. Warren, T.F. Lavery, and R.L. Baskett. 1980. The occurrence of atmospheric aerosols in the northeastern United States. Ann. NY Acad. Sci. 338: doi:10.1111/j.1749-6632.1980.tb17140.x
- Mueller, P.K., K.K. Fung, S.L. Heisler, D. Grosjean, and G.M. Hidy. 1982a. Atmospheric particulate carbon observations in urban and rural areas of the United States. In Particulate carbon: Atmospheric life cycle, ed. G.T. Wolff and R.L. Klimisch, 343–70. New York, NY: Plenum.
- Mueller, P.K., J.G. Watson, J.C. Chow, K.K. Fung, and S.L. Heisler. 1982b. Eastern regional air quality measurements: Volume 1, Final report. Electric Power Research Institute, Palo Alto, CA.
- Mueller, P.K., G.M. Hidy, R.L. Baskett, K.K. Fung, R.C. Henry, T.F. Lavery, N.J. Nordi, A.C. Lloyd, J.W. Thrasher, K.K. Warren, and J.G. Watson. 1983a. Sulfate Regional Experiment (SURE): Report of findings. Electric Power Research Institute, Palo Alto, CA.
- Mueller, P.K., G.M. Hidy, J.G. Watson, R.L. Baskett, K.K. Fung, R.C. Henry, T.F. Lavery, and K.K. Warren. 1983b. The Sulfate Regional Experiment (SURE): Report of findings (vols. 1, 2, and 3). Electric Power Research Institute, Palo Alto, CA. https://www.researchgate.net/publication/235341654_Sulfate_Regional_Experiment_(SURE)_Report_of_findings?ev=prf_pub ( accessed March 1, 2017).
- Mueller, P.K., and C. McDade. 1986. The SCENES—Measurement of aerosol properties and visual air quality in the southwestern U.S. Proceedings, 79th Annual Meeting of the Air Pollution Control Association. Pittsburgh, PA: Air & Waste Management Association.
- Mueller, S.F. 2003. Seasonal aerosol sulfate trends for selected regions of the United States. J. Air Waste Manage. Assoc. 53:168–84. doi:10.1080/10473289.2003.10466142
- Mukerjee, D. 1998a. Health impact of polychlorinated dibenzo-p-dioxins: A critical review. J. Air Waste Manage. Assoc. 48:157–65. doi:10.1080/10473289.1998.10463655
- Mukerjee, D. 1998b. 1998 Critical review—Assessment of risk from multimedia exposures of children to environmental chemicals. J. Air Waste Manage. Assoc. 48:483–501. doi:10.1080/10473289.1998.10463703
- Muller, C.L., L.Chapman, C.S.B. Grimmond, D.T. Young, and X.M. Cai. 2013. Sensors and the city: A review of urban meteorological networks. Int. J. Climatol., 33:1585–600. doi:10.1002/joc.2013.33.issue-7
- Muller, K.P., and J. Rudolph. 1989. An automated technique for the measurement of peroxyacetyl nitrate in ambient air at ppb and ppt levels. Int. J. Environ. Anal. Chem. 37:253–62. doi:10.1080/03067318908026902
- Murphy, D.M., J.C. Chow, E.M. Leibensperger, W.C. Malm, M.L. Pitchford, B.A. Schichtel, J.G. Watson, and W.H. White. 2011. Decreases in elemental carbon and fine particle mass in the United States. Atmos. Chem. Phys. 11:4679–86. doi:10.5194/acp-11-4679-2011
- NARSTO. 2000. An assessment of tropospheric ozone pollution—A North American perspective. NARSTO Management Office, Pasco, WA. http://cdiac.ornl.gov/programs/NARSTO/ozone_assessment.html ( accessed March 1, 2017).
- NARSTO. 2009. NARSTO data sets. NARSTO, Pasco, WA. http://eosweb.larc.nasa.gov/PRODOCS/narsto/table_narsto.html ( accessed March 1, 2017).
- NARSTO. 2010. NARSTO measurement methods compendium. Oak Ridge National Laboratory. http://cdiac.ornl.gov/programs/NARSTO/compendium.html ( accessed March 1, 2017).
- NARSTO. 2017. NARSTO Home Page. NARSTO, Pasco, WA. http://www.narsto.org ( accessed March 1, 2017).
- Nash, D.G., T. Baer, and M.V. Johnston. 2006. Aerosol mass spectrometry: An introductory review. Int. J. Mass Spectrom. 258:2–12. doi:10.1016/j.ijms.2006.09.017
- National Acid Deposition Program. 2017. National Acid Deposition Program (NADP). Illinois State Water Survey, Champaign, IL. http://nadp.sws.uiuc.edu ( accessed March 1, 2017).
- National Oceanic and Atmospheric Administration. 2017a. CalNex 2010: California Nexus—Research at the nexus of air quality and climate change. National Oceanic and Atmospheric Administration, Boulder, CO. https://www.esrl.noaa.gov/csd/projects/calnex ( accessed March 1, 2017).
- National Oceanic and Atmospheric Administration. 2017b. SENEX 2013: Southeast Nexus—Studying the interactions between natural and anthropogenic emissions at the nexus of climate change and air quality. National Oceanic and Atmospheric Administration, Boulder, CO. https://esrl.noaa.gov/csd/projects/senex ( accessed March 1, 2017).
- National Oceanic and Atmospheric Administration. 2017c. NEAQS 2002: New England Air Quality Study: Understanding atmospheric processes that control the production and distribution of air pollutants in the New England region. National Oceanic and Atmospheric Administration, Boulder, CO. https://www.esrl.noaa.gov/csd/projects/neaqs ( accessed March 1, 2017).
- National Park Service. 2002. Southern Appalachian Mountains Initiative (SAMI). National Park Service, Washington, DC. https://www.nature.nps.gov/air/pubs/pdf/SAMI_Final_Report_0802.pdf ( accessed March 1, 2017).
- National Research Council. 1991. Rethinking the ozone problem in urban and regional air pollution. Washington, DC: National Academy Press. https://www.nap.edu/catalog/1889/rethinking-the-ozone-problem-in-urban-and-regional-air-pollution ( accessed March 1, 2017)
- National Research Council. 2007. Environmental data management at NOAA: Archiving stewardship and access. Washington, DC: National Academies Press.
- NCAR. 2017a. FRAPPE—Front Range Air Polluton and Photochemistry Experiment. National Center for Atmospheric Research, Boulder, CO. https://www2.acom.ucar.edu/frappe ( accessed March 1, 2017).
- NCAR. 2017b. SAS: Southeast Atmosphere Study. National Center for Atmospheric Research, Boulder, CO. https://www.eol.ucar.edu/field_projects/sas ( accessed March 1, 2017).
- Ng, N.L., S.C. Herndon, A. Trimborn, M.R. Canagaratna, P.L. Croteau, T.B. Onasch, D. Sueper, D.R. Worsnop, Q. Zhang, Y.L. Sun, and J.T. Jayne. 2011. An aerosol chemical speciation monitor (ACSM) for routine monitoring of the composition and mass concentrations of ambient aerosol. Aerosol Sci. Technol. 45:770–84. doi:10.1080/02786826.2011.560211
- Nicksic, S.W., J. Harkins, and P.K. Mueller. 1967. Some analyses for PAN and studies of its structure. Atmos. Environ. 1:11–8. doi:10.1016/0004-6981(67)90103-5
- Novakov, T., P.K. Mueller, A.E. Alcocer, and J.W. Otvos. 1972. Chemical composition of Pasadena aerosol by partical size and time of day III. Chemical states of nitrogen and sulfur by photoelectron spectroscopy. J. Colloid Interface Sci. 39:225–34.
- Ollison, W.M., W. Crow, and C.W. Spicer. 2013. Field testing of new-technology ambient air ozone monitors. J. Air Waste Manage. Assoc. 63:855–63. doi:10.1080/10962247.2013.796898
- Orasche, J., J. Schnelle-Kreis, G. Abbaszade, and R. Zimmermann. 2011. Technical note: In-situ derivatization thermal desorption GC-TOFMS for direct analysis of particle-bound non-polar and polar organic species. Atmos. Chem. Phys. 11:8977–93.
- Parrish, D.D., and M.P. Buhr. 1993. Measurement challenges of nitrogen species in the atmosphere. In Measurement challenges in atmospheric chemistry, ed. L. Newman, 243–73. Washington, DC: American Chemical Society. doi:10.5194/acp-11-8977-2011
- Parrish, D.D., and F.C. Fehsenfeld. 2000. Methods for gas-phase measurements of ozone, ozone precursors and aerosol precursors. Atmos. Environ. 34:1921–57. doi:10.1016/S1352-2310(99)00454-9
- Patashnick, H., and E.G. Rupprecht. 1991. Continuous PM10 measurements using the tapered element oscillating microbalance. J. Air Waste Manage. Assoc. 41:1079–83. doi:10.1080/10473289.1991.10466903
- Penkett, S., F. Fehsenfeld, and J. Prospero. 1994. Atmospheric chemistry and composition of air over the North Atlantic ocean. In Global atmospheric-biospheric chemistry, ed. R. Prinn, 19–38. New York, NY: Springer.
- Pitchford, M.L., and M.C. Green. 1997. Analyses of sulfur aerosol size distributions for a forty day period in summer, 1992 at Meadview, Arizona. J. Air Waste Manage. Assoc. 47:136–46. doi:10.1080/10473289.1997.10464431
- Pitchford, M.L., I.H. Tombach, M.G. Barna, K.A. Gebhart, M.C. Green, E.M. Knipping, N.K. Kumar, W.C. Malm, B.K. Pun, B.A. Schichtel, and C. Seigneur. 2004. Big Bend Regional Aerosol and Visibility Observational Study (BRAVO). NOAA, Las Vegas, NV. http://vista.cira.colostate.edu/Improve/final-report-bravo ( accessed March 1, 2017).
- Pitchford, M.L., W.C. Malm, B.A. Schichtel, N.K. Kumar, D.H. Lowenthal, and J.L. Hand. 2007. Revised algorithm for estimating light extinction from IMPROVE particle speciation data. J. Air Waste Manage. Assoc. 57:1326–36. doi:10.3155/1047-3289.57.11.1326
- Pope, C.A., and D.W. Dockery. 2006. Critical review: Health effects of fine particulate air pollution: Lines that connect. J. Air Waste Manage. Assoc. 56:709–42. doi:10.1080/10473289.2006.10464485
- Poschl, U. 2005. Atmospheric aerosols: Composition, transformation, climate and health effects. Angew. Chem. Int. Ed. 44:7520–40.
- Randerson, D. 1968. A study of air pollution sources as viewed by Earth satellites. J. Air Pollut. Control Assoc. 18:249–53. doi:10.1080/00022470.1968.10469123
- Reisinger, L.M., K.J. Olsznya, and T.L. Hetrick. 1989. Comparison of enhanced and routine methods for measuring ambient low-level sulfur dioxide. J. Air Pollut. Control Assoc. 39:981–3. doi:10.1080/08940630.1989.10466586
- Robinson, A.L., A.P. Grieshop, N.M. Donahue, and S.W. Hunt. 2010. Updating the conceptual model for fine particle mass emissions from combustion systems. J. Air Waste Manage. Assoc. 60:1204–22. doi:10.3155/1047-3289.60.10.1204
- Rubin, M.B. 2001. The history of ozone. I. The Schoenbein period, 1839–1868. Bull. Hist. Chem. 26:40–55.
- Ruff, R.E., K.C. Nitz, F.L. Ludwig, C.M. Bhumralkar, J.D. Shannon, C.M. Sheih, I.Y. Lee, R. Kumar, and D.J. McNaughton. 1985. Evaluation of three regional air quality models. Atmos. Environ. 19:1103–15. doi:10.1016/0004-6981(85)90195-7
- Ruzer, L., and N.H. Harley. 2013. Aerosols handbook: Measurement, dosimetry, and health effects, 2nd ed. New York, NY: CRC Press/Taylor & Francis.
- Saltzman, B.E. 1954. Colormetric microdetermination of nitrogen dioxide in the atmosphere. Anal. Chem. 26:1949–55. doi:10.1021/ac60096a025
- Sauer, F., S. Limbach, and G.K. Moortgat. 1997. Measurements of hydrogen peroxide and individual organic peroxides in the marine troposphere. Atmos. Environ. 31:1173–84. doi:10.1016/S1352-2310(96)00289-0
- Scheffe, R.D., B.J. Hubbell, T.D. Fox, V.B. Rao, and W.R. Pennell. 2007. The rationale for a multipollutant, multimeda air quality management framework. EM May:14–20.
- Scheffe, R.D., P.A. Solomon, R.B. Husar, T. Hanley, M. Schmidt, M. Koerber, M. Gilroy, J. Hemby, N. Watkins, M. Papp, J. Rice, J. Tikvart, and R. Valentinetti. 2009. The national ambient air monitoring strategy: Rethinking the role of national networks. J. Air Waste Manage. Assoc. 59:579–90. doi:10.3155/1047-3289.59.5.579
- Schmid, H.P., L. Laskus, H.J. Abraham, U. Baltensperger, V.M.H. Lavanchy, M. Bizjak, P. Burba, H. Cachier, D. Crow, J.C. Chow, T. Gnauk, A. Even, H.M. ten Brink, K.P. Giesen, R. Hitzenberger, C. Hueglin, W. Maenhaut, C.A. Pio, J. Puttock, J.P. Putaud, D. Toom-Sauntry, and H. Puxbaum. 2001. Results of the “Carbon Conference” international aerosol carbon round robin test: Stage 1. Atmos. Environ. 35:2111–21.
- Schuette, F.J., and P.K. Mueller. 1964. Measurement of atmospheric hydrocarbons of prime importance. Clean Air Q. 8:16–8.
- Schuetzle, D., D. Cronn, A.L. Crittenden, and R.J. Charlson. 1975. Molecular composition of secondary aerosol and its possible origin. Environ. Sci. Technol. 9:838–45. doi:10.1021/es60107a007
- ScienceEncyclopedia 2017. Carbon dioxide. Net Industries. http://science.jrank.org/pages/1209/Carbon-Dioxide.html ( accessed March 1, 2017).
- Sem, G.J., K.T. Whitby, and G.M. Sverdrup. 1980. Design, instrumentation and operation of a large mobile air pollution laboratory. In The character and origins of smog aerosols, ed. G.M. Hidy, P.K. Mueller, D. Grosjean, B.R. Appel, and J.J. Wesolowski. New York, NY: Wiley Interscience. 55–68.
- Sickles, J.E., and D.S. Shadwick. 2015. Air quality and atmospheric deposition in the eastern US: 20 years of change. Atmos. Chem. Phys. 15:173–97.
- Sickles, J.E. II, and L.L. Hodson. 1989. Fate of nitrous acid on selected collection surfaces. Atmos. Environ. 23:2321–4. doi:10.1016/0004-6981(89)90193-5
- Sinclair, A.H., S. Melly, D. Tolsma, J. Spengler, L. Perkins, A. Rohr, and R.E. Wyzga. 2014. Childhood asthma acute primary care visits, traffic, and traffic-related pollutants. J. Air Waste Manage. Assoc. 64:561–7. doi:10.1080/10962247.2013.873093
- Smith, R.A. 1852. On the air and rain of Manchester. In Memoirs of the Literary and Philosophical Society of Manchester, 207–17. Manchester, UK: Manchester Literary and Philosophical Society.
- Smith, S., K. Del-Cid, A.O. Martins, and J. Urion. 2014. Sulfur dioxide. Prezi, San Francisco, CA. https://prezi.com/67b9czcz8qie/sulfur-dioxide ( accessed March 1, 2017).
- Snyder, D.T., C.J. Pulliam, Z. Ouyang, and R.G. Cooks. 2016. Miniature and fieldable mass spectrometers: Recent advances. Anal. Chem. 88:2–29. doi:10.1021/acs.analchem.5b03070.
- Snyder, E.G., T.H. Watkins, P.A. Solomon, E.D. Thoma, R.W. Williams, G.S.W. Hagler, D. Shelow, D.A. Hindin, V.J. Kilaru, and P.W. Preuss. 2013. The changing paradigm of air pollution monitoring. Environ. Sci. Technol. 47:11369–77. doi:10.1021/es4022602
- Solomon, P.A., and T. Silver. 1994. Planning and managing regional air quality, modeling and measurement studies. Boca Raton, FL: CRC Press.
- Solomon, P.A., E. Cowling, G.M. Hidy, and C. Furiness. 2000. Comparison of scientific findings from major ozone field studies in North America and Europe. Atmos. Environ. 34:1885–920. doi:10.1016/S1352-2310(99)00453-7
- Solomon, P.A., P.K. Hopke, J. Froines, and R.D. Scheffe. 2008. Key scientific findings and policy- and health-relevant insights from the US Environmental Protection Agency’s particulate matter supersites program and related studies: An integration and synthesis of results. J. Air Waste Manage. Assoc. 58:S3–92. doi:10.3155/1047-3289.58.13.S-1
- Solomon, P.A., and C. Sioutas. 2008. Continuous and semicontinuous monitoring techniques for particulate matter mass and chemical components: A synthesis of findings from EPA’s particulate matter supersites program and related studies. J. Air Waste Manage. Assoc. 58:164–95. doi:10.3155/1047-3289.58.2.164
- South Coast Air Management District. 2017. AQ-SPEC: Air quality sensor performance evaluation center. South Coast Air Management District, Diamond Bar, CA. http://www.aqmd.gov/aq-spec ( accessed March 1, 2017).
- Spengler, J.D., and B.G. Ferris, Jr. 1985. Harvard Air Pollution Health Study in six cities in the U.S.A. J. Exp. Med. 10:263–86.
- Spicer, C.W., and P.M. Schumacher. 1979. Particulate nitrate: Laboratory and field studies of major sampling interferences. Atmos. Environ. 13:543–52. doi:10.1016/0004-6981(79)90149-5
- Spicer, C.W., D.V. Kenny, G.F. Ward, I.H. Billick, and N.P. Leslie. 1994. Evaluation of NO2 measurement methods for indoor air quality applications. J. Air Waste Manage. Assoc. 44:163–8. doi:10.1080/1073161X.1994.10467245
- Spicer, C.W., D.W. Joseph, and W.M. Ollison. 2010. A re-examination of ambient air ozone monitor interferences. J. Air Waste Manage. Assoc. 60:1353–64. doi:10.3155/1047-3289.60.11.1353
- Stern, A.C. 1982. History of air pollution legislation in the United States. J. Air Pollut. Control Assoc. 32:44–61. doi:10.1080/00022470.1982.10465369
- Stolarski, R.S. 2017. History of the study of atmospheric ozone. National Aeronautics & Space Administration, Greenbelt, MD. https://acd-ext.gsfc.nasa.gov/People/Stolarski/history.html ( accessed March 1, 2017).
- Syms, R.A., and S. Wright. 2016. MEMS mass spectrometers: The next wave of miniaturization. J. Micromech. Microeng. 26:023001. doi:10.1088/0960-1317/26/2/023001
- Temple, P.J., D.L. McLaughlin, and R. Wills. 1981. Moss bags as monitors of atmospheric deposition. J. Air Pollut. Control Assoc. 31:668–70. doi:10.1080/00022470.1981.10465261
- Thomas, J.F., B.D. Tebbens, E.N. Sanborn, and J.M. Cripps. 1960. Fluorescent spectra of aromatic hydrocarbons found in polluted atmospheres. Int. J. Air Pollut. 2:210–20.
- TNI. 2016. National Environmental Laboratory Accreditation Program (NELAP). The NELAC Institute (TNI), Weatherford, TX. http://www.nelac-institute.org ( accessed March 1, 2017).
- Tombach, I.H., D.W. Allard, R.L. Drake, and R.C. Lewis. 1987. Western Regional Air Quality Studies—Visibility and air quality measurements: 1981–1982. AeroVironment, Inc., Monrovia, CA.
- Topol, L., R. Schwall, and J. Silvestein. 1983. Description and format of data base for EPRI acid precipitation measurements. Electric Power and Research Institute, Palo Alto, CA.
- Topol, L., and R. Schwall. 1986. The Utility Acid Rain Study Program (UAPSP): Network description and measurements for 1981–1988. Electric Power and Research Institute, Palo Alto, CA.
- Trieff, N.M., H.C. Wohlers, J.A. O’Malley, and H. Newstein. 1968. Appraisal and modification of West-Gaeke method for sulfur dioxide determination. J. Air Pollut. Control Assoc. 18:329–31. doi:10.1080/00022470.1968.10469136
- Turpin, B.J., R.A. Cary, and J.J. Huntzicker. 1990. An in-situ, time-resolved analyzer for aerosol organic and elemental carbon. Aerosol Sci. Technol. 12:161–71. doi:10.1080/02786829008959336
- U.S. EPA. 1975. Guidance for air quality monitoring network design and instrument siting (revised). U.S. EPA, OAQPS, Research Triangle Park, NC.
- U.S. EPA. 1994. QA handbook for air pollution measurement systems: Vol. I—A field guide to environmental quality assurance. U.S. Environmental Protection Agency, Research Triangle Park, NC. http://www.epa.gov/ttn/amtic/files/ambient/qaqc/r94-038a.pdf ( accessed March 1, 2017).
- U.S. EPA. 1997. Guidance for siting ambient air monitors around stationary lead sources. U.S. Envirionmental Protection Agency, Research Triangle Park, NC. https://nepis.epa.gov/EPA/html/DLwait.htm?url=/Exe/ZyPDF.cgi/000033L7.PDF?Dockey=000033L7.PDF ( accessed March 1, 2017).
- U.S. EPA. 2007. Guidance for preparing standard operating procedures: EPA QA/G6. U.S. Environmental Protection Agency, Research Triangle Park, NC. http://www.epa.gov/QUALITY/qs-docs/g6-final.pdf ( accessed March 1, 2017).
- U.S. EPA. 2012. Near-road NO2 monitoring technical assistance document. U.S. Environmental Protection Agency, Research Triangle Park, NC. http://www.epa.gov/ttnamti1/files/nearroad/NearRoadTAD.pdf ( accessed March 1, 2017).
- U.S. EPA. 2013. QA handbook for air pollution measurement systems: Vol. II—Ambient air monitoring program. U.S. Environmental Protection Agency, Research Triangle Park, NC. https://www3.epa.gov/ttnamti1/files/ambient/pm25/qa/QA-Handbook-Vol-II.pdf ( accessed March 1, 2017).
- U.S. EPA. 2017a. How EPA manages the quality of its environmental data. U.S. Environmental Protection Agency, Research Triangle Park, NC. https://www.epa.gov/quality ( accessed March 1, 2017).
- U.S. EPA. 2017b. Photochemical assessment monitoring stations (PAMS). U.S. Environmental Protection Agency, Research Triangle Park, NC. https://www3.epa.gov/ttn/amtic/pamsmain.html ( accessed March 1, 2017).
- U.S. EPA. 2017c. Query AirData. U.S. Environmental Protection Agency, Research Triangle Park, NC. https://aqs.epa.gov/api ( accessed March 1, 2017).
- U.S. EPA. 2017d. Designation of hazardous substances. Code of Federal Regulations Title 40, Part 116.
- U.S. EPA. 2017e. Technical air pollution resources. U.S. Environmental Protection Agency, Research Triangle Park, NC. https://www.epa.gov/technical-air-pollution-resources ( accessed March 1, 2017).
- U.S. EPA. 2017f. Near-road NO2 monitoring. U.S. Envirionmental Protection Agency, Research Triangle Park, NC. https://www3.epa.gov/ttnamti1/nearroad.html ( accessed March 1, 2017).
- U.S. EPA. 2017g. NCore multipollutant monitoring network. U.S. Environmental Protection Agency, Research Triangle Park, NC. https://www3.epa.gov/ttnamti1/ncore.html ( accessed March 1, 2017).
- U.S. EPA. 2017h. SLAMS and related ambient air monitoring networks. U.S. Environmental Protection Agency, Research Triangle Park, NC. https://www3.epa.gov/ttnamti1/slams.html ( accessed March 1, 2017).
- U.S. EPA. 2017i. Chemical speciation. U.S. Environmental Protection Agency, Research Triangle Park, NC. http://www.epa.gov/ttn/amtic/speciepg.html ( accessed March 1, 2017).
- U.S. EPA. 2017j. Clean Air Status and Trends Network. U.S. Environmental Protection Agency, Washington, DC. http://www.epa.gov/castnet ( accessed March 1, 2017).
- U.S. EPA. 2017k. Air toxics—National air toxics trends stations. U.S. Envirionmental Protection Agency, Research Triangle Park, NC. https://www3.epa.gov/ttnamti1/natts.html ( accessed March 1, 2017).
- U.S. EPA. 2017l. National air quality: Status and trends of key air pollutants. U.S. Envirionmental Protection Agency, Research Triangle Park, NC. http://www.epa.gov/airtrends/index.html ( accessed March 1, 2017).
- U.S. EPA. 2017m. PM2.5 speciation lab audit reports and assessments. U.S. Environmental Protection Agency, Research Triangle Park, NC. http://www.epa.gov/ttn/amtic/pmspec.html ( accessed March 1, 2017).
- Vedal, S. 1997. Critical review—Ambient particles and health: Lines that divide. J. Air Waste Manage. Assoc. 47:551–81. doi:10.1080/10473289.1997.10463922
- Wang, X.L., J.G. Watson, J.C. Chow, S. Gronstal, and S.D. Kohl. 2012. An efficient multipollutant system for measuring real-world emissions from stationary and mobile sources. Aerosol Air Qual. Res. 12:145–60. doi:10.4209/aaqr.2011.11.0187
- Watson, J.G. 2002. Visibility: Science and regulation—2002 Critical review. J. Air Waste Manage. Assoc. 52:628–713. doi:10.1080/10473289.2002.10470813
- Watson, J.G., J.C. Chow, and J.J. Shah. 1981. Analysis of inhalable and fine particulate matter measurements. U.S. Environmental Protection Agency, Research Triangle Park, NC. http://www.dri.edu/images/stories/editors/eafeditor/Watsonetal1981EPASJVInhalableParticulateReport.pdf ( accessed March 1, 2017).
- Watson, J.G., J.C. Chow, L.W. Richards, S.R. Andersen, J.E. Houck, and D.L. Dietrich. 1988. The 1987–88 Metro Denver Brown Cloud Air Pollution Study, Volume II: Measurements. Desert Research Institute, Reno, NV. https://www.researchgate.net/publication/235341744_The_1987-88_Metro_Denver_Brown_Cloud_Air_Pollution_Study_Volume_II_Measurements ( accessed March 1, 2017).
- Watson, J.G., J.L. Bowen, J.C. Chow, C.F. Rogers, M.G. Ruby, M.J. Rood, and R.T. Egami. 1989. High volume measurement of size classified suspended particulate matter. In Methods of air sampling and analysis, ed. J.P. Lodge, 3rd ed., 427–39. Chelsea, MI: Lewis.
- Watson, J.G., J.C. Chow, R.T. Egami, J.L. Bowen, C.A. Frazier, A.W. Gertler, D.H. Lowenthal, and K.K. Fung. 1991. Measurements of dry deposition parameters for the California Acid Deposition Monitoring Program. Desert Research Institute, Reno, NV. http://www.arb.ca.gov/research/apr/past/a6-076-32.pdf ( accessed March 1, 2017).
- Watson, J.G., P.J. Lioy, and P.K. Mueller. 1995a. The measurement process: Precision, accuracy, and validity. In Air sampling instruments for evaluation of atmospheric contaminants, 8th ed., ed. B.S. Cohen and S.V. Hering,187–94. Cincinnati, OH: American Conference of Governmental Industrial Hygienists.
- Watson, J.G., G.D. Thurston, N.H. Frank, J.P. Lodge, R.W. Wiener, F.F. McElroy, M.T. Kleinman, P.K. Mueller, A.C. Schmidt, F.W. Lipfert, R.J. Thompson, P.K. Dasgupta, D. Marrack, R.A. Michaels, T. Moore, S. Penkala, I.H. Tombach, L. Vestman, T. Hauser, and J.C. Chow. 1995b. Measurement methods to determine compliance with ambient air quality standards for suspended particles: Critical review discussion. J. Air Waste Manage. Assoc. 45:666–84. doi:10.1080/10473289.1995.10467395
- Watson, J.G., J.C. Chow, D.W. DuBois, M.C. Green, N.H. Frank, and M.L. Pitchford. 1997a. Guidance for network design and optimal site exposure for PM2.5 and PM10. U.S. Environmental Protection Agency, Research Triangle Park, NC. http://www.epa.gov/ttn/amtic/files/ambient/pm25/network/r-99-022.pdf ( accessed March 1, 2017).
- Watson, J.G., R.E. Wyzga, R.T. Burnett, J.J. Vostal, I. Romieu, J.C. Chow, J.T. Holcombe, F.W. Lipfert, D. Marrack, R.J. Thompson, and S. Vedal. 1997b. Ambient particles and health—Lines that divide: 1997 Critical review discussion. J. Air Waste Manage. Assoc. 47:995–1008. doi:10.1080/10473289.1997.10463950
- Watson, J.G., J.C. Chow, H. Moosmüller, M.C. Green, N.H. Frank, and M.L. Pitchford. 1998a. Guidance for using continuous monitors in PM2.5 monitoring networks. U.S. Environmental Protection Agency, Research Triangle Park, NC. http://www.epa.gov/ttn/amtic/pmpolgud.html ( accessed March 1, 2017).
- Watson, J.G., D.W. DuBois, R. DeMandel, A.P. Kaduwela, K.L. Magliano, C. McDade, P.K. Mueller, A.J. Ranzieri, P.M. Roth, and S. Tanrikulu, S. 1998b. Field program plan for the California Regional PM2.5/PM10 Air Quality Study (CRPAQS). Desert Research Institute, Reno, NV. http://www.arb.ca.gov/airways/crpaqs/publications.htm ( accessed March 1, 2017).
- Watson, J.G., E.M. Fujita, J.C. Chow, B. Zielinska, L.W. Richards, W.D. Neff., and D. Dietrich. 1998c. Northern Front Range Air Quality Study. Final report. Desert Research Institute, Reno, NV. https://www.dri.edu/images/stories/editors/eafeditor/Watsonetal1998NFRAQSFinal.pdf ( accessed March 1, 2017).
- Watson, J.G., J.C. Chow, and C.A. Frazier. 1999. X-ray fluorescence analysis of ambient air samples. In Elemental analysis of airborne particles, Vol. 1, ed. S. Landsberger and M. Creatchman, 67–96. Amsterdam, The Netherlands: Gordon and Breach Science.
- Watson, J.G., J.C. Chow, and E.M. Fujita. 2001. Review of volatile organic compound source apportionment by chemical mass balance. Atmos. Environ. 35:1567–84. doi:10.1016/S1352-2310(00)00461-1
- Watson, J.G., J.C. Chow, and L.-W.A. Chen. 2005. Summary of organic and elemental carbon/black carbon analysis methods and intercomparisons. Aerosol Air Qual. Res. 5:65–102.
- Watson, J.G., J.C. Chow, L.-W.A. Chen, and N.H. Frank. 2009. Methods to assess carbonaceous aerosol sampling artifacts for IMPROVE and other long-term networks. J. Air Waste Manage. Assoc. 59:898–911. doi:10.3155/1047-3289.59.8.898
- Watson, J.G., and J.C. Chow. 2011. Ambient aerosol sampling. In Aerosol measurement: Principles, techniques and applications, 3rd ed., ed. P. Kulkarni, P.A. Baron, and K. Willeke, 591–614. Hoboken, NJ: Wiley.
- Watson, J.G., J.C. Chow, L.-W.A. Chen, S.D. Kohl, and G.S. Casuccio. 2012. Elemental analysis of filter tape deposits from beta attenuation monitors. Atmos. Res. 106:181–9. doi:10.1016/j.atmosres.2011.12.004
- Watson, J.G., J.C. Chow, R.J. Tropp, X.L. Wang, S.D. Kohl, and L.-W.A. Chen. 2013. Standards and traceability for air quality measurements: Flow rates and gaseous pollutants. MAPAN—J. Meteorol. Soc. India 28:167–79. doi:10.1007/s12647-013-0071-z
- Watson, J.G., J.C. Chow, G. Engling, L.-W.A. Chen, and X.L. Wang. 2016. Source apportionment: Principles and methods. In Airborne particulate matter: Sources, atmospheric processes and health, ed. R.M. Harrison, 72–125. London, UK: Royal Society of Chemistry.
- Weber, R., D. Orsini, Y. Duan, K. Baumann, C.S. Kiang, W.L. Chameides, Y.N. Lee, F. Brechtel, P. Klotz, P. Jongejan, H.M. ten Brink, J. Slanina, C.B. Boring, Z. Genfa, P.K. Dasgupta, S.V. Hering, M.R. Stolzenburg, D.D. Dutcher, E. Edgerton, B. Hartsell, P.A. Solomon, and R.L. Tanner. 2003. Intercomparison of near real time monitors of PM2.5 nitrate and sulfate at the U.S. Environmental Protection Agency Atlanta Supersite. J. Geophys. Res. 108: SOS 9-1–9-13. doi:10/1029/2001JD001220
- Weber, R.J., D. Orsini, Y. Daun, Y.N. Lee, P.J. Klotz, and F. Brechtel. 2001. A particle-into-liquid collector for rapid measurement of aerosol bulk chemical composition. Aerosol Sci. Technol. 35:718–27. doi:10.1080/02786820152546761
- Wedding, J.B., and M.A. Weigand, M.A. 1993. An automatic particle sampler with beta gauging. J. Air Waste Manage. Assoc. 43:475–79. doi:10.1080/1073161X.1993.10467146
- Weinstein-Lloyd, J.B., P.H. Daum, J. Nunnermacker, J.H. Lee, and L.I. Kleinmann. 1996. Measurement of peroxides and related species in the 1993 North Atlantic Regional Experiment. J. Geophys. Res. Atmos. 101:29081–90. doi:10.1029/95JD03431
- Went, F.W. 1960. Blue hazes in the atmosphere. Nature, 187:641–3. doi:10.1038/187641a0
- Wesely, M.L., and B.B. Hicks. 1977. Some factors that affect the deposition rates of sulfur dioxide and similar gases on vegetation. J. Air Pollut. Control Assoc. 27:1110–16. doi:10.1080/00022470.1977.10470534
- West, P.W., and G.C. Gaeke. 1956a. ISC method no. 42401-01-69. Anal. Chem. 28:1816.
- West, P.W., and G.C. Gaeke. 1956b. Fixation of sulfur dioxide as disulfitomercurate(II) and subsequent colorimetric estimation. Anal. Chem. 28:1816–9.
- Wetzel, G., H. Fischer, and H. Oelhaf, H. 1995. Remote sensing of trace gases in the mid-infrared spectral region from a nadir view. Appl. Opt., 34:467–79. doi:10.1364/AO.34.000467
- Wexler, A.S., and M.V. Johnston. 2008. What have we learned from highly time-resolved measurements during EPA’s Supersites program,and related studies? J. Air Waste Manage. Assoc. 58:303–19. doi:10.3155/1047-3289.58.2.303
- Whitby, K.T., B.Y.H. Liu, R.B. Husar, and N.J. Barsic. 1972. The Minnesota aerosol-analyzing system used in the Los Angeles smog project. In Aerosols and atmospheric chemistry, ed. G.M. Hidy, 189–217. New York, NY: Academic Press.
- Whitby, K.T., and G.M. Sverdrup. 1980. California aerosols: their physical and chemical characteristics In The character and origins of smog aerosols, ed. G.M. Hidy, P.K. Mueller, D. Grosjean, B.R. Appel, and J.J. Wesolowski, 477–517. New York, NY: John Wiley and Sons.
- Whytlaw-Gray, R., J.B. Speakman, and J.H.P. Campbell. 1923. Smokes: Part I. A study of their behaviour and a method of determining the number of particles they contain. Proceedings of the Royal Society of London. Series A 102:600–15. doi:10.1098/rspa.1923.0018
- Williams, B.J., A.H. Goldstein, D.B. Millet, R. Holzinger, N.M. Kreisberg, S.V. Hering, A.B. White, D.R. Worsnop, J.D. Allan, and J.L. Jimenez. 2007. Chemical speciation of organic aerosol during the International Consortium for Atmospheric Research on Transport and Transformation 2004: Results from in situ measurements. J. Geophys. Res. Atmos. 112. doi:10.1029/2006JD007601
- Winer, A.M., J.W. Peters, J.P. Smith, and J.N. Pitts, Jr. 1974. Response of commercial chemiluminescence NO-NO2 analyzers to other nitrogen-containing compounds. Environ. Sci. Technol. 8:1118–21. doi:10.1021/es60098a004
- Wolff, G.T., and R.L. Klimisch. 1982. Particulate carbon: Atmospheric life cycle. New York, NY: Plenum Press.
- Yanca, C.A., D.C. Barth, K.A. Petterson, M.P. Nakanishi, J.A. Cooper, B.E. Johnsen, R.H. Lambert, and D.G. Bivins. 2006. Validation of three new methods for determination of metal emissions using a modified Environmental Protection Agency Method 301. J. Air Waste Manage. Assoc. 56:1733–42. doi:10.1080/10473289.2006.10464578
- Zhang, J., S. Yan, D. Yuan, G. Alici, N.T. Nguyen, M.E. Warkiani, and W.H. Li. 2016. Fundamentals and applications of inertial microfluidics: A review. Lab Chip 16:10–34. doi:10.1039/c5lc01159k
- Zhang, L.C., J. Hu, Y. Lv, and X.D. Hou. 2010. Recent progress in chemiluminescence for gas analysis. Appl. Spectrosc. Rev. 45:474–89. doi:10.1080/05704928.2010.503527