
ABSTRACT
Biomethanization is a new technology used for green-waste valorization where organic waste is biodegraded by microbial communities under anaerobic conditions. The main product of this type of anaerobic digestion is a biogas used as an energy source. Moving and handling organic waste may lead to the emission of high concentrations of bioaerosols. High exposure levels are associated with adverse health effects amongst green environment workers. Fungal spores are suspected to play a role in many respiratory illnesses. There is a paucity of information related to the detailed fungal diversity in biomethanization facilities. The aim of this study was to provide an in-depth description of fungal bioaerosols in biomethanization work environments using a next-generation sequencing approach combined with real-time polymerase chain reaction (PCR). Two biomethanization facilities treating different wastes were visited during the sampling campaign (n = 16). Quantification of Penicillium/Aspergillus and Aspergillus fumigatus revealed a greater exposure risk during summer for both facilities visited. Concentrations of Penicillium and Aspergillus were similar in all work areas in both biomethanization facilities. Taxonomy analyses showed that the type of waste treated affects the fungal diversity of aerosols emitted. Although eight classes were evenly distributed in all samples, Eurotiomycetes were more dominant in the first facility and Agaricomycetes were dominant in the second one. A large diversity profile was observed in bioaerosols from both facilities showing the presence of pathogenic fungi. The following fungi detected are known allergens and/or are opportunistic pathogens: Aspergillus, Malassezia, Emericella, Fusarium, Acremonium, and Candida. Daily exposure to these fungi may put workers at risk. The information from this study can be used as a reference for minimizing occupational exposure in future biomethanization facilities.
Implications: Biomethanization is a new technology used for green-waste valorization where organic waste is biodegraded by microbial communities. Effective waste management is increasingly recognized as a strategic approach for achieving newly created regulations concerning the disposal of organic residues; therefore, an expansion of facilities is expected. Workers’ exposure to diverse fungal communities is certain, as fungi are ubiquitous and necessary in organic matter decomposition. Monitoring this occupational exposure is important in order to prevent workers’ health problems.
Introduction
Approximately 1.3 billion tons of solid waste is collected worldwide every year. This number is expected to increase to 2.2 billion tons by 2025, with almost all of the increase coming from developing countries (Hoornweg and Bhada-Tata Citation2012). Effective waste management is increasingly recognized as a strategic approach for achieving newly created regulations concerning the disposal of organic residues (Collagher, Campbell, and Brenner Citation2017; Mahajan and Vakhariya Citation2016; United Nations Department of Social and Economic Development Citationn.d.).
Composting has become a promising technology for managing different types of organic waste (Sykes, Jones, and Wildsmith Citation2007). Composting involves the degradation of organic matter by a complex microbial community under aerobic conditions where gram-positive and gram-negative bacteria and fungi are present (Hansgate et al. Citation2005; Ishii, Fukui, and Takii Citation2000; Ryckeboer et al. Citation2003). Unfortunately, composting is also linked to health hazards associated with bioaerosols emitted during several of the necessary composting steps (Epstein et al. Citation2001; Sanchez-Monedero et al. Citation2005; Persoons et al. Citation2010; Taha et al. Citation2005). Greenhouse gases are also emitted, and depending on the quality, the final product of composting cannot always be used as fertilizer (Fuchs and Bieri Citation2000; Lim, Lee, and Wu Citation2016).
Biomethanization is another technology used for green-waste valorization where organic waste is biodegraded by microbial communities under anaerobic conditions. The main product of this type of anaerobic digestion is a biogas made up of approximately 65% methane and 35% carbon dioxide (Mata-Alvarez Citation2003). Because the biogas contains methane, it can be used as an energy source in the same way as natural gases (Amon et al. Citation2007; Dai et al. Citation2017; Karakurt, Aydin, and Aydiner Citation2011; Lee and Holder Citation2001). For example, the biogas produced from biomethanization can be used to heat facilities, operate generators, or fuel vehicles.
Another advantage of biomethanization is the ability to process all types of organic waste ranging from municipal green waste, industrial food waste, to sewage sludge and animal (cattle, cow, and pig) manure (Bouallagui et al. Citation2005; El-Mashad et al. Citation2003; Macias-Corral et al. Citation2008; Murto, Björnsson, and Mattiasson Citation2004; Sosnowski, Wieczorek, and Ledakowicz Citation2003). Waste management using this type of anaerobic digestion is more cost-effective and less harmful to the environment compared with composting.
Waste management environments are often associated with increased bioaerosols. Composting activities such as load reception, handling, shredding, pile-turning, and screening of organic matter all contribute to bioaerosol emissions (Viegas et al. Citation2015). Exposure to high concentrations of these bioaerosols, composed predominantly of bacteria and fungi, suggests a potential health risk (Epstein et al. Citation2001; Sanchez-Monedero et al. Citation2005; Persoons et al. Citation2010; Taha et al. Citation2005). Respiratory symptoms are among the most prevalent bioaerosol-associated health effects (Domingo and Nadal Citation2009) reported. Tracheobronchitis, mucosal irritations, sinusitis, eczema, dermatomycosis, and gastrointestinal problems are some examples of health-related complaints from compost workers and biowaste collectors (Bünger et al. Citation2000). Compared with other industrial activities, composting represents a greater risk to workers due to the presence of higher concentrations of Actinomycetes and thermophilic and/or thermotolerant fungi (Bünger et al. Citation2007).
In biomethanization facilities, exposure to high concentrations of bioaerosols is comparable to that at composting sites, as the delivery and the handling of the organic matter are similar in both settings. Because of the rapid development of biogas production using anaerobic digestion in eastern Canada, assessing workers’ exposure in biomethanization facilities is imperative. Even with this rapid development, few studies have addressed the issue of exposure. Dubuis et al. (Citation2017) described the bioaerosol concentrations and microbial composition of air samplers from a biomethanization environment, with a particular focus on bacteria. To the best of our knowledge, no previous studies have described the fungal composition of aerosols in this type of environment.
Most fungi are aerobic, but anaerobic fungi have also been shown to be a part of the microbial community in biogas reactors (Haitjema et al. Citation2014). These fungi possess highly active enzymes (plant cell wall–degrading enzymes) capable of degrading polysaccharides, which makes them likely participants in biomass degradation and biogas production (Kazda, Langer, and Bengelsdorf Citation2014). Therefore, their presence during the biomethanization process is expected. Workers’ exposure to diverse fungal communities is certain, as fungi are ubiquitous and necessary in organic matter decomposition (Anastasi, Varese, and Marchisio Citation2005; Hoorman Citation2011; Floudas et al. Citation2012; Hansgate et al. Citation2005; Langarica-Fuentes et al. Citation2014; De Gannes, Eudoxie, and William Citation2013). Exposure occurs during the reception and handling of the organic matter and can lead to a variety of health issues. Particularly, exposures to fungi, their secondary metabolites, and other components are believed to be associated with asthma, allergic alveolitis, chronic bronchitis, hypersensitivity pneumonitis, and infections, especially in people with impaired immune systems (Swan, Kelsey, and Crook Citation2003; Fung and Clark Citation2004; Pieckova and Wilkins Citation2004; Selman et al. Citation2010; Wyngaarden, Smith, and Bennett Citation1992; Latgé Citation1999; Velegraki et al. Citation2015; Rodriguez and Ramos Citation2014; Nucci and Anaissie Citation2007).
Fungi represent certain challenges when recovered from air, possibly due to their biochemical characteristics. A recent study identified the problem of fungal spore loss when recovered from air samples and proposed a new protocol that helped recover higher fungal concentrations than the traditional approaches. The newly developed protocol led to a more accurate assessment of fungal bioaerosol exposure (Mbareche et al., manuscript in preparation).
The aim of this study is to use the optimized protocol for fungal recovery from air samples using a next-generation sequencing approach combined with real-time polymerase chain reaction (PCR) to provide an in-depth description of fungal exposure in biomethanization work environments.
Materials and methods
Biomethanization facilities and site sampling
The two biomethanization facilities (BFs) visited were located in the province of Quebec (eastern Canada). Both plants treat different types of waste under different conditions. The first BF treats primary and secondary sludge from wastewater treatment plants and organic industrial food waste. At this facility, waste is treated under mesophilic conditions, and it has an annual capacity of 40,000 tons of waste. The second plant treats domestic waste under thermophilic conditions, with an annual capacity of 27,000 tons. In order to evaluate the effect of seasons on fungal exposure, the two facilities were visited once in the summer and again in the winter.
Five sites were sampled in the first BF: Reception, Treatment (shredding and mixing), Storage (of dry organic matter) and Maturation (of dry organic matter), Press filters (water removal of the sorting product), and Output (of finished products where the dried digestate is stored and loaded into trucks for further maturation).
In the second BF, two sites were sampled: the Reception site that included shredding and the Mixing site where the organic matter is mixed with a buffer before it is put into the digesters.
Air sampling
Air samples were collected during activities where workers were likely exposed to the aerosols associated with composting. To collect air samples a liquid cyclonic impactor, Coriolis µ (Bertin Technologies, Montigny-le-Bretonneux, France) set at 300 L/min for 10 min was placed in the center of the handling operations. Fifteen milliliters of sterile 50 mM phosphate-buffered saline (pH 7.4) were used to fill the sampling cone of the Coriolis.
At each site, three samples were collected. One was collected at the beginning, one in the middle, and one at the end of the process. Samples were then pooled to obtain a final volume of 45 mL for each sampled site, representing 9 m3 of air. An outdoor control air sample was also collected outside of each facility during the summer. The cold eastern Canadian weather did not allow for outdoor sampling during the winter because the Coriolis sampler is not designed to function in temperatures below zero degrees Celsius. Because of these same constraints, no samples were collected at the Storage and Maturation site in the first BF during winter.
Fungal spore concentration using the filtration protocol
The 45-mL samples from the Coriolis suspension were filtered through a 2.5-cm polycarbonate membrane (0.2 mm pore size; Millipore, Etobicoke, Ontario, Canada) using a vacuum filtration unit. The filters were placed in a 1.5-mL Eppendorf tube with 750 μL of extraction buffer (bead solution) from a MO BIO PowerLyzer Powersoil DNA isolation kit (Carlsbad, CA, USA) and a 0.3-cm tungsten bead. The filters were flash-frozen by placing the Eppendorf tube in a 99% ethanol solution and dry ice. The frozen filters were then pulverized using the tungsten steel bead in the Eppendorf tube in a bead-beating machine (Mixer Mill MM301; Retsch, Düsseldorf, Germany) set at a frequency of 20 movements per second for 20 min. The liquid containing the pulverized filter particles was used as aliquot for the first step of the DNA extraction procedure.
DNA extraction
Using the same bead-beating apparatus, a second bead-beating step using glass beads at a frequency of 20 movements per seconds for 10 min was performed to ensure that all of the cells were ruptured. Next, a MO BIO PowerLyzer Powersoil DNA isolation kit was used to extract the total genomic DNA from the samples following the manufacturer’s instructions. Next, the DNA was eluted in a 100 μL buffer, and stored at −20 °C until subsequent analyses.
Real-time PCR quantification
PCR was performed with a Bio-Rad CFX 96 thermocycler (Bio-Rad Laboratories, Mississauga, Ontario, Canada). The PCR mixture contained 2 μL of DNA template, 0.150 μmol/L per primer, 0.150 μmol/L probe, and 7.5 μL of 2× QuantiTect Probe PCR master mix (QuantiTect Probe PCR kit; Qiagen, Mississauga, Ontario, Canada) in a 15-μL reaction mixture. The results were analyzed using Bio-Rad CFX Manager software version 3.0.1224.1015 (Bio-Rad Laboratories). Aspergillus fumigatus was used for the standard curves of both quantitative PCR (qPCR) analyses (Penicillium/Aspergillus and Aspergillus fumigatus). presents the primers, probes, and PCR protocols used in this study.
Table 1. Primers, probes, and protocols used for qPCR quantification of selected microorganisms.
Next-generation sequencing
The rRNA fungal gene ITS1 was used for the next-generation sequencing analyses. Amplification of the amplicons, equimolar pooling, and sequencing were performed at the Plateforme d’analyses génomiques (IBIS, Université Laval, Quebec City, Quebec, Canada). Briefly, amplification of the ITS1 regions was performed using the sequence-specific regions described by Tedersoo et al. (Citation2015) and the references therein, using a two-step dual-indexed PCR approach specifically designed for Illumina instruments. First, the gene-specific sequence was fused to the Illumina TruSeq sequencing primers and PCR was carried out on a total volume of 25 µL of liquid made up of 1× Q5 buffer (NEB, xx, xx), 0.25 µM of each primer, 200 µM of each of the dNTPs, 1 U of Q5 High-Fidelity DNA polymerase (NEB), and 1 µL of template cDNA. The PCR started with an initial denaturation at 98 °C for 30 sec followed by 35 cycles of denaturation at 98 °C for 10 sec, annealing at 55 °C for 10 sec, extension at 72 °C for 30 sec and a final extension step at 72 °C for 2 min. The PCR reaction was purified using an Axygen PCR cleanup kit (Axygen, xx, xx). Quality of the purified PCR products was verified with electrophoresis (1% agarose gel). Fifty- to 100-fold dilution of this purified product was used as a template for a second round of PCR with the goal of adding barcodes (dual-indexed) and missing sequences required for Illumina sequencing. Cycling conditions for the second PCR were identical to the first PCR but with 12 cycles. The PCR products were purified as above, checked for quality on a DNA7500 Bioanlayzer chip (Agilent, Santa Clara, CA, USA), and then quantified spectrophotometrically with a Nanodrop 1000 (Thermo Fisher Scientific, xx, xx). Barcoded amplicons were pooled in equimolar concentrations for sequencing on the Illumina Miseq. The oligonucleotide sequences used for amplification are presented in .
Table 2. Primers used for Illumina amplification.
Please note that primers used in this work contain Illumina specific sequences protected by intellectual property (Oligonucleotide Sequences © 2007–2013 Illumina, Inc. All rights reserved). Derivative works created by Illumina customers are authorized for use with Illumina instruments and products only. All other uses are strictly prohibited.
Sequencing data processing
The bioinformatics workflow used in this study was developed during a compost study by Mbareche et al. (Citation2017). Briefly, after demultiplexing the raw FASTQ files, the reads generated from the paired-end sequencing using mothur 1.35.1 were combined (Schloss et al. Citation2009). Quality filtering was performed using mothur by discarding reads with ambiguous sequences. Reads shorter than 100 bp and longer than 450 bp were also discarded. Similar sequences were combined to reduce the computational burden, and the number of copies of the same sequence was displayed. This dereplication step was performed using USEARCH (version 7.0.1090; Edgar Citation2010). The selected region of fungal origin was then extracted from the sequences with ITSx, which uses HMMER3 (Mistry et al. Citation2013) to compare input sequences against a set of models built from a number of different internal transcribed spacer (ITS) region sequences found in various organisms. Only the sequences belonging to fungi were kept for further analyses. Operational taxonomic units (OTUs) with a 97% similarity cutoff were clustered using UPARSE (version 7.1; Edgar Citation2013). UCHIME was used to identify and remove chimeric sequences (Edgar Citation2011). QIIME (version 1.9.1; Caporaso et al. Citation2010) was used to assign taxonomy to OTUs based on a UNITE fungal ITS reference training data set for taxonomic assignment and to generate an OTU table. The fungal diversity analysis was achieved by using different QIIME scripts (http://qiime.org/scripts/).
Statistical analysis
Descriptive statistics were used on sequencing data to highlight significant differences in the observed OTUs showed with box plots. The normality was verified by the D’Agostino-Pearson omnibus normality test. The normality assumption on data was not fulfilled. Nonparametric Mann-Whitney U test analyses were performed to highlight significant differences showing a P value of less than 0.05. The results were analyzed using the software GraphPad Prism 5.03 (GraphPad Software, La Jolla, CA, USA).
To determine the statistical significance of the variation observed with the principal coordinates analysis (PCoA), a permutational multivariate analysis of variance (PERMANOVA) test was performed on the Bray-Curtis dissimilarity matrix. The QIIME script of the compared categories was used to generate the statistical results.
Results
Concentrations of fungi in biomethanization facilities were quantified per cubic meter of air. Penicillium/Aspergillus spp. and Aspergillus fumigatus were the microorganisms selected for qPCR-based analyses because of their potentially hazardous effects. Concentrations of Penicillium/Aspergillus spp. ranged from 6.4 × 10² to 1.2 × 10⁴ ITS genes/m3 (). No significant difference was observed between the two biomethanization facilities. However, all of the measured concentrations were higher during summer compared with winter for both facilities. For BF1, Reception, Storage, and Output sites represented the highest concentrations of Penicillium/Aspergillus spp. (104 ITS genes/m3). For BF2, similar concentrations were noted at the Reception/Shredding site and were higher than concentrations identified at the Mixing site. Aspergillus fumigatus was detected in samples from all of the sampling sites in both facilities (). Concentrations ranged from 9.6 × 101 to 1.2 × 10⁴ ITS genes/m3. Comparisons between the facilities during summer and winter showed trends similar to the Penicillium/Aspergillus spp. results. The highest concentrations (103 ITS genes/m3) of Aspergillus fumigatus were found in the Storage and Output sites in BF1 during summer. In BF2, the Reception/Shredding site had the highest concentration (1.2 × 10⁴ ITS genes/m3) of Aspergillus fumigatus during summer. However, this same site exhibited a lower concentration (2.7 × 10² ITS genes/m3) during winter.
Figure 1. Concentrations of Penicillium/Aspergillus spp. (Pen-Asp) in the air at sampling sites from both biomethanization facilities during summer and winter. The Storage site was not sampled during winter due to cold temperatures. The detection limit was 3 × 101 Pen-Asp/m3.
Figure 2. Concentrations of Aspergillus fumigatus spores in the air at sampling sites from both biomethanization facilities during summer and winter. The Storage site was not sampled during winter due to cold temperatures. The detection limit was 5 × 101 A. fumigatus/m3.
Differences between concentrations of Penicillium/Aspergillus spp. and Aspergillus fumigatus from each sampling site were approximately 1 log, which indicates a dominance of Aspergillus fumigatus in bioaerosol samples.
Outdoor control samples collected during each visit were below the qPCR detection limit.
To further assess fungal bioaerosols, fungal communities were analyzed by Illumina Miseq sequencing of the ITS1 region of the fungal ribosomal RNA encoding genes. After quality filtering, dereplication, and chimera checking, 507,842 sequences were clustered into 5132 OTUs. In order to confirm that the sequencing depth was adequate to describe the fungal diversity at each of the sites, rarefaction analyses were performed using the observed OTUs alpha diversity metric. The lowest-depth sample parameter was used to determine the sequencing depth threshold for rarefaction analyses. Samples with a lower sequencing depth than the one determined were excluded from analyses. The higher the sequencing depth, the more likely diversity coverage will be attained. In this case, the sequencing depth was approximately 8000 sequences per sample. All samples met this criterion and were included in the analyses except the outdoor all control samples exhibited sequence numbers that were too low. The values shown in were calculated as follows: 10 values from 10–8000 sequences per sample were randomly selected. For each of these values, the corresponding number of OTUs observed was noted for all of the samples. Then, the average number of OTUs observed (±1 standard deviation) was calculated for each of the 10 values. The plateau of the curves in indicates efficient coverage of the fungal diversity, as no more OTUs were observed even with greater numbers of sequences per sample.
Figure 3. Rarefaction curves obtained from the number of observed OTUs and the sequences per sample for air samples from the two biomethanization facilities visited. An average of the OTUs observed in each sample was calculated for all the samples (±1 standard deviation).
A Chao1 index was used to estimate species richness and to make comparisons between the two biomethanization facilities in the summer and winter. shows greater species richness in air samples collected during summer compared with winter. However, the medians and standard deviations obtained (780 ± 425 for summer and 410 ± 364 for winter) show an important variation of species richness between the samples taken in both seasons.
Figure 4. Comparison of species richness estimator Chao1 index values from air samples from two biomethanization facilities collected during summer and winter. Statistical significance shown was by Mann-Whitney U test analyses.
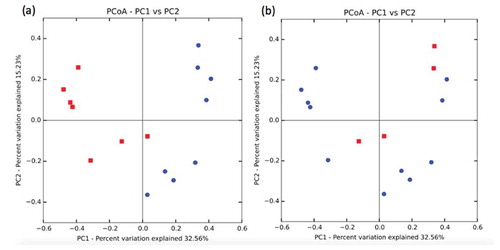
After estimating the overall within-community diversity (alpha), many next-generation sequencing surveys of microbial communities aim to compare the composition of different groups of samples (beta). In the current study, the two variables that may be responsible for the variation in fungal communities between samples are season and type of biomethanization facility. Each of the plants sampled treats a different type of waste. Therefore, samples could be grouped by season (summer/winter) and by facility (BF1/BF2). Ordination and the hierarchical clustering of the samples were used to visually compare community composition. One of the techniques commonly used by microbial ecologists relies on the creation of a dissimilarity matrix such as the Bray-Curtis index. This index was used to evaluate the distance, taken pairwise between samples. The index uses numbers between 0 and 1, where 0 means the two samples have the same composition and 1 means that they do not share any species. Because the Bray-Curtis dissimilarity matrix uses the absolute abundance of OTUs, it is necessary to use a rarefied OTU table as the input for the dissimilarity calculation. To evaluate ordination patterns, one of the most common methods used is principal coordinates analysis (PCoA). The dissimilarity matrix is used as an input for ordination calculation and clustering. shows the PCoA results obtained, with the samples colored according to season () and the type of facility from which the samples were collected (). The season appears to have a more pronounced effect on the fungal composition of the samples than the type of facility visited. In , samples collected during summer (colored red) are clustered together compared with the more scattered samples taken during winter (colored in blue). However, no particular pattern was observed when the samples were colored according to the type of facility (BF1 in blue and BF2 in red). All the dots on the figure are randomly dispersed (). The same variables used for color clustering in the PCoA analyses were used for the PERMANOVA test for the statistical significance of the sample clustering. This nonparametric multivariate analysis of variance method separates the distance matrix among sources of variation to describe the robustness and significance that a variable has in explaining the variations observed between samples. It is based on the ANOVA experimental design but analyses the variance and determine the significance by permutations, as it is a nonparametric test (Anderson et al. Citation2005). Whereas ANOVA/MANOVA assumes normal distributions and a Euclidean distance, PERMANOVA can be used with any distance measure as long as it is appropriate to the data set. The PERMANOVA testing results concur with the color grouping observation made with the PCoA analyses. The season clustering had a significant P value of 0.001, and the type of facility variable had a P value of 0.108.
Figure 5. Principal coordinates analysis of air samples taken from two different biomethanization facilities visited during summer and winter. (a) Samples colored according to the season (winter in blue and summer in red). (b) Samples colored according to the facility visited (BF1 in blue and BF2 in red).
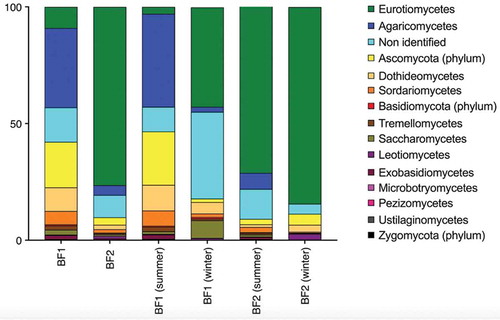
Taxonomic analysis allows for the identification of fungal communities present in the samples collected. shows the relative abundance of different taxa present in BF1 and BF2 during summer and winter. The taxonomic distributions represent the classes of fungi present at each facility, grouping all samples together and also separating them by season. Different fungal diversity profiles were observed in the air from both of the facilities visited. Agaricomycetes were the most abundant class in BF1, whereas Eurotiomycetes were dominant in BF2 air samples. This dominance in BF2 air samples was present during summer and winter, although summer samples were slightly more diverse than winter samples, overall. In samples from BF1, a more equal fungal distribution was observed compared with BF2 and more obvious differences were noted between summer and winter samples. Air from BF1 was composed of higher proportions of Agaricomycetes compared with other classes of fungi during summer and higher proportions of Eurotiomycetes compared with other classes of fungi during winter. Additionally, the occurrence of unidentified fungi was much greater during winter compared with summer.
Figure 6. Average relative abundances of fungal classes in air samples collected from two different biomethanization facilities visited during summer and winter.
The relative abundance of taxa was analyzed more thoroughly by identifying the 20 most abundant genera present in the biomethanization facilities during summer and winter. In BF1, only eight fungi were present in air samples collected during both seasons (). During summer, Hyphodontia, part of the Agaricomycetes class, represented 40% of all fungal genera present, followed by Davidiella representing 15% of genera. During winter, Penicillium and Talaromyces were most abundant, with relative abundances of 62% and 13%, respectively. In BF2, Penicillium was the dominant genera during summer and winter, with relative abundances of 82% and 90%, respectively (). Air samples collected during summer were more diverse, as only 10 fungi were identified during winter compared with the 20 identified during summer. The diversity profiles were larger than what are shown in the figures, but due to graphical limitations only the most abundant fungi are represented.
Figure 7. Venn diagram showing the 20 most abundant genera of fungi identified in air samples from BF1 during summer and during winter and those present during both seasons. The numbers are percentages of relative abundance. In the middle section, percentages of relative abundance of each fungus in summer and winter are separated by a vertical bar.
Figure 8. Venn diagram showing the 20 most abundant genera of fungi identified in air samples from BF2 during summer and during winter and those present during both seasons. The numbers are percentages of relative abundance. In the middle section, percentages of relative abundance of each fungus in summer and winter are separated by a vertical bar.
Discussion
Managing organic putrescible residual material is one of the major challenges of this century, as human population is still growing and so is consumption. Biomethanization facilities use the composting process to make renewable energy from waste materials. Workers’ exposure to fungal bioaerosols in composting environments has been previously investigated (Wéry Citation2014; Goff et al. Citation2010; Mbareche et al. Citation2017). However, exposure in biomethanization plants is less known. This study evaluates fungal exposure in two different biomethanization facilities. Air samples were collected from areas where workers are at risk and were analyzed by combining qPCR and a next-generation sequencing approach to thoroughly describe bioaerosol fungal composition. The combination of qPCR and next-generation sequencing adds a quantitative aspect to the quality feature brought by sequencing.
Penicillium/Aspergillus qPCR assay is an effective tool for measuring total quantities of Aspergillus/Penicillium conidia in aerosol samples (Haugland et al. Citation2004). Concentrations of these fungi revealed that there is a greater exposure risk during summer for both facilities due to input from the outside environment. The air surrounding a plant can influence bioaerosol compositions inside the plant depending on the type of sources that are present and the amount of air exchanged between the two environments. For example, BF2 had compost piles near the biomethanization plant, which may have influenced the fungal concentrations inside the facility. During winter, when there is less air exchange, quantities of fungi in aerosols were linked only to the organic waste treated. Concentrations of Penicillium and Aspergillus were similar in all work areas and in both biomethanization facilities. However, the zones of greatest concern are the Storage and the Output sites in BF1 and the Reception/Shredding site in BF2. The storage and output steps are both associated with the maturation process (the breakdown of material by microorganisms) of organic matter. And, during the reception and the shredding steps, workers come in direct contact with waste. Therefore, these steps are associated with the highest risks of fungal exposure in the two plants. Aspergillus fumigatus was specifically identified and quantified in areas of the biomethanization facilities where humans regularly work. This fungus is a known pathogenic agent that causes aspergillosis, allergic bronchopulmonary aspergillosis, and is associated with other pulmonary diseases (Dogra et al. Citation2016; Greenberger Citation2002). Similar conclusions can be drawn from the Aspergillus fumigatus and Penicillium and Aspergillus assays, as summer samples showed higher concentrations of these fungi compared with winter samples. Also, the Output/Storage and Reception/Shredding sites were the most exposed areas to Aspergillus fumigatus. qPCR analyses allowed the quantification of potentially hazardous fungal spores in bioaerosols and helped identify the work areas where human exposure, and consequently health effects, should be considered.
A previous study (Mbareche et al. Citation2017) used a next-generation sequencing approach targeting the ITS1 genomic region to produce an in-depth assessment of the fungal composition of bioaerosols released from composting sites. The analysis identified variations in fungal communities associated with the type of waste treated. The same approach was applied in this study to describe the fungal communities present in the air from biomethanization facilities. As expected, variations were observed between the two plants. BF1 treats sludge from wastewater plants, and BF2 treats domestic waste. Although the season seemed to influence variations in fungal communities more than the type of facility visited, as seen in results from the PCoA analysis, these results are likely influenced by the different input sources during each season due to changes in airflow from the outdoor environment. These results were consistent with those obtained from composting sites (Mbareche et al. Citation2017), supporting the idea that the type of waste treated influences the fungal composition of the bioaerosols released.
The type of waste product being processed can influence the genera present in aerosol samples. Agaricomycetes are a group of fungi known for their role in wood-decaying activities and in ectomycorrhizal symbiosis (Hibbett and Matheny Citation2009; Morgenstern, Klopman, and Hibbett Citation2008). A large portion of agricultural planting material in the waste processed at BF1 might explain the presence of this class of fungi. Eurotiomycetes are a class of fungi linked to processes such as fermentation used in food processing. Many genera of this class are natural decomposers and are involved in food spoilage (Geiser et al. Citation2006; Pitt and Hocking Citation2009). The presence of natural or processed foods (e.g., fruits, vegetables, dairy, etc.) at BF2 might explain the large abundance of Eurotiomycetes detected in the air there. Some fungal genera identified in this study are commonly found in waste treatment environments: Aspergillus, Penicillium, Davidiella, Alternaria, Talaromyces, Neurospora, Capnobotryella, and Fusarium (Mbareche et al. Citation2017; Wéry Citation2014). Fungi detected in samples from summer and winter visits are ubiquitous in wood and plant debris, and several are crop pathogens. The differences in the relative abundance between the summer and winter visits can be explained either by the direct influence of the source (organic waste present at the time of sampling) or by the outdoor environment.
Overall, the application of the next-generation sequencing approach revealed a large fungal diversity profile in bioaerosols released from biomethanization activities. The presence of a diverse portrait of fungi in air may represent a risk for workers who are exposed on a daily basis. In some cases, the allergen/infective activity of the fungi may not be known and can increase the risks to workers. More specifically, the following fungi detected are known allergens and/or are opportunistic pathogens: Aspergillus, Malassezia, Emericella, Fusarium, Acremonium, and Candida. Malassezia causes skin disorders and can lead to invasive infections in immunocompetent individuals (Vlegraki et al. Citation2015). Emericella is a taxon of teleomorphs related to Aspergillus. Species of this group are known agents of chronic granulomatous disease (CGD; Matsuzawa et al. Citation2010). Acremonium causes fungemia in immunosuppressed patients (Rodriguez and Ramos Citation2014). Fusarium species are responsible for a broad range of health problems, from local and systemic infections to allergy-related diseases such as sinusitis, in immunodepressed individuals (Nucci and Anaissie Citation2007).
This study has some limitations: it included only molecular techniques and did not include traditional culture methods used in earlier studies, which would have provided a possibility for comparison with previous studies in waste management environments. In addition, there is a limitation linked to the database used and its taxonomic nomenclature. Cladosporium is the anamorph form of Davidiella. In this study, Davidiella was commonly found during summer and winter in the two facilities visited. The nonpresence of Cladosporium in our samples may be due to the well-described problem of double nomenclature in mycology. For example, in UniProt, Cladosporium herbarum have the scientific name of Davidiella tassiana.
As biomethanization activities represent an eco-friendly and energy-effective alternative to waste management, it is crucial to evaluate the exposure risk for biomethanization workers. This study addresses the concerns and risks associated with fungal exposure in bioaerosols released from biomethanization activities. The exposure risk to workers may increase, as the facilities included in this research will increase the amount of waste treated yearly. The information from this study can be used as a reference for minimizing occupational exposure in future biomethanization facilities.
Conclusion
This study highlights the importance of using a high-throughput sequencing method combined with a real-time qPCR assay for quantification and an in-depth characterization of fungal diversity in bioaerosols in order to assess occupational exposure. Based on the results of this investigation, the authors strongly recommend taking action to reduce workers’ exposure to these aerosols. Technical and organizational measures should be implemented in biomethanization facilities as a first resort. Such measures include better air exchange rates, better confinement, and source ventilation. If these initial measures cannot be taken, we recommend skin and respiratory protection for workers exposed on a daily basis as a means to reduce continuous exposure to harmful fungi present in bioaerosols. The broad spectrum of fungi detected in this study includes many know pathogenic agents, and adequate monitoring of exposure is necessary to diminish risks. This study supports the conclusion that there are fungal signatures associated with the type of waste treated. Additional studies should be conducted in any environment involving fungi susceptible to aerosolization in order to continue documenting fungal bioaerosols.
Acknowledgment
The authors are grateful to all of the employees of the biomethanization facilities who participated in this study. They are also grateful to the members of the IRSST who were in the field for their technical assistance. The authors are thankful to Amanda Kate Toperoff and Michi Waygood for English revision of the manuscript.
Additional information
Funding
Notes on contributors
Hamza Mbareche
Hamza Mbareche is a Ph.D. student in the Department of Biochemistry, Microbiology and Bioinformatics, Laval University, Quebec City, Quebec, Canada.
Marc Veillette
Marc Veillette is a researcher in the laboratory of Caroline Duchaine at the Centre de Recherche de l’Institut Universitaire de Cardiologie et de Pneumologie de Québec (CRIUCPQ), Quebec City, Quebec, Canada.
Marie-Ève Dubuis
Marie-Ève Dubuis is a Ph.D. student in the Department of Biochemistry, Microbiology and Bioinformatics, Laval University, Quebec City, Quebec, Canada.
Bouchra Bakhiyi
Bouchra Bakhiyi is a research scientist in the Department of Environmental and Occupational Health, School of Public Health, University of Montreal, Montreal, Quebec, Canada.
Geneviève Marchand
Geneviève Marchand is an associate professor in the Department of Environmental and Occupational Health, School of Public Health, University of Montreal, Montreal, Quebec, Canada, and a research scientist at the Institut de Recherche Robert-Sauvé en Santé et en Sécurité du Travail (IRSST), Montreal, Quebec, Canada.
Joseph Zayed
Joseph Zayed is an associate professor in the Department of Environmental and Occupational Health, School of Public Health, University of Montreal, Montreal, Quebec, Canada, and the leader of the IRSST Chemical and Biological Hazard Prevention research field.
Jacques Lavoie
Jacques Lavoie is an associate professor in the Department of Environmental and Occupational Health, School of Public Health, University of Montreal, Montreal, Quebec, Canada, and research scientist at the IRSST.
Guillaume J. Bilodeau
Guillaume J. Bilodeau is a research scientist at the Canadian Food Inspection Agency (CFIA), Ottawa Plant Laboratory, Fallowfield, Ontario, Canada, and the head of the Pathogen Identification Research Laboratory.
Caroline Duchaine
Caroline Duchaine is a professor in the Department of Biochemistry, Microbiology and Bioinformatics, Laval University, Quebec City, Quebec, Canada, and senior researcher at CRIUCPQ where she leads the bioaerosols research group. She is also head of the Quebec Bioaerosols and Respiratory Viruses Strategic Group of the Quebec Respiratory Health Network.
References
- Amon, T., B. Amon, V. Kryvoruchko, W. Zollitsch, K. Mayer, and L. Gruber. 2007. Biogas production from maize and dairy cattle manue-Influence of biomass composition on the methane yield. Agric., Ecosyst. & Environ. 118 (1–4):173–182. doi:10.1016/j.agee.2006.05.007.
- Anastasi, A., G.C. Varese, and V.F. Marchisio. 2005. Isolation and identification of fungal communities in compost and vermicompost. Mycologia 97:33–44. doi:10.3852/mycologia.97.1.33.
- Anderson, M. J. 2005. PERMANOVA: A FORTRAN computer program for permutational multivariate analysis of variance. Auckland, New Zealand: Department of Statistics, University of Auckland.
- Bouallagui, H., Y. Touhami, R. B. Cheikh, and M. Hamdi. 2005. Bioreactor performance in anaerobic digestion of fruit and vegetable wastes. Process Biochem. 40 (3–4):989–995. doi:10.1016/j.procbio.2004.03.007.
- BüNger, J., B. Schappler-Scheele, R. Hilgers, and E. Hallier. 2007. A 5-year follow-up study on respiratory disorders and lung function in workers exposed to organic dust from composting plants. Int. Arch. of Occup. and Environ. Health. 80:306–312. doi:10.1007/s00420-006-0135-2.
- Bünger, J., M. Antlauf-Lammers, T.G. Schulz, A.G. Westphal, M.M. MüLler, P. Ruhnau, and E. Hallier. 2000. Health complaints and immunological markers of exposure to bioaerosols among biowaste collectors and compost workers. Occup Environ Med. 57:458–464. doi:10.1136/oem.57.7.458.
- Caporaso, J. G., J. Kuczynski, J. Stombaugh, K. Bittinger, F.D. Bushman, E.K. Costello, R.N. Fiere, A. Gonzalez Pena, J.K. Goodrich, J.I. Gordon, G.A. Huttley, S.T. Kelley, D. Knights, J.E. Koenig, R. E. Ley, C.A. Lozupone, D. McDonald, B.D. Muegge, M. Pirrung, J. Reeder, J.R. Sevinsky, P.J. Turnbaugh, W. A. Walters, J. Widmann, T. Yatsunenko, J. Zaneveld, and R. Knight. 2010. QIIME allows analysis of high-throughput community sequencing data. Nat. Methods. 7 (5):335–336. doi:10.1038/nmeth.f.303.
- Collagher, M., J. Campbell, and A.M. Brenner. 2017. Collaboration achieves effective management design at Brookfield Place Berth, Western Australia. Procedia Eng. 180 (2017):1763–1772. doi:10.1016/j.proeng.2017.04.339.
- Dai, X., C. Hu, D. Zhang, and Y. Chen. 2017. A new method for the simultaneous enhancement of methane yield and reduction of hydrogen sulfide production in the anaerobic digestion of waste activated sludge. Bioresour. Technol. 243:914–921. doi:10.1016/j.biortech.2017.07.036.
- De Gannes, V., G. Eudoxie, and H. J. William. 2013. Insights into fungal communities in composts revealed by 454-pyrosequencing. Implications for Hum. Health and Saf. Front. in Microbiol. 4:164. doi:10.3389/fmicb.2013.00164.
- Dogra, V., A. K. Sinha, R. Saxena, and D. Talwar. 2016. Aspergillus march: From ABPA to aspergilloma to subacute invasive aspergillosis. Allergy, Asthma & Clin. Immunol. 12:64. doi:10.1186/s13223-016-0170-9.
- Domingo, J. L., and M. Nadal. 2009. Domestic waste composting facilities: A review of human health risks. Environ. Int. 35 (2):382–389. doi:10.1016/j.envint.2008.07.004.
- Dubuis, M.E., H. M’Bareche, M. Veillette, B. Bakhiyi, J. Zayed, J. Lavoie, and C. Duchaine. 2017. Bioaerosols concentrations in working areas in biomethanization facilities. J. Air Waste Manage. Assoc. 67 (11):1258–1271. doi:10.1080/10962247.2017.1356762.
- Edgar, R.C. 2010. Search and clustering orders of magnitude faster than BLAST. Bioinf. 26 (19):2460–2461. doi:10.1093/bioinformatics/btq461.
- Edgar, R.C. 2013. UPARSE: Highly accurate OTU sequences from microbial amplicon reads. Nat. Methods 10 (10):996–998. doi:10.1038/nmeth.2604.
- Edgar, R.C., B.J. Haas, J.C. Clemente, C. Quince, and R. Knight. 2011. UCHIME improves sensitivity and speed of chimera detection. Bioinf. 27 (16):2194–2200. doi:10.1093/bioinformatics/btr381.
- El-Mashad, H.M., G. Zeeman, W.K.P. Van Loon, G.P.A. Bot, and G. Lettinga. 2003. Effect of temperature and temperature fluctuation on thermophilic anaerobic digestion of cattle manure. 95 (2):191–201.
- Epstein, E., N.C. Wu, C. Youngberg, and G. Croteau. 2001. Dust and bioaerosols at a biosolids composting facility. Compost Sci. & Utilisation. 9 (3):250–255. doi:10.1080/1065657X.2001.10702042.
- Floudas, D., [xxx et al.]. 2012. The paleozoic origin of enzymatic lignin decomposition reconstructed from 31 Fungal Genomes. Sci. 336:1715. doi:10.1126/science.1221748.
- Fuchs, J.G., and B. Bieri. 2000. New biotests to measure the biological qualities of composts. Agrarforschung. 7:314–319.
- Fung, F., and R.F. Clark. 2004. Health effects of mycotoxins: A toxicological overview. J. Toxicol. Clin. Toxicol. 42 (2):217–234. doi:10.1081/CLT-120030947.
- Geiser, D.M., C. Gueidan, J. Miadlikowska, F. Lutzoni, F. Kauff, V. Hofstetter, E. Fraker, C.L. Schoch, L. Tibell, W.A. Untereiner, and A. Aptroot. 2006. Eurotiomycetes: Eurotiomycetidae and Chaetothyriomycetidae. Mycologia. 98 (Iss):6. doi:10.1080/15572536.2006.11832633.
- Greenberger, P.A. 2002 November. Allergic bronchopulmonary aspergillosis. J. of Allergy and Clin. Immunol. 110 (5):685–692. doi:10.1067/mai.2002.130179.
- Haitjema, C. H., K.V. Solomon, J.K. Henske, M.K. Theodorou, and M.A. O’Malley. 2014. Anaerobic gut fungi: Advances in isolation, culture, and cellulolytic enzyme discovery for biofuel production. Biotechnol. and Bioeng. 111:1471–1482. doi:10.1002/bit.25264.
- Hansgate, A.M., P.D. Schloss, A.G. Hay, and L.P. Walker. 2005. Molecular characterization of fungal community dynamics in the initial stages of composting. FEMS Microbiol. Ecol. 51:209–214. doi:10.1016/j.femsec.2004.08.009.
- Haugland, R.A., M. Varma, L.J. Wymer, and S.J. Vesper. 2004. Quantitative PCR analyses of selected Aspergillus, Penicillium and Paecilomyces species. Syst. Appl. Microbiol. 27 (2):198–210. doi:10.1078/072320204322881826.
- Hibbett, D.S., and P.B. Matheny. 2009. The relative ages of ectomycorrhizal mushrooms and their plant hosts estimated using Bayesian relaxed molecular clock analyses. BMC Biol. 7:13. doi:10.1186/1741-7007-7-13.
- Hoorman, J.J. 2011. The role of soil fungus. Fact sheet. Agricultural and Natural Resources. SAG-14-11. Columbus, OH: Ohio State University.
- Hoornweg, D., and P. Bhada-Tata. 2012. What a waste: A global review of solid waste management. Urban Development Series; Knowledge Papers no. 15. Washington, DC: World Bank. https://openknowledge.worldbank.org/handle/10986/17388 (accessed November 14, 2017).
- Ishii, K., M. Fukui, and S. Takii. 2000. Microbial succession during a composting process as evaluated by denaturing gradient gel electrophoresis analysis. J. Appl. Microbiol. 89:768–777. doi:10.1046/j.1365-2672.2000.01177.x.
- Karakurt, I., G. Aydin, and K. Aydiner. February 2011. Mine ventilation air as a sustainable energy source. Renewable Sustainable Energy Rev. 15 (2):1042–1049. doi: 10.1016/j.rser.2010.11.030.
- Kazda, M., S. Langer, and F.R. Bengelsdorf. 2014. Fungi open new possibilities for anaerobic fermentation of organic residues. Energy, Sustainability and Soc. 4:6. doi:10.1186/2192-0567-4-6.
- Langarica-Fuentes, A., U. Zafar, A. Heyworth, T. Brown, G. Fox, and D.G. Robson. 2014. Fungal succession in an in-vessel composting system characterized using 454 pyrosequencing. FEMS Microbiol. Ecol. 88:296–308. doi:10.1111/1574-6941,12293.
- Latgé, J.P. 1999. Aspergillus fumigatus and Aspergillosis. Clin.Microbiol. Rev. 12 (2):310–350.
- Le Goff, O., V. Bru-Adan, H. Bacheley, J.J. Godon, and N. Wéry. 2010. The microbial signature of aerosols produced during the thermophilic phase of composting. J. Appl. Microbiol. 108:325–340. doi:10.1111/j.1365-2672.
- Lee, S.Y., and G.D. Holder. June 2001. Methane hydrates potential as a future energy source. Fuel Process. Technol. 71 (1–3):181–186. doi: 10.1016/S0378-3820(01)00145-X.
- Lim, S.L., L.H. Lee, and T.Y. Wu. 2016 January16.Sustainability of using composting and vermicomposting technologies for organic solid waste biotransformation: recent overview, greenhouse gases, emissions and economic analysis. J. Cleaner Prod. 111 (Part A):262–278. doi:10.1016/j.jclepro.2015.08.083.
- Macias-Corral, M., Z. Samani, A. Hanson, G. Smith, P. Funk, H. Yu, and J. Longworth. 2008. Anaerobic digestion of municipal solid waste and agricultural waste and the effect of co-digestion with dairy cow manure. Bioresour. Technol. 99 (17):8288–8293. doi:10.1016/j.biortech.2008.03.057.
- Mahajan, J., and J.A. Vakhariya. 2016. Waste management: A reverse supply chain perspective. Vikalpa 41 (3):197–208. doi:10.1177/0256090916659029.
- Mata-Alvarez, J. 2003. Biomethanization of the organic fraction of municipal solid waste. London, UK: IWA publishing.
- Matsuzawa, T., R. Tanka, Y. Horie, T. Gonoi, and T. Yaguchi. 2010. Development of rapid and specific molecular discrimination methods for pathogenic Emericella species. Jap. J. of Med. Mycol. 51:109–116. doi:10.3314/jjmm.51.109.
- Mbareche, H., M. Veillette, L. Bonifait, M.E. Dubuis, Y. Bernard, G. Marchand, G.J. Bilodeau, and C. Duchaine. 2017. A next generation sequencing approach with a suitable bioinformatics workflow to study fungal diversity in bioaerosols released from two different types of compost plants. Sci. Total Environ. 601–602:1306–1314. doi:10.1016/j.scitotenv.2017.05.235.
- Mistry, J., R.D. Finn, S.R. Eddy, A. Bateman, and M. Punta. 2013. Challenges in homology search: HMMER3 and convergent evolution of coiled-coil regions. Nucleic Acids Res. 41:e121. doi:10.1093/nar/gkt263.
- Morgenstern, I., S. Klopman, and D.S. Hibbett. 2008. Molecular evolution and diversity of lignin degrading heme peroxidases in the Agaricomycetes. J. of Mol. Evol. 66:243. doi:10.1007/s00239-008-9079-3.
- Murto, M., L. Björnsson, and B. Mattiasson. 2004. Impact of food industrial waste on anaerobic co-digestion of sewage sludge and pig manure. J. Environ. Manage. 70 (2):101–107.
- Nucci, M., and E. Anaissie. 2007. Fusarium infections in immunocomprised patients. Clin. Microbiol. Rev. 20(4):695–704. doi:10.1128/CMR.00014-07.
- Persoons, R., S. Parat, M. Stoklov, A. Perdrix, and A. Maitre. 2010. Critical working tasks and determinants of exposure to bioaerosols and MVOC at composting facilities. Int. J. of Hyg. and Environ. Health. 213 (2010):247–338. doi:10.1016/j.ijheh.2010.06.001.
- Pieckova, E., and K. Wilkins. 2004. Airway toxicity of house dust and its fungal composition. Ann. of Agric. and Environ. v 11:67–73.
- Pitt, J.I., and A.D. Hocking. 2009. The ecology of fungal food spoilage. In Fungi and food spoilage, ed. Boston, MA: Springer Science.
- Rodriguez, Z. C., and M.G. Ramos. 2014. Acremonium species associated fungemia: A novel pathogen in the immunosuppressed patient. Boletín de la Asociación Médica de Puerto Rico 106 (3):29–31.
- Ryckeboer, J., J. Mergaert, K. Vaes, S. Klammer, D. De Clercq, J. Coosemans, et al.2003. A survey of bacteria and fungi occurring during composting and self-heating processes. Ann. of Microbiol. 53:349–410.
- Sánchez-Monedero, M. A., E.I. Stentiford, and S.T. Urpilainen. 2005. Bioaerosol generation at large-scale green waste composting plants. J. Air & Waste Manage. Assoc. 55 (5):612–618. doi:10.1080/10473289.2005.10464652.
- Schloss, P. D. et al. 2009. Introducing mother: Open-source, platform-independent, communitt-supported software for describing and comparing microbial communities. Appl. Environ. Microbiol. 75 (23):7537–7541. doi:10.1128/AEM.01541-09.
- Selman, M., Y. Lacasse, A. Pardo, and Y. Cormier. 2010. Hypersensitivity pneumonitis caused by fungi. Proc. of the Am. Thoracic. Soc. 7:229–236. doi:10.1513/pats.200906-041AL.
- Sosnowski, P., A. Wieczorek, and S. Ledakowicz. 2003. Anaerobic co-digestion of sewage sludge and organic fraction of municipal solid wastes. Adv. Environ. Res. 7(3):609–616. doi:10.1016/S1093-0191(02)00049-7.
- Swan, J.R. M., A. Kelsey, and B. Crook. 2003. Occupational and environmental exposure to bioaerosols from composts and potential health effects—A critical review of published data. Research Report 130. Health & Safety Executive, The Composting Association.
- Sykes, P., K. Jones, and J.D. Wildsmith. 2007. Managing the potential public health risks from bioaerosol liberation at commercial composting sites in the UK: An analysis of the evidence base. Resour., Conserv. and Recycl. 52:410. doi:10.1016/j.resconrec.2007.05.005.
- Taha, P.M.P., S.J.T. Pollard, U. Sarkar, and P. Longhurst. 2005. Estimating fugitive bioaerosol releases from static compost windrows: Feasibility of a portable wind tunnel approach. Waste Manage. 25:445–450. doi:10.1016/j.wasman.2005.02.013.
- Tedersoo, L., S. Anslan, M. Bahram, S. Põlme, T. Riit, I. Liiv, U. Kõljalg, V. Kisand, R.H. Nilsson, F. Hildebrand, P. Bork, and K. Abarenkov. 2015. Shotgun metagenomes and multiple primer pair barcode combinations of amplicons reveal biases in metabarcoding analyses of fungi. MycoKeys 10:4852. doi:10.3897/mycokeys.10.4852.
- United Nations Department of Social and Economic Development. n.d. Sustainable Development Knowledge Platform Goal 11: Make cities and human settlements inclusive, safe, resilient and sustainable. https://sustainabledevelopment.un.org/sdg11( accessed August 1, 2017).
- Velegraki, A., C. Cafarchia, G. Gaitanis, R. Iatta, and T. Boekhou. 2015. Malassezia infections in humans and animals: Pathophysiology, detection, and treatment. PLoS Pathog. 11 (1):e1004523. doi:10.1371/journal.ppat.1004523.
- Viegas, C., T. Faria, M. Dos Santos, E. Carolino, Q.A. Gomes, R. Sabino, and S. Viegas. 2015. Fungal burden in waste industry: An occupational risk to be solved. Environ. Monit. Assess. 187:199. doi:10.1007/s10661-015-4412-y.
- Wéry, N. 2014. Bioaerosols from composting facilities—A review. Front. Cell. Infect. Microbiol. 4:42. doi:10.3389/fcimb.2014.00042.
- Wyngaarden, J.B., L.H. Smith, and J.C. Bennett, eds. 1992. Cecil textbook of medicine, 19th ed., 399 and 407. Philadelphia, PA: W.B. Saunders.