
 ?Mathematical formulae have been encoded as MathML and are displayed in this HTML version using MathJax in order to improve their display. Uncheck the box to turn MathJax off. This feature requires Javascript. Click on a formula to zoom.
ABSTRACT
In many regions of the world, the relationship between ambient temperature and mortality is well-documented, but little is known about Cyprus, a Mediterranean island country where climate change is progressing faster than the global average. We Examined the association between daily ambient temperature and all-cause mortality risk in Cyprus. We conducted a time-series analysis with quasipoisson distribution and distributed lag non-linear models to investigate the association between temperature and all-cause mortality from 1 January 2004 to 31 December 2019 in five districts in Cyprus. We then performed a meta-analysis to estimate the overall temperature-mortality dose-response relationship in Cyprus. Excess mortality was computed to determine the public health burden caused by extreme temperatures. We did not find evidence of heterogeneity between the five districts (p = 0.47). The pooled results show that for cold effects, comparing the 1st, 2.5th, and 5th percentiles to the optimal temperature (temperature associated with least mortality, 25 ℃), the overall relative risks of mortality were 1.55 (95% CI: 1.32, 1.82), 1.41 (95% CI: 1.21, 1.64), and 1.32 (95% CI: 1.15, 1.52), respectively. For heat effects, the overall relative risks of mortality at the 95th, 97.5th and 99th percentiles were 1.10 (95% CI: 1.04, 1.16), 1.17 (95% CI: 1.07, 1.29), and 1.29 (95% CI: 1.11, 1.5), respectively. The excess mortality attributable to cold days accounted for 8.0 deaths (95% empirical CI: 4.5–10.8) for every 100 deaths, while the excess mortality attributable to heat days accounted for 1.3 deaths (95% empirical CI: 0.7–1.7) for every 100 deaths. The results prompt additional research into environmental risk prevention in this under-studied hot and dry region that could experience disproportionate climate change related exposures.
Implications: The quantification of excess mortality attributable to temperature extremes shows an urgent need for targeted public health interventions and climate adaptation strategies in Cyprus and similar regions facing rapid climate change. Future steps should look into subpopulation sensitivity, coping strategies, and adaptive interventions to reduce potential future risks.
Introduction
The association between temperature and mortality risk is well-described. Studies conducted in different geographical places have shown that both low and high temperatures are associated with increased mortality risks (Basu Citation2009; Basu and Samet Citation2002; Curriero et al. Citation2002; Guo et al. Citation2014; Ma et al. Citation2015; Zanobetti and Schwartz Citation2008). Nevertheless, associations between ambient temperature and mortality observed in regions, such as western Europe, the United States, and parts of Asia, cannot be extrapolated directly to the whole world. A systematic analysis of worldwide variations in the influence of ambient temperature on mortality indicates that the relative mortality risk associated with extreme low and high temperatures differs by country and community with Taiwanese, Italian, and Spanish residents showing higher sensitivity to both cold and hot temperatures than residents of other regions in general (Guo et al. Citation2014). The latency and duration of the cold and heat effects also differed by area; for instance, the lag of the cold effect was greater in Taiwan, Italy, Spain, and to a lesser degree the United Kingdom, however, in Italy and Spain, the duration of heat effects persisted longer (Guo et al. Citation2014). These differences in temperature associations with mortality may be due to variability in coping capacity, heat sensitivity, adaptation strategies across diverse demographics, and geographical climate, thus making the case for local environmental epidemiology, especially in under-studied regions (Lubczyńska, Christophi, and Lelieveld Citation2015; McMichael, Woodruff, and Hales Citation2006).
Some locations warm faster than the global average as a result of climate feedback processes that are geographically distinct. According to the Sixth Assessment Report of the Intergovernmental Panel on Climate Change (IPCC-AR6), the Mediterranean area is experiencing considerable warming compared to the pre-industrial period (IPCC Citation2022). Studies focusing on the Eastern Mediterranean region suggest a steady, progressive, and relatively substantial warming of 3.5 to 7°C in the region comparing the 1961–1990 reference period to the period 2070–2099 (Lelieveld et al. Citation2012). This is significantly above the global average. Additionally, hot summer conditions that occurred infrequently during the reference period may become the norm by the middle and end of the 21st century (Lelieveld et al. Citation2012; Zittis et al. Citation2022).
The majority of previous temperature-related health research were conducted in countries with significantly cooler temperatures than the Eastern Mediterranean region, although it has been shown that warmer regions are disproportionately vulnerable to extreme temperatures (Alahmad et al. Citation2020). Although there have been few studies undertaken in places adjacent to the Eastern Mediterranean region (El-Zein, Tewtel-Salem, and Nehme Citation2004; Lubczyńska, Christophi, and Lelieveld Citation2015; McMichael et al. Citation2008; Nastos and Matzarakis Citation2012), their findings may not be extrapolated directly to Eastern Mediterranean countries. In view of these alarming projections, it is imperative to obtain a comprehensive knowledge of the burden and association between temperature and mortality in this region. Therefore, in this paper we aim to evaluate the association between ambient temperature and daily mortality and calculated excess mortality in Cyprus, an island located in the Eastern Mediterranean region.
Materials and methods
Geography and climate
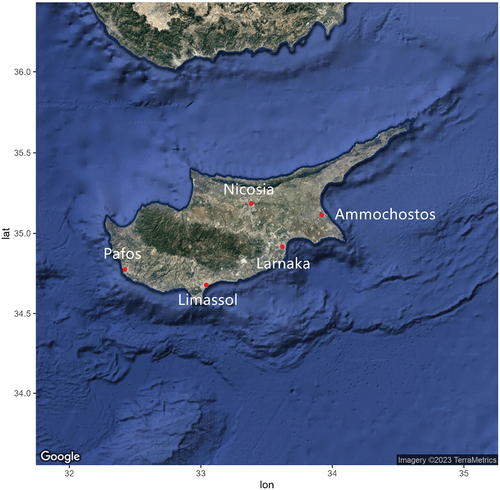
Cyprus is the third largest and third most populous island in the Mediterranean area (population: 918,000, 2021 Census) situated at around 35° north latitude and 33° east longitude (), and it includes five Cyprus Government controlled districts. Its capital, and most populous city, is Nicosia (38% population), followed by Limassol (28%), Larnaka (17%), Pafos (11%), and Ammochostos (6%) (Cyprus Citation2021). The climate of Cyprus is typical of the predominantly subtropical climate of the Mediterranean region, with hot, dry summers, wet, variable winters, and short autumn and spring seasons (Zittis et al. Citation2022).
Figure 1. Cyprus map showing the locations of the studied districts (Nicosia, Limassol, Larnaka, Pafos, and Ammochostos).
Mortality data
Daily mortality data from each district was obtained from the Health Monitoring Unit of the Ministry of Health in Cyprus. The mortality data included the date of death, gender, age, and cause of death from 1 January 2004 to 31 December 2019. We used all-cause non-accidental mortality (ICD-10: A00 to R99).
Meteorological and air pollution data
For the same study period, daily mean temperature and relative humidity were collected from the Cyprus Department of Meteorology (http://www.moa.gov.cy/moa/dm/dm.nsf/home_en/home_en?openform). Concentrations of air pollutants were acquired from the air quality traffic stations in each district from the Air Quality and Strategic Planning Section, Department of Labour Inspection, Ministry of Labour and Social Insurance in Cyprus (https://www.airquality.dli.mlsi.gov.cy/). Particulate matter ≤10 µm in diameter (PM10, µg/m3) were provided from daily gravimetric concentrations. Mean daily average concentrations of ozone (O3, μg/m3) were calculated from hourly measurements. Exposure data was available from 1 January 2004 to 31 December 2019, with the exception of O3, for which data was available from 1 January 2010 to 31 December 2019.
The data completeness in Nicosia, Limassol, Larnaka, and Pafos was generally acceptable, with temperature completeness ranging between 92% and 100%, relative humidity completeness spanning from 91% to 100%, PM10 completeness ranging between 89% and 92%, and ozone completeness extending from 61% to 62% because we only have data on ozone from 2010 to 2019, with each city’s completeness each year above 95% In Ammochostos, however, PM10 data was only 57% complete, while ozone data was just 19% complete, with data only from 2017 to 2019.
Statistical analysis
We analyzed the relationship between daily ambient temperature and daily all-cause non-accidental mortality throughout a 16-year period that spanned all four seasons, taking into consideration both hot and cold temperatures. Mortality risk estimates were derived relative to the optimum or minimum mortality temperature (MMT). In order to produce more conservative relative risks (RR) results, the 1st, 2.5th, and 5th percentile of temperatures within each temperature range were rounded up to the lowest integer number, while the 95th, 97.5th, and 99th percentile of temperatures were rounded down to the largest integer value.
Distributed lag non-linear models (DLNM) were used to estimate the non-linear and up to 14-day delayed effects of temperature on mortality for each district (Alahmad et al. Citation2019; Gasparrini, Armstrong, and Kenward Citation2010); these models use cross-basis functions to describe this relationship along the dimensions of temperature and lag time simultaneously while permitting independent selection of the two dimensions to allow for a more flexible fit. The choice of lag was based on recent temperature mortality studies (Alahmad et al. Citation2023). To account for overdispersion in the mortality counts, the relationship was modeled using quasipoisson regression. We selected the optimal model that provided the best fit for the temperature, by comparing linear, linear splines, polynomials of degrees 2, 3, 4, and cubic natural splines of 3–7 degrees of freedom (df) and several choices of knots. Using this approach, the temperature was represented using a polynomial with three knots placed at the 10th, 75th, and 90th percentiles, while the lag were modeled using a cubic natural spline with three df placed equally in the log scale (Gasparrini et al. Citation2015). The models captured seasonal and sub-seasonal changes in mortality by using a natural spline function with 4 df per year and a categorical variable for day of the week. In addition, whenever available, we adjusted for relative humidity, and PM10 in our models as potential confounders. These two environmental variables were modeled with using linear terms.
For all parameters and statistical choices, the best fit was determined using a Quasi extension of the Akaike’s Information Criterion (QAIC):
Where represents the log-likelihood of the fitted model;
is the fitted model’s parameters;
represents the estimated overdispersion parameter;
indicates the total number of parameters.
The final model can be summarized as:
Where is the estimated number of deaths on day
;
is the intercept;
are regression coefficients;
is the DLNM temperature and lag (
days) cross-basis matrix;
is the natural cubic spline function for the day of study from 1 January 2004 to 31 December 2019; Day of week is an indicator variable.
In addition, we examined the impacts of ozone as a covariate in our model as part of our sensitivity analysis. Restricting the time period from 2010 to 2019 owing to the availability of ozone data, we compared the models with and without ozone.
Then we performed a fixed-effects (intercepts only) meta-analysis to summarize the overall effect of daily mean temperature on daily mortality in Cyprus, using data from the five main urban districts. Multivariate Cochran Q-test and statistic were used to measure the degree of heterogeneity across studies and evaluate its effect on the meta-analysis (Higgins et al. Citation2003).
Excess mortality was determined by using the approach for calculating attributable risk from DLNMs (Gasparrini and Leone Citation2014). The attributable risk is the percentage of cases or deaths that were summed across cold or hot days based on the RR for any given day compared to the day of optimal temperature, or the MMT (Gasparrini and Leone Citation2014; Steenland and Armstrong Citation2006). Uncertainty around excess mortality was computed as empirical CIs (eCI) using Monte Carlo simulations assuming a multivariate normal distribution of the best linear unbiased prediction of reduced coefficients (Alahmad et al. Citation2023).
All analyses were conducted using R statistical software version 4.2.1 (R Foundation for Statistical Computing, Vienna, Austria), the dlnm package version 2.3.7 (Gasparrini, Armstrong, and Kenward Citation2010) and mixmeta package (Sera et al. Citation2019)).
Results
Summary statistics
This study evaluated 79,882 all non-accidental cause deaths in Cyprus between 1 January 2004 and 31 December 2019 (). The average number of all-cause deaths per day was highest in Nicosia (5.3 ± 2.47) and lowest in Ammochostos (0.65 ± 0.83), which corresponded to the population sizes of the districts. The five districts’ annual average temperatures are quite similar, (~ 20 ℃). In the summer, the average daily temperature may reach as high as 37.5°C, while in the winter it can drop to as low as 3.2°C. The annual relative humidity was also comparable in all five districts (~65%). PM10 concentrations were higher in Nicosia, Limassol, and Larnaka, with respective values of 47.67 (±35.76) µg/m3, 45.48 (±37.46) µg/m3, and 47.37 (±51.44) µg/m3, but lower in Pafos and Ammochostos, with values of 37.41 (±36.79) µg/m3 and 38.84 (±43.91) µg/m3. On the contrary, ozone concentrations were lower in Nicosia, Limassol, and Larnaka, with respective values of 54.71 (±22.08) μg/m3, 48.67 (±14.31) μg/m3, and 57.96 (±16.6) μg/m3, but higher in Pafos and Ammochostos, with values of 70.86 (±16.88) μg/m3, and 68.91 (±15.72) μg/m3. Ozone concentrations had less variability compared to PM10 levels.
Table 1. Descriptive statistics of daily mortality, meteorological and air pollution data for the period from 1 January 2004 to 31 December 2019 in Cyprus.
Temperature effects
The cumulative association plots in show the exposure-response across all 14 days of lag, centered by the MMT. In general, these graphs exhibit a U-shaped dose-response curve with rising RR at both ends. Mortality is often elevated at very low temperatures, decreases at optimal temperatures (around the MMT), and then starts to increase again at excessively high temperatures. The MMT for Nicosia, Limassol, Larnaka, Pafos, and Ammochostos are 28°C, 24°C, 23°C, 25°C, and 21°C, respectively, with corresponding percentiles of 78th, 61st, 61st, 77th, and 54th. The dose-response relationship curves for all five districts have the same shape, but with somewhat varied MMT and RRs for extreme temperatures. Nicosia, for example, has higher MMT than Larnaka and higher cold effects RRs than Limassol. We also compared the models with and without ozone, because the results were comparable with all differences within ± 2%, we did not further include ozone as a covariate to make fullest use of data from 16 years and make our models parsimonious.
Figure 2. Relative risk of temperature on mortality over a cumulative 14-day lag across Cyprus adjusting for time trend, seasonality, relative humidity, PM10, and day of the week (the shaded regions represent 95% CI).
The effects of the 1st, 2.5th, 5th, 95th, 97.5th, and 99th percentiles of temperature on mortality risk are shown in . Exposure to extreme temperature (i.e., 1st, 99th temperature percentiles) increased the risk of dying from any cause. The overall RRs comparing the 1st percentile to the optimal temperature were statistically significant in Nicosia, Limassol and Larnaka, with respective values of 1.55 (95% CI: 1.19, 2.01), 1.55 (95% CI: 1.21, 2.01) and 1.46 (95% CI: 1.04, 2.05). The insignificant RRs in Pafos and Ammochostos may be attributable to relatively smaller sample sizes. The RRs comparing the 99th percentile to the optimal temperature were statistically significant in Nicosia and Larnaka, with values of 1.37 (95% CI: 1.21, 1.55) and 1.33 (95% CI: 1.11, 1.59). Additionally, less extreme percentiles also demonstrate significant, albeit lower, effects as depicted in .
Table 2. Overall relative risks for a cumulative distributive lag of 14 days for different heat and cold effects definitions in five districts of Cyprus, adjusting for time trend, seasonality, relative humidity, PM10, and day of the week (statistically significant results are marked with asterisks).
Meta-analysis pooled estimates
The meta-analysis had a very low degree of heterogeneity, indicating small differences in the effect estimates across the districts. The multivariate Cochran Q-test for heterogeneity had a p-value = 0.4706, while the I-square statistic was 0.0%. The pooled results of this meta-analysis thus can adequately capture the overall association between temperature and mortality in Cyprus.
The pooled temperature-mortality figure () illustrates the estimated effect during a 14-day lag using data from five districts in Cyprus. The overall MMT in Cyprus is 25°C, at the 70th percentile. The pooled relationship was also U-shaped, with cold effects (blue line) more pronounced at extremely low temperatures and decreasing near optimal temperature, and heat effects (red line) beginning to increase beyond optimal temperature, with the largest RR occurring at the highest temperature.
Figure 3. Meta-analysis pooled estimated effects of temperature on mortality over a 14-day lag for Cyprus (the shaded regions represent 95% CI, and the blue and red lines show cold and heat effects, respectively). The dashed lines represent the 99th and 1st percentiles. The dotted line represents the estimated minimum mortality temperature for the pooled relationship.
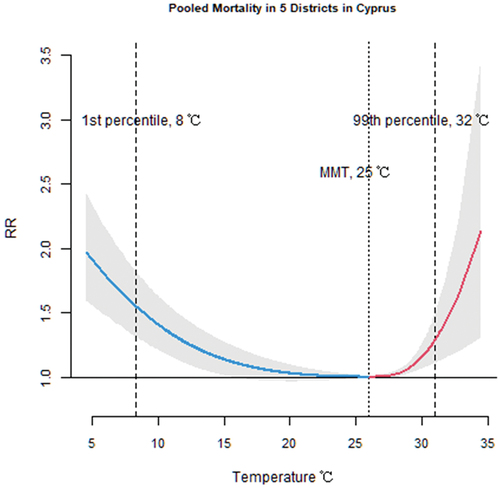
The pooled effects of the 1st, 2.5th, 5th, 95th, 97.5th, and 99th percentiles of temperature on mortality risk are shown in . The overall relative mortality risks attributed to cold effects comparing the 1st, 2.5th, and 5th percentiles to the optimal temperature in Cyprus were 1.55 (95% CI: 1.32, 1.82), 1.41 (95% CI: 1.21, 1.64), and 1.32 (95% CI: 1.15, 1.52), whereas the relative risks attributed to heat effects comparing the 95th, 97.5th, and 99th percentiles to the optimal temperature were 1.10 (95% CI: 1.04, 1.16), 1.17 (95% CI: 1.07, 1.29), and 1.29 (95% CI: 1.11, 1.5), respectively ().
Excess mortality
shows the excess mortality attributed to heat and cold effects. The excess mortality attributable to cold effects (all temperatures below the MMT) accounted for 6,274 (95% eCI: 3,528; 8,505) deaths throughout the 16-year research period (79,882 total deaths), while the excess mortality attributable to heat effects (all temperatures below the MMT) accounted for 999 (95% eCI: 547; 1,367) deaths in total. The temperature-related (both cold and heat effects) excess mortality was 9.3%. Cold mortality were larger than the heat mortality, accounting for 8.0 (95% eCI: 4.5, 10.8) per 100 deaths versus 1.3 (95% eCI: 0.7, 1.7) per 100 deaths, respectively. This was because the MMT was closer to the high temperature percentiles as can be seen in , resulting in a greater number of days with temperatures below the MMT.
Table 3. Excess mortality attributed to heat and cold effects in Cyprus.
Discussion
In this study, we applied state-of-the-art statistical modeling to estimate number of deaths attributed to cold and heat in an understudied region. Our analysis examined five different districts to estimate the potential public health burden of climate in Cyprus. We have found that the overall dose-response relationship temperature and mortality exhibits a U-shaped curve, meaning that both extreme low and high temperatures may increase the risk of mortality, with little heterogeneity across the five districts.
Previous research analyzed the heat-related mortality in Cyprus over the warm months of 2004–2009 and reported 32 deaths per year (Heaviside et al. Citation2016), while we found a 64 (95% eCI: 32, 93) heat-related excess mortality per year. This discrepancy may be due to our models accounting for lagged dependencies and extended research years. Another study looked into the effect of temperature on mortality in Cyprus. They observed a V-shaped association between temperature and mortality, with a high-temperature threshold of 33.7°C, over which mortality risk increased sharply (Tsangari et al. Citation2016). The threshold was far higher than ours, as the MMT we estimated for each of the five districts individually and for the whole region was about 25°C. In addition, a study in Cyprus found an association between high temperatures and cardiovascular mortality for cerebrovascular diseases, ischemic heart disease, and other heart diseases (Lubczyńska, Christophi, and Lelieveld Citation2015), which can also be used as a reference for interpreting our results, despite the fact that the study only focused on high temperatures and their dependent variable was a subset of the outcome we used.
The findings of our study were in line with the other studies conducted in somewhat similar regions. In a research conducted in Athens, Greece, a significant association between temperature and total daily mortality was found, with both cold and hot temperatures being significant risk factors for daily natural-cause mortality (Lubczyńska, Christophi, and Lelieveld Citation2015; Nastos and Matzarakis Citation2012). This association has also been identified in the Greater Beirut region (El-Zein, Tewtel-Salem, and Nehme Citation2004). And in a global assessment of temperature and urban mortality, death rates from all causes increased with rising heat in the northern Mediterranean region (McMichael et al. Citation2008).
In Southeast Asia, Southern Europe, and Central America, the average percentage of temperature-related excess mortality was between 3 and 13% (Alahmad et al. Citation2020; Gasparrini et al. Citation2017), which is comparable to our result of 9.3% in total. Additionally, in our study, we found that the excess mortality attributed to cold effects was higher than that attributable to heat effects. This is a common finding in temperature-mortality studies as there are more cold days than hot days when defined by the MMT. The high MMT may be partially explained by adaptation measures, such as the widespread use of domestic air-conditioning systems. For example, around 80% of residences in Cyprus are equipped with at least one air-conditioning unit (Lubczyńska, Christophi, and Lelieveld Citation2015; Zachariadis and Hadjinicolaou Citation2014). As in similar other warm cities, most residences in Cyprus are designed to be cool rather than warm and hence unequipped for insulation and heating during extreme cold days.
Compared to the Mediterranean countries of Italy and Spain, the cold effects were slightly higher in Cyprus, although this difference was not statistically significant due to the relatively wide confidence intervals, meanwhile, Cyprus did not show a significant difference with Italy and Spain when it comes to heat effects (Guo et al. Citation2014). However, in comparison to other developed countries, such as Australia, the United Kingdom, the United States, Canada, and Japan, both the cold and heat effects in Cyprus were smaller (Guo et al. Citation2014). Differential effects of temperatures on mortality may be impacted by behavioral, technological, socioeconomic, and infrastructural factors, including but not limited to the protective impact of heating and air conditioning on cold- and heat-related deaths.
In other larger countries, such as the United States and China, the within country heterogeneity was much higher (Curriero et al. Citation2002; Ma et al. Citation2015). In the United States, for instance, there was a strong effect modification between the temperature-mortality and latitude, with colder temperatures having a greater effect on mortality risk in southern cities and warmer temperatures having a greater effect on mortality risk in northern cities (Curriero et al. Citation2002). Furthermore, the percentage of households with air conditioners in the south and heaters in the north, which serve as indicators of the adaptive status of the city’s population, also predicted weather-related mortality (Curriero et al. Citation2002). Studies done in other places also indicate temperature-mortality relationship varies greatly by geographic location, climate pattern and socioeconomic status (Analitis et al. Citation2008; Anderson and Bell Citation2009; Curriero et al. Citation2002). However, in our meta-analysis, we discovered that the heterogeneity of the temperature-mortality association in Cyprus’s five districts was almost negligible. This may be attributed to the fact that Cyprus is a relatively small country with a very small variation in its climatic and demographic distributions.
There are several strengths in this research. To begin, this study examines the association between temperature and mortality, both nationwide and by district, using a 16-year long-term time series data. To the best of our knowledge, this is the first research to investigate the dose-response relationship and its non-linear lagged dependencies between temperature and all-cause mortality risks in Cyprus. Other studies have focused on heat-related mortality (Heaviside et al. Citation2016; Kouis et al. Citation2016), hospital admissions (Pantavou et al. Citation2021) and cardiovascular mortality risks in Cyprus (Lubczyńska, Christophi, and Lelieveld Citation2015). Thus, our research examined both the cold and hot effects of temperature using the largest mortality dataset in Cyprus, giving us a fuller picture of the potential public health burdens of future climate change in the country. Also, employing all-cause mortality helps circumvent the issue of underestimation of physiological deterioration of medical conditions that lead to death from direct temperature exposure such as heat stroke or hypothermia (Alahmad et al. Citation2019; Gasparrini et al. Citation2015; Shen et al. Citation1998; Zanobetti and Schwartz Citation2008). Finally, we also took air quality into consideration to avoid the potential confounding effects of these factors.
This study has several limitations as well. First, we took the average of the daily maximum and minimum temperatures to represent the daily mean ambient temperature. The accuracy of this estimate may be affected by the length of daily sunshine and other factors. However, given that we are using a daily time series data we do not expect to have a high effect on the results. Also, we used the outdoor measured ambient temperature as a proxy for personal exposure, which may have resulted in a non-differential bias toward the null. However, despite this conservative estimate, we still detected a statistically significant association between extreme temperatures and mortality. Second, it is believed that PM2.5 is a more precise predictor of adverse health effects than PM10 (Alahmad et al. Citation2019; Bhaskaran et al. Citation2009). But because of the large number of missing PM2.5 data, it was difficult to adjust for PM2.5, thus we only used PM10, therefore we cannot rule out residual confounding by particulate matter.
Conclusion
Climate change is accelerating more rapidly in the Eastern Mediterranean region as compared to the rest of the world. The significant associations between ambient temperatures and daily all-cause mortality in Cyprus suggests that inherently hot regions may be become too vulnerable to climate change related exposures. This vulnerability is particularly concerning when considering the escalation of hot days in intensity and frequency, a trend that climate models predict will continue.
The disproportionate impact of climate change on similar regions necessitates a multifaceted research agenda focused on understanding heat sensitivity among the population. Although we did not find evidence of heterogeneity in the temperature-mortality relationship between districts in Cyprus, this should not deter researchers from pursuing demographic and small-area health vulnerabilities. For instance, understanding how local populations currently adapt to extreme temperatures, whether through traditional practices, community support systems, or infrastructure adaptations, can provide a foundation for developingmore effective strategies.
We call for a collaborative effort across disciplines, including climatology, public health, urban planning, and social sciences, to develop holistic and sustainable adaptation strategies in the Eastern Mediterranean that can protect vulnerable populations from climate change.
Data sharing
Data not available due to ethical and legal restrictions. Due to the health nature of the research supporting data of mortality cannot be made available by the Ministry of Health of Cyprus.
Supplemental Material
Download MS Word (910.3 KB)Acknowledgment
The study was supported by the Cyprus Harvard Internship Program in Environmental Health and the Harvard Cyprus Endowment Fund on Environmental and Public Health. The data used in this study was collected by the Health Monitoring Unit of the Ministry of Health of Cyprus. The ideas and opinions expressed herein are those of the author. Endorsement of these ideas and opinions by the Ministry of Health of Cyprus is not intended nor should it be inferred. The authors would also like to thank the Cyprus Department of Meteorology for providing the meteorological data and the Air Quality and Strategic Planning Section, Department of Labour Inspection, Ministry of Labour and Social Insurance in Cyprus for providing the air pollutants data.
Disclosure statement
No potential conflict of interest was reported by the author(s).
Supplementary material
Supplemental data for this article can be accessed online at https://doi.org/10.1080/10962247.2024.2345637.
Additional information
Notes on contributors
Barrak Alahmad
Barrak Alahmad is a Research Fellow at the Exposure, Epidemiology and Risk (EER) program, Environmental Health Department, Harvard T.H. Chan School of Public Health.
Qinni Yuan
Qinni Yuan is a Master of Science Student at the Environmental Health Department, Harvard T.H. Chan School of Public Health.
Souzana Achilleos
Souzana Achilleos is an Assistant Professor in Environmental Health at the Department of Primary Care and Population Health, University of Nicosia Medical School.
Pascale Salameh
Pascale Salameh is a visiting professor at the University of Nicosia Medical School, the Founder and director of INSPECT-LB, and a Full Professor of Epidemiology at the Lebanese University.
Stefania I. Papatheodorou
Stefania I. Papatheodorou is an Adjunct Associate Professor of Epidemiology at the Epidemiology Department, Harvard T.H. Chan School of Public Health
Petros Koutrakis
Petros Koutrakis is a Professor of Environmental Sciences at the Environmental Health Department, Harvard T.H. Chan School of Public Health.
References
- Alahmad, B., H. Khraishah, D. Royé, A.M. Vicedo-Cabrera, Y. Guo, S.I. Papatheodorou, and S. Achilleos, F. Acquaotta, B. Armstrong, M.L. Bell, S.-C. Pan. 2023. Associations between extreme temperatures and cardiovascular cause-specific mortality: Results from 27 countries. Circulation 147 (1):35–46. doi:10.1161/CIRCULATIONAHA.122.061832.
- Alahmad, B., A. Shakarchi, M. Alseaidan, and M. Fox. 2019. The effects of temperature on short-term mortality risk in Kuwait: A time-series analysis. Environ. Res. 171:278–84. doi:10.1016/j.envres.2019.01.029.
- Alahmad, B., A.F. Shakarchi, H. Khraishah, M. Alseaidan, J. Gasana, A. Al-Hemoud, and M.A. Fox. 2020. Extreme temperatures and mortality in Kuwait: Who is vulnerable? Sci. Total Environ 732:139289. doi:10.1016/j.scitotenv.2020.139289.
- Analitis, A., K. Katsouyanni, A. Biggeri, M. Baccini, B. Forsberg, L. Bisanti, and U. Kirchmayer, F. Ballester, E. Cadum, P.G. Goodman, A. Hojs. 2008. Effects of cold weather on mortality: Results from 15 European cities within the PHEWE project. Am. J. Epidemiol. 168 (12):1397–408. doi:10.1093/aje/kwn266.
- Anderson, B.G., and M.L. Bell. 2009. Weather-related mortality: How heat, cold, and heat waves affect mortality in the United States. Epidemiology 20 (2):205. doi:10.1097/EDE.0b013e318190ee08.
- Basu, R. 2009. High ambient temperature and mortality: A review of epidemiologic studies from 2001–2008. Environ. Health 8 (1):1–13. doi:10.1186/1476-069X-8-40.
- Basu, R., and J.M. Samet. 2002. Relation between elevated ambient temperature and mortality: A review of the epidemiologic evidence. Epidemiol. Rev. 24 (2):190–202. doi:10.1093/epirev/mxf007.
- Bhaskaran, K., S. Hajat, A. Haines, E. Herrett, P. Wilkinson, and L. Smeeth. 2009. Effects of air pollution on the incidence of myocardial infarction. Heart 95 (21):1746–59. doi:10.1136/hrt.2009.175018.
- Curriero, F.C., K.S. Heiner, J.M. Samet, S.L. Zeger, L. Strug, and J.A. Patz. 2002. Temperature and mortality in 11 cities of the eastern United States. Am. J. Epidemiol. 155 (1):80–87. doi:10.1093/aje/155.1.80.
- Cyprus, S.S.O. 2021. Census of population and housing 2021, preliminary results. https://www.cystat.gov.cy/en/PressRelease?id=66208
- El-Zein, A., M. Tewtel-Salem, and G. Nehme. 2004. A time-series analysis of mortality and air temperature in Greater Beirut. Sci. Total Environ. 330 (1–3):71–80. doi:10.1016/j.scitotenv.2004.02.027.
- Gasparrini, A., B. Armstrong, and M.G. Kenward. 2010. Distributed lag non‐linear models. Stat. Med. 29 (21):2224–34. doi:10.1002/sim.3940.
- Gasparrini, A., Y. Guo, M. Hashizume, E. Lavigne, A. Zanobetti, J. Schwartz, A. Tobias, S. Tong, J. Rocklöv, and B. Forsberg. 2015. Mortality risk attributable to high and low ambient temperature: A multicountry observational study. Lancet 386 (9991):369–75. doi:10.1016/S0140-6736(14)62114-0.
- Gasparrini, A., Y. Guo, F. Sera, A.M. Vicedo-Cabrera, V. Huber, S. Tong, and P.M. de Sousa Zanotti Stagliorio Coelho, P.H. Nascimento Saldiva, E. Lavigne, P. Matus Correa. 2017. Projections of temperature-related excess mortality under climate change scenarios. Lancet Planet. Health 1 (9):e360–67. doi:10.1016/S2542-5196(17)30156-0.
- Gasparrini, A., and M. Leone. 2014. Attributable risk from distributed lag models. BMC Med. Res. Methodol. 14 (1):1–8. doi:10.1186/1471-2288-14-55.
- Guo, Y., A. Gasparrini, B. Armstrong, S. Li, B. Tawatsupa, A. Tobias, and E. Lavigne, M. de Sousa Zanotti Stagliorio Coelho, M. Leone, X. Pan, S. Tong. 2014. Global variation in the effects of ambient temperature on mortality: A systematic evaluation. Epidemiology 25 (6):781. doi:10.1097/EDE.0000000000000165.
- Heaviside, C., H. Tsangari, A. Paschalidou, S. Vardoulakis, P. Kassomenos, K.E. Georgiou, and E.N. Yamasaki. 2016. Heat-related mortality in Cyprus for current and future climate scenarios. Sci. Total Environ. 569:627–33. doi:10.1016/j.scitotenv.2016.06.138.
- Higgins, J.P., S.G. Thompson, J.J. Deeks, and D.G. Altman. 2003. Measuring inconsistency in meta-analyses. BMJ 327 (7414):557–60. doi:10.1136/bmj.327.7414.557.
- IPCC, A. 2022. IPCC sixth assessment report. https://www.ipcc.ch/assessment-report/ar6/.
- Kouis, P., P.K. Yiallouros, T. Zachariades, and S.I. Papatheodorou. 2016. Heat related mortality in Cyprus under the A1B emissions scenario: Is additional air-conditioning an appropriate mitigation strategy? Paper presented at the 2016 18th Mediterranean Electrotechnical Conference (MELECON). https://ieeexplore.ieee.org/abstract/document/7495467.
- Lelieveld, J., P. Hadjinicolaou, E. Kostopoulou, J. Chenoweth, M. El Maayar, C. Giannakopoulos, and C. Hannides, M.A. Lange, M. Tanarhte, E. Tyrlis. 2012. Climate change and impacts in the Eastern Mediterranean and the Middle East. Clim. Change 114 (3):667–87. doi:10.1007/s10584-012-0418-4.
- Lubczyńska, M.J., C.A. Christophi, and J. Lelieveld. 2015. Heat-related cardiovascular mortality risk in Cyprus: A case-crossover study using a distributed lag non-linear model. Environ. Health 14 (1):1–11. doi:10.1186/s12940-015-0025-8.
- Ma, W., L. Wang, H. Lin, T. Liu, Y. Zhang, S. Rutherford, Y. Luo, W. Zeng, Y. Zhang, and X. Wang. 2015. The temperature–mortality relationship in China: An analysis from 66 Chinese communities. Environ. Res. 137:72–77. doi:10.1016/j.envres.2014.11.016.
- McMichael, A.J., P. Wilkinson, R.S. Kovats, S. Pattenden, S. Hajat, B. Armstrong, N. Vajanapoom, E.M. Niciu, H. Mahomed, and C. Kingkeow. 2008. International study of temperature, heat and urban mortality: The ‘Isothurm’project. Int. J. Epidemiol. 37 (5):1121–31. doi:10.1093/ije/dyn086.
- McMichael, A.J., R.E. Woodruff, and S. Hales. 2006. Climate change and human health: Present and future risks. Lancet 367 (9513):859–69. doi:10.1016/S0140-6736(06)68079-3.
- Nastos, P.T., and A. Matzarakis. 2012. The effect of air temperature and human thermal indices on mortality in Athens, Greece. Theor. Appl. Climatol. 108 (3):591–99. doi:10.1007/s00704-011-0555-0.
- Pantavou, K., G. Giallouros, K. Philippopoulos, D. Piovani, C. Cartalis, S. Bonovas, and G.K. Nikolopoulos. 2021. Thermal conditions and hospital admissions: Analysis of longitudinal data from Cyprus (2009–2018). Int. J. Environ. Res. Public. Health 18 (24):13361. doi:10.3390/ijerph182413361.
- Sera, F., B. Armstrong, M. Blangiardo, and A. Gasparrini. 2019. An extended mixed‐effects framework for meta‐analysis. Stat. Med. 38 (29):5429–44. doi:10.1002/sim.8362.
- Shen, T., H.L. Howe, C. Alo, and R.L. Moolenaar. 1998. Toward a broader definition of heat-related death: Comparison of mortality estimates from medical examiners’ classification with those from total death differentials during the July 1995 heat wave in Chicago, Illinois. Am. J. Forensic Med. Pathol. 19 (2):113–18. doi:10.1097/00000433-199806000-00003.
- Steenland, K., and B. Armstrong. 2006. An overview of methods for calculating the burden of disease due to specific risk factors. Epidemiology 17 (5):512–19. doi:10.1097/01.ede.0000229155.05644.43.
- Tsangari, H., A. Paschalidou, S. Vardoulakis, C. Heaviside, Z. Konsoula, S. Christou, K.E. Georgiou, K. Ioannou, T. Mesimeris, and S. Kleanthous. 2016. Human mortality in Cyprus: The role of temperature and particulate air pollution. Reg. Environ. Change 16 (7):1905–13. doi:10.1007/s10113-015-0793-2.
- Zachariadis, T., and P. Hadjinicolaou. 2014. The effect of climate change on electricity needs–a case study from Mediterranean Europe. Energy 76:899–910. doi:10.1016/j.energy.2014.09.001.
- Zanobetti, A., and J. Schwartz. 2008. Temperature and mortality in nine US cities. Epidemiology 19 (4):563. doi:10.1097/EDE.0b013e31816d652d.
- Zittis, G., M. Almazroui, P. Alpert, P. Ciais, W. Cramer, Y. Dahdal, and M. Fnais, D. Francis, P. Hadjinicolaou, F. Howari. 2022. Climate change and weather extremes in the Eastern Mediterranean and Middle East. Rev. Geophys. 60 (3). doi:10.1029/2021rg000762.