
Abstract
Background
OBQ11 was developed in a Swedish context. To evaluate occupational balance, accurate self-rating instruments in the native language are needed.
Aim
The aim was to investigate the measurement properties of the Danish version of OBQ11, using the Rasch analysis.
Method
Data for the analysis of the Danish version of OBQ11 (OBQ11-DK) was gathered online, and all full data records (n 366) were included in the analysis.
Results
Three items showed non-significant marginal under- or overfit, suggesting a degree of misfit between the data and the Rasch model. Unidimensionality was not reached, though, since the proportion of persons with different estimates were more than 5% and thus the OBQ11-DK cannot be said to assess a person’s perception of occupational balance.
Conclusion
The present version of the OBQ11-DK shows the need for further development and testing and is not tested for test/retest or in clinical samples. The results and small number of items may after modifications and further studies make it feasible to implement OBQ11-DK into settings where the measuring of occupational balance is needed.
Introduction
Occupational balance is a widely used concept within occupational therapy and occupational science. Occupational balance has often been understood and described as a time-dependent construct [Citation1,Citation2]. An interest in describing the time spent on occupations has continued, but other ways of describing occupational balance have since been added, such as focusing on categories of occupations as well as the experiences from them, e.g. work, leisure and self-care, and balance in duty-bound occupations and occupations of own choice, as well [Citation2]. Eklund et al. [Citation2] and Wagman et al. [Citation3] describe occupational balance as a dynamic concept and balance between occupations changes throughout seasons and life. To gain insight into occupational balance in different populations and evaluate occupational balance, it is necessary to develop accurate instruments for measuring it. A review of instruments measuring occupational balance found that many of them did not measure balance, but other or similar constructs. Few instruments that focus on occupational balance have been developed and tested thoroughly in Danish. A commonly used instrument that has been tested in several languages, though not in Danish, is the Occupational Balance Questionnaire (OBQ11), which is intended to be a generic questionnaire that measures the subjective experience, taking into account the amount and variation of the occupations, no matter what the occupations are or where they are performed, [Citation4,Citation5]. OBQ11 is an11-item, four-response scale version that has shown good psychometric properties, i.e. good reliability and a model fit based on a Rasch analysis and furthermore, measurement invariance across age and gender groups [Citation5].
OBQ11 has been translated into a number of languages, including Arabic, English, Norwegian and Turkish [Citation6–9]. The different language versions have shown good reliability and validity, and acceptable to good internal consistency. The English translation also demonstrated a moderate test-retest reliability [Citation8], although only the Norwegian and Swedish versions have been tested using Rasch analysis [Citation5,Citation9].
The Nordic countries are similar in many regards, including language, yet there are differences and subtle nuances within the languages and the cultures of the countries. Bonsaksen et al.’s Rasch analysis of the Norwegian version (OBQ11-N) [Citation9] shows that the questionnaire might not be directly transferrable, which may be due to these differences. When OBQ11-N was tested using the Rasch analysis, the results showed that OBQ11-N did not function as a unidimensional measure of occupational balance. It should be noted that the study was conducted on a limited sample consisting solely of occupational therapy students [Citation9]. As with the Norwegian and Swedish languages, the Danish and Swedish languages are in many ways similar but can be tricky as a few words are the same, but with very different meaning, which requires a translation and testing before using the questionnaire as a reliable measure. To ensure that a translation, in this case OBQ11, is a reliable measure, the psychometric properties must be tested [Citation10] to clarify whether it measures the construct of occupational balance with any validity. Unidimensionality of a questionnaire is important to consider, as it is a basic assumption for calculation of total scores, which should represent a single defined construct. To analyse the Danish translation of OBQ11, the Rasch model is used in this study – it is a powerful tool for assessing validity of an instrument as the model operationalises the formal requirements for creating measurements [Citation10,Citation11].
Thus, this study aimed to test the measurement properties of the translated OBQ11 (OBQ11-DK) using the Rasch measurement model on an adult population belonging to the workforce.
Material and method
Translation
OBQ11 [5] was translated from Swedish into Danish by the Danish author with the aid of professional translator, and OT lecturers commented on the translation and minor revisions were made. Afterwards the Danish translation was back translated by another professional translator. Accordingly, it was further revised by the Danish author, who is fluent in Swedish, and the Swedish authors until consensus was reached on the Danish language version [Citation12]. This version of OBQ11 is referred to as OBQ11-DK.
Procedure
Data was collected by undergraduates from University College Copenhagen in 2017 for a research study on occupational balance in persons in the workforce. Socio-demographic data and OBQ11-DK responses were collected using the online Enalyzer system (https://www.enalyzer.com/#). Inclusion criteria were adults aged 18–65, whether students, employed/unemployed or on sick-leave. The respondents were recruited by posting inclusion criteria and invitations to participate on Facebook on the students’ own Facebook profiles, and no paid advertisements were used. Furthermore, the potential respondents were informed about the study’s purpose and the anonymity of the collected data and the confidential handling of the data. However, the link to the questionnaire was not posted on Facebook and the potential respondent had to email the students and agree to participate by email before a link to the questionnaire was provided. In total, 789 emails with a link to the questionnaire were sent and 395 persons (50%) responded within a three-week period, and 366 with full data were included in the analysis ().
Table 1. Demographics (n = 366).
There was no need for ethical approval as, in accordance with Danish law, consent is regarded as being given when the respondent answers the questionnaire [Citation13]. The study complies with the Danish ethical standards of research since anonymous questionnaires, where the respondent cannot be traced, are not subject to registration with the Danish Data Protection Agency [Citation13].
Instruments
The OBQ11-DK questionnaire used in this study is based on a Likert scale, where each item has four response options (0= Strongly Disagree; 1 = Disagree; 2= Agree; 3= Strongly Agree). Overall OB is calculated as the sum of all the item scores (possible range = 0–33), with a higher score indicative of a higher occupational balance. The items in OBQ11-DK were ordered as in OBQ11 and presented one at a time on-screen using the Enalyzer system ().
Table 2. The OBQ items (short form).
Rasch model
To be considered a valid and unidimensional measure, the data obtained must meet certain requirements expressed by the Rasch model [Citation10,Citation11]. Applying the Rasch model allows for testing whether there is coherence between OBQ11-DK and its underlying theory, and whether the response on each item allows for a linear measure [Citation10,Citation14]. The analysis in this study was performed using the RUMM2030 software [Citation15].
Measurement model
The Partial Credit Model (PCM) was used to test whether each item has its own rating scale structure, since the Fisher’s Likelihood-ration test was significant for OBQ11-DK [Citation10]. Bonferroni correction was used during all analysis to adjust for multiple testing and the critical value of p-value 0.05 is adjusted for 11 items to be 0.005. Analysis using the Rasch model is an iterative process in which different scale improvement strategies might be applied, for example removing misfit items or persons, adjusting Local Item Dependency (LID) by combining dependent items or splitting items with uniform Differential Item Function (DIF) into group specific items [Citation10,Citation11].
Description of analysis and results
In the following section, the description of the analysis and the results are presented in parallel for each analysis: Individual item fit, Targeting, Overall fit with the Rasch model, respectively.
Individual item fit of OBQ11-DK
Analysis
Individual item location and fit was examined using standardised fit residual values, which express the differences between observed responses in OBQ11-DK and those expected by the model and are regarded as acceptable within the range of ± 2.5 [Citation16]. High item fit residuals are signs of under-discrimination and might reflect multidimensionality, while low residual values may indicate over-discrimination and reflect potential redundancy or item dependency within the item set [Citation17]. For individuals, high positive fit residual reflects under-fit due to random responses that may be attributed to doodling or carelessness. High negative fit residuals indicate over-fit and might occur if item difficulties are apprehended by respondents, due to acquiescence and social desirability or if the intermediate response categories are selected for all items [Citation18]. Item fit was also examined graphically by plotting the observed item responses for each class interval against the model expectations, which are displayed as an item characteristic curve (ICC) [Citation17].
Chi-squared (χ2) statistics was used to determine whether the difference between the observed and expected values is statistically significant or not [Citation11,Citation16]. LID refers to whether a score on one item depends on another item’s score. LID is evident by item residual correlations > 0.2 above the average correlation [Citation10] and might reflect the content of a previous item affecting responses to a subsequent (dependent) item [Citation19]. LID was investigated using a residual correlation of the items.
DIF refers to item bias that occurs when subgroups with a similar level of the measured construct have a different response pattern to an item [Citation20]. In this study, DIF was examined by gender and two age-groups defined by the median (18–44 and 45–65 years). The analysis uses a 2-way ANOVA on the residuals for each item across the subgroups and across the class intervals. DIF can occur as uniform DIF, where item responses differ uniformly across the measured construct (i.e. a main effect) or as non-uniform DIF, where differences in item responses between subgroups vary across the measured construct (i.e. an interaction effect) [Citation16].
Results
presents the item level fit statistics. Three items had fit residual values outside the range of ± 2.5. As seen in , item 7 and 10 displayed non-significant negative fit residuals and ICCs indicative of marginal over-discrimination. Item 11 () obtained a non-significant positive fit residual value and an ICC indicative of marginal under-discrimination. Of the 22 respondents showing overfit, 12 showed a response pattern too perfect or consistent with the item locations. Ten respondents with overfit had selected the intermediate response categories for all items.
Figure 1. (a) ICC for item 7, (b) ICC for item 10, (c) ICC for item 11.
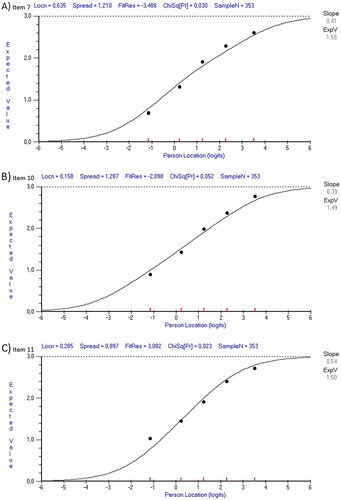
Table 3. Individual item location and fit of OBQ11-DK.
LID showed up between item 5 and 7 (r = 0.22) and this may reflect a response dependency.
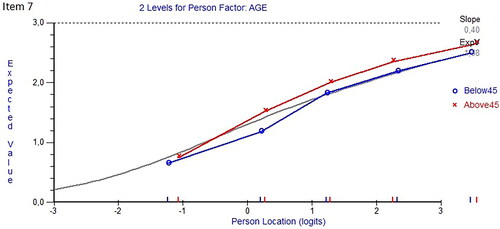
However, uniform DIF by age turned up for item 7 (Satisfaction with how time is spent in everyday life). shows that the oldest group scored systematically higher than the young group, indicating that the item does not work the same way in different age groups. Splitting item 7 into two age-specific groups (one for younger and one for older respondents) to adjust for the DIF did not improve overall fit with the model. There was no DIF by gender.
Figure 2. DIF by age for item 7.
Targeting
Analysis
Targeting is defined as the extent to which the range of the measured construct matches the range of the measure in the study sample [Citation10]. A well-targeted rating scale would have both item and person mean locations of around zero and there would be enough items of varied difficulty to match the spread of scores among respondents [Citation11,Citation17]. If the OBQ11-DK scale is poorly targeted, i.e. too difficult, or too easy, respondents may report having no occupational balance (floor effect) or having complete occupational balance (ceiling effect).
Results
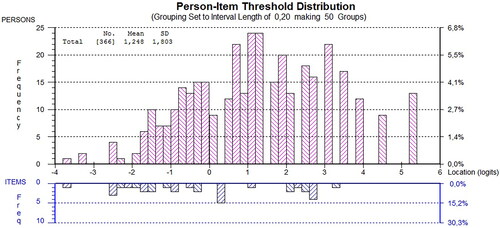
displays how OBQ11-DK presented slightly suboptimal targeting with insufficient match between overall spread of items and spread of respondents. A ceiling effect was only present for 3.6%. However, the mean person location of 1.25 logits indicates that the sample was on average at a higher ability level of occupational balance than the mean difficulty of zero for the items.
Figure 3. Person-item threshold distribution.
Summary of overall fit statistics for OBQ-DK
Analysis
Overall model fit is provided in RUMM2030 by summary fit residual statistics for items, which should ideally approach a standardised mean value of zero and a SD of 1.4, and by a summary item χ2 statistic, which should be non-significant (p > 0.05), reflecting homogeneity of the items across the different class intervals [Citation11,Citation16,Citation17]. As a part of the overall model fit, reliability and unidimensionality of the scale is reported.
The reliability indicates the power of the measured construct to discriminate amongst persons. Reliability was examined using the Person Separation Index (PSI), the Rasch equivalent to Cronbach’s α, except that it is calculated from the logit scale person estimates. Reliability of 0.70 is the lowest acceptable level, as it allows discrimination between two distinct groups [Citation10]. If the PSI is not acceptable, the top measure cannot be statistically distinguished from the bottom measure with any confidence [Citation10]. For fit with the Rasch model, monotonicity by means of ordered thresholds is expected and implies that the transition from one score to the next is consistent with the increase in the measured construct [Citation10,Citation14]. Threshold ordering was examined using a threshold map and category probability curves.
Unidimensionality of the OBQ11-DK scale is defined as the absence of any meaningful pattern in the residuals [Citation17,Citation21] and the reflection of one common construct. The pattern of positive and negative loadings between items and the first residual factor was used to define two subsets of items with the most disparate loadings [Citation17,Citation21]. The difference of the person location estimates for each person from these two subsets was investigated using a series of t-tests [Citation22]. Unidimensionality was inferred if less than 5% of the sample shows a significant difference in person location estimates [Citation22] or if the value of 5% falls within an exact binomial 95% confidence interval (CI) of proportions [Citation10].
Results
As seen in , the reliability and power of fit was excellent, with PSI > 0.90, which indicates that the scale can differentiate between groups.
Table 4. Rasch analysis: summary of overall fit statistics for OBQ-DK .
Furthermore, shows that the initial analysis of OBQ11-DK resulted in a significant item interaction and a fit residual mean value (SD) for items, indicating misfit between the item responses. The residual mean value (SD) for persons was −0.39 (1.40), indicating slight misfit for some respondents in the sample.
To gain a more precise impression of the measurement properties of OBQ11-DK, the responses from the 28 persons with fit residuals outside the acceptable range were removed and the dataset re-analysed. As shown in , this did not improve the overall fit statistics markedly. At item level, nearly all the initial findings persisted, except that the misfit of item 10 was resolved.
As seen in all items had ordered thresholds, demonstrating that the score categories function as intended.
Discussion
This study aimed to determine the measurement properties of OBQ11-DK using the Rasch model.
Unidimensionality is a matter of degree and the decision on whether a scale is sufficiently unidimensional should ultimately come from a synthesis of the graphical, descriptive, and statistical analysis in conjunction with the purpose of measurement and clinical/theoretical considerations [Citation21,Citation23]. Our initial analysis found that the reliability was good with a PSI at 0.90. However, the t-test indicated that the estimates from the two most divergent subsets of items within the OBQ were significantly different for 5.7% of the respondents, which does not support unidimensionality. Since the latter exceeded the critical value of 5% and though the lower bound of the 95%, CI was 3.4%, it indicates a problem with unidimensionality. The positive response dependency may have inflated the PSI, indicating a less precise measurement.
Three items showed non-significant marginal under- or overfit. Our intention was not to remove any items purely on statistical grounds in favour of theoretical considerations, as it might distort the content validity of the measurement [Citation10,Citation21].
At item level, ordered thresholds confirmed that the score categories function satisfactorily, though three items demonstrated non-significant misfit and four item pairs displayed a slight LID. However, as OBQ11-DK included different aspects of occupational balance, this may have caused the slight LID.
It seems that especially item 7 ‘Satisfaction with how time is spent in everyday life’ holds some flaws. That is, a non-significant negative fit residual, and a residual correlation to item 5 and DIF by age. The negative fit residual in conjunction with the LID might reflect response dependency for item 7. Furthermore, the additional item pairs displaying LID shares identical aspects of occupational balance and to a great extend contains similar wordings, this might explain the findings. The presence of LID between four item pairs out of ten items suggests that the dependent items might benefit from modifications, either to the translation per se or the wordings of the original items.
Item 7 also displayed uniform DIF by age after removal of misfit persons. Håkansson, Wagman, and Hagell [Citation5] also found uniform DIF by age for item 7 in OBQ11 but concluded that the observed DIF did not appear to cause any obvious bias in OBQ11 as a measure of occupational balance. However, as DIF is present in both language versions, it might reflect a shift in the experience of balance over a lifetime, or an absence of nuances in the Danish translation or different perception of the concept ‘satisfaction’ (item 7). Furthermore, future studies could include a cultural adaptation by testing face validity using a dual panel testing approach [Citation12].
In line with what has been found for the original OBQ11, there are some gaps at the item-thresholds continuum [Citation5]. This perhaps suggests that OBQ11-DK may not measure varying levels of occupational balance and indicates a limited suitability to detect small changes in respondents across the whole continuum of occupational balance. Some item-thresholds are in the same place, i.e. these item-thresholds are duplicating the ability to discriminate at that level of difficulty.
This might imply that it is not optimal to use OBQ11-DK for detecting differences between individuals with higher occupational balance or to evaluate changes over time in such samples.
At person level, 28 respondents (about 8%) presented with misfit which might have occurred due to the sub-optimal targeting of OBQ11-DK. This might occur if respondents capture the distribution of the item difficulties and could be due to random responses, perhaps due to carelessness or doodling [Citation18]. However, there might be reasons attributed to the scale itself or the data collection procedure. Electronic questionnaires may attract the person if the topic is of interest but are also easily forgotten or done without any real interest. Although, ten overfitting respondents had selected the intermediate response categories for all items this scoring pattern might reflect the actual view of the respondents, over- or under fit might occur if respondents decide without reading the items to use the central response options or if items are worded very similarly [Citation18]. In the revised Swedish OBQ11, the four-response options were identified as preferable and Håkansson et al. removed two items from the original OBQ as these were not considered to be related to the construct [Citation5]. Considering the results of this study, it might be suggested that additional items, rather than number of response categories, may improve the precision and targeting of OBQ11-DK.
If the included sample size had been larger, it might have been possible to identify the optimal critical value that balanced retainment of the highest proportion of fitting respondents, allowing the maximum amount of statistical information and exclusion of the greatest proportion of misfitting responses [Citation18]. However, it is suggested that in the case of good targeting, a sample size of about 250 provides a sound base for the statistical interpretation of the fit statistics [Citation24].
Given the results of the translated version of OBQ11, the question of translation and adaptation of questionnaires comes up. The pros and cons of using forward/backward translation are a topic for discussion and McKenna et al. amongst others, have described potential problems with this method [Citation12]. However, others have found that both forward/backward translations and using expert panels to test face validity have more or less the same linguistic results and pitfalls [Citation25]. A questionnaire’s content should be appropriate to the culture of the target country and a successful adaptation can only be achieved if the measure reflects common experience [Citation12,Citation26]. It is suggested that one should aim for what is termed parallel tests, i.e. not linguistic equivalents but ones that ‘validly assess semantic performance in each language’ [Citation27], which may result in instruments with added items and a different ordering of items when applied in different language or cultural groups. The face and content validity of the Danish version was not tested prior to this study. However, using professional translators and as the first author has Danish as her native language and is fluent in Swedish, it could be assumed that the loss of meaning is minimal. Nevertheless, OBQ11-DK still needs to be tested in further studies.
Though it can be accepted that theoretical constructs are not clearly distinct in a theoretical or conceptual model, the lack may challenge an instrument’s ability to measure the construct in a precise and valid manner. The Norwegian OBQ11-N was translated and tested for face validity [Citation28], but later results from the Rasch analysis showed that OBQ11-N did not fit the Rasch model [Citation9]. Although this may have been due to the uniform sample of solely occupational therapy students in the Rasch analysis, it illustrates the need for thorough testing of instruments even in countries with large similarities in terms of history, language, and culture.
OBQ11-DK shows promise as an instrument and may be a useful supplement to other occupational therapy assessments used in Denmark. After further modifications and testing, the small number of items will make it feasible to implement the OBQ11-DK instrument in contexts where information on occupational balance is needed. However, it should be kept in mind that current translated Danish version did not confirm unidimensionality and it has not been tested for measuring change over time and in clinical populations. The results show the need for further development and testing of the OBQ-11.
Methodological limitations
Initially we found it necessary to test the Danish translated OBQ11-DK on a larger and more diverse sample than OBQ11-N, for example. However, the population in this study was biased towards well-educated females. The fact that the sample was recruited through the acquaintances of occupational therapy students and lecturers may have caused an overrepresentation of well-educated females, which may have affected the results. However, it should be noted that the bias due to the relative homogeneity of the study population, as in the study by Håkansson, Wagman and Hagell [Citation5], may reflect the general population, as women in Denmark have a high level of education [Citation29]. This bias towards well-educated women should be noted as it may not represent other genders’ perspective, or the lower-educated groups. A general problem with this sort of research is that people with low income and/or education tend not to participate in research, which may also be a factor in the bias towards well-educated females. Thus, there is a need for including more diverse populations and clinical settings in the further development of the OBQ11-DK.
The data gathering was performed exclusively online, which biased the results, as using online questionnaires can result in different outcomes than questionnaires in paper form [Citation30]. Furthermore, it may exclude persons with limited access to digital hardware or lack of digital skills.
Conclusion
The results showed that OBQ11-DK did not demonstrate unidimensionality, as the t-test had exceeded the critical value of 5% with 0,7%. Though the OBQ11 may be feasible for testing occupational balance, the OBQ11-DK did not fully match what has been found for OBQ11, when applied in a Danish non-clinical population and thus it cannot be used as an unidimensional test of occupational balance. The next steps should be to look at the face validity, item modification, and furthermore include test-retest for measuring change to establish the validity of the measures in various populations. This study included a non-clinical sample and needs to be tested on clinical and more diverse populations in Denmark.
The results can be used for development and further testing of OBQ11-DK and provide guidance for further studies, including a dual-panel approach and test of additional items and thus a revision of OBQ11-DK.
Acknowledgements
We wish to thank the students for collecting the data used in this study. We are grateful for Tina Hansen’s thorough contribution to the Rasch analysis.
Disclosure statement
No potential conflict of interest was reported by the author(s).
References
- Christiansen C. Three perspectives on balance in occupation. In: Zemke R, Clark F, editors. Occupational science: the evolving discipline. Philadelphia: F.A. Davis Company; 1996. p. 1–10.
- Eklund M, Orban K, Argentzell E, et al. The linkage between patterns of daily occupations and occupational balance: applications within occupational science and occupational therapy practice. Scand J Occup Ther. 2017;24(1):41–56. doi:10.1080/11038128.2016.1224271.
- Wagman P, Håkansson C, Björklund A. Occupational balance as used in occupational therapy: a concept analysis. Scand J Occup Ther. 2012;19(4):322–327. doi:10.3109/11038128.2011.596219.
- Wagman P, Håkansson C. Introducing the occupational balance questionnaire (OBQ). Scand J Occup Ther. 2014;21(3):227–231. doi:10.3109/11038128.2014.900571.
- Håkansson C, Wagman P, Hagell P. Construct validity of a revised version of the occupational balance questionnaire. Scand J Occup Ther. 2020;27(6):441–449. doi:10.1080/11038128.2019.1660801.
- Günal A, Pekçetin S, Demirtürk F, et al. Validity and reliability of the Turkish occupational balance questionnaire (OBQ11-T). Scand J Occup Ther. 2020;27(7):493–499. doi:10.1080/11038128.2019.1673479.
- Dhas BN, Wagman P, Marji FA, et al. Translation and initial validation of the occupational balance questionnaire to Arabic—occupational balance questionnaire-A. Brit J Occup Ther. 2021;85(7):533–540
- Yu Y, Manku M, Backman CL. Measuring occupational balance and its relationship to perceived stress and health: Mesurer l’équilibre occupationnel et sa relation avec le stress perçus et la santé. Can J Occup Ther. 2018;85(2):117–127. doi:10.1177/0008417417734355.
- Bonsaksen T, Lindstad MØ, Håkansson C, et al. Rasch analysis of the Norwegian version of the occupational balance questionnaire in a sample of occupational therapy students. Occup Ther Int. 2021;2021:8863453–8863411. doi:10.1155/2021/8863453.
- Christensen KB, Kreiner S, Mesbah M. Rasch models in health. Hoboken, NJ: John Wiley & Sons, 2013.
- Pallant JF, Tennant A. An introduction to the Rasch measurement model: an example using the hospital anxiety and depression scale (HADS). Br J Clin Psychol. 2007; 46(Pt 1):1–18. doi:10.1348/014466506x96931.
- Mckenna PS, Wilburn J, et al. Adapting patient-reported outcome measures for use in new languages and cultures. In: Christensen K, Kreiner S, Mesbah M, editors. Rasch models in health. Hoboken: Wiley; 2013.
- Retsinformation. Law regarding ethical accreditation of health sciences research projects; Chapter 4, § 14, 2 (In Danish: Lov om videnskabsetisk behandling af sundhedsvidenskabelige forskningsprojekter) 2011 [cited 2022 November 18th]. Available from: https://www.retsinformation.dk/Forms/r0710.aspx?id=137674#Kap4.
- de Vet HCW, Terwee CB, Mokkink LB, et al. Measurement in medicine: a practical guide. Cambridge: cambridge University Press; 2011.
- Andrich D, Lyne A, Sheridan B, et al. RUMM2030. Perth: RUMM Laboratory Pty; 2010.
- Hagquist C, Bruce M, Gustavsson JP. Using the Rasch model in nursing research: an introduction and illustrative example. Int J Nurs Stud. 2009;46(3):380–393. doi:10.1016/j.ijnurstu.2008.10.007.
- Andrich D, Sheridan B. RUMM2030 manual. Perth, Australia: RUMM Laboratory; 2009.
- Curtis D. Person misfit in attitude surveys: Influences, impacts and implications. International Edu J. 2004;5:125–144.
- Marais I, Andrich D. Formalizing dimension and response violations of local independence in the unidimensional rasch model. J Appl Meas. 2008;9(3):200–215.
- Hagquist C, Andrich D. Recent advances in analysis of differential item functioning in health research using the rasch model. Health Qual Life Outcomes. 2017;15(1):181. doi:10.1186/s12955-017-0755-0.
- Hagell P. Testing rating scale unidimensionality using the principal component analysis (PCA)/t-test protocol with the Rasch model: the primacy of theory over statistics. OJS. 2014;04(06):456–465. doi:10.4236/ojs.2014.46044.
- Smith E. Understanding Rasch measurement: detecting and evaluating the impact of multidimensionality using item fit statistics and principal components analysis of residuals. J Appl Meas. 2002;3:205–231.
- Hagell P, Westergren A. Sample size and statistical conclusions from tests of fit to the rasch model according to the Rasch unidimensional measurement model (RUMM) program in health outcome measurement. J Appl Meas. 2016;17(4):416–431.
- Chen W, Lenderking W, Jin Y, et al. Is Rasch model analysis applicable in small sample size pilot studies for assessing item characteristics? An example using PROMIS pain behavior item bank data. Qual Life Res. 2014;23(2):485–493. doi:10.1007/s11136-013-0487-5.
- Lee WL, Chinna K, Lim Abdullah K, et al. The forward-backward and dual-panel translation methods are comparable in producing semantic equivalent versions of a heart quality of life questionnaire. Int J Nurs Pract. 2019;25(1):e12715. n/a.
- Su C, Parham LD. Generating a valid questionnaire translation for cross-cultural use. Am J Occup Ther. 2002;56(5):581–585. 5p. doi:10.5014/ajot.56.5.581.
- Peña ED. Lost in translation: methodological considerations in cross-cultural research. Child Dev. 2007;78(4):1255–1264. doi:10.1111/j.1467-8624.2007.01064.x.
- Uhrmann L, Hovengen I, Wagman P, et al. The Norwegian occupational balance questionnaire (OBQ11-N) – development and pilot study. Scand J Occup Ther. 2018;26(7):546–551. doi:10.1080/11038128.2018.1523458.
- DST. Befolkningens uddannelsesstatus. Danish Statistics; 2016. Available from: https://www.dst.dk/da/Statistik/emner/befolkningens-uddannelsesstatus.
- Wæhrens EE, Amris K, Bartels EM, et al. Agreement between touch-screen and paper-based patient-reported outcomes for patients with fibromyalgia: a randomized cross-over reproducibility study. Scand J Rheumatol. 2015;44(6):503–510. doi:10.3109/03009742.2015.1029517.