
ABSTRACT
Gaining useful information about our built, social and natural environments is vital and possible. The value of data for cities is more informed, more effective management and development choices resulting in more benefits to a greater range of stakeholders. This article explores the state-of-play of data infrastructures in New Zealand to identify the challenges to gaining better value from geospatial information. Following engagement with built environment data custodians and information users, it analyses how digital information infrastructure can support the sharing and use of richer and more comprehensive information by weaving a supportive fabric across data. The analysis reveals that data infrastructures primarily need to facilitate agreement on data management, sharing and use; the sharing of costs and benefits across stakeholders; and emphasise place as a powerful driver to richer information. An overarching sociotechnical approach to digital information infrastructure weaves data platforms, policy and technology together.
Introduction
The value of data, and in particular geospatial data, lies in its contribution to building healthy, productive and resilient communities (Jonientz-Trisler et al. Citation2005; Graham et al. Citation2011; Nykiforuk & Flaman Citation2011; Musa et al. Citation2013; Villagra et al. Citation2014; Bernknopf & Shapiro Citation2015; Bureau of Communications Research Citation2016). Data has high value particularly when planning is complex and the benefits accrued may be uncertain (Henderson Citation1986), meaning deliberate design and policy choices are necessary (Rydin et al. Citation2012). The ever-increasing generation of data – including ‘big data’ (Kaisler et al. Citation2013), combined with a desire to invest, plan and manage our resourcing more wisely, means that gaining useful information about our built, social and natural environments is increasingly vital. The value of data for cities is in making more informed, more effective development choices that result in more benefits to a greater range of stakeholders.
Beyond the role played by data in the development and management of built environments, it can also add value to the relationship between individuals and the places where they live their everyday lives. ‘Place’ is more than just a physical space – it also includes layers of social data that includes users’ networks, perceptions, and attitudes (Roche & Rajabifard Citation2012). The place-based generation, use and exchange of data can be seen as a social practice where there is a recursive relationship between environments and the behaviours taking place in and around them (Ivory et al. Citation2015). For example, everyday activities such as physical activity are shaped by the context of place and in turn shape those very places through those social practices (Frohlich et al. Citation2001; Ivory et al. Citation2015). In a similar way, generating, using, and sharing data is increasingly a way people make decisions about the location of everyday activities, and how they engage with places (Roche Citation2016).
The potential of digital information infrastructure for richer information
Obtaining value from data for individuals, communities and urban environments requires effective and efficient infrastructure for both sharing and using data to generate rich and useful information. In this paper, we are interested in Digital Information Infrastructure (DII) as the enabling network of background equipment, protocols, facilities and services that support the production, management and use of digital information. DII includes the very local as well as global systems that facilitate sharing information internationally (Bowker et al. Citation2009). Within the broader DII topic, we are also specifically interested in Spatial Data Infrastructure (SDI) which refers to information that incorporates multiple, distinct geographic information systems (GIS) (Chan & Williamson Citation1999; NAO Citation2012).
More data does not necessarily mean more useful information about people and places. No single data source or type will be able to give us all the information needed to plan and manage our built environments. Instead, infrastructure that facilitates sharing and linkage across different data sources and types can help to weave a rich, comprehensive blanket of information.
Secondary data from routine or administrative sources often provide broad data coverage across whole populations, regions, and/or networks (see , x-axis). They can give us a little ‘slice’ of information across a lot of the population, for example, nation-wide administrative hospitalisation data can be used to develop cancer outcome datasets with millions of observations. They are used to describe variations in the distribution of disease across New Zealand’s health authorities but tell us less about the experiences of individuals trying to access health-related resources within the built environment. Other approaches to data collection give us a lot of detail about a little part of the population, region, and so on. They offer ‘narrower’ coverage in terms of the number of observations or sites but can afford to gather data with more depth (i.e. with more detail and/or insights, for example, about experiences). The practicalities of data collection mean that more in-depth methods will have relatively restricted coverage, and vice versa.
Figure 1. Trade-off between depth and coverage in single-source or bespoke integration data.
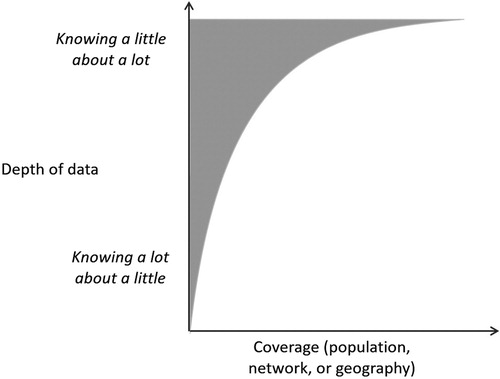
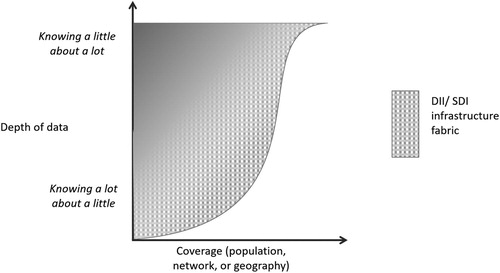
Overcoming the coverage/depth trade-off to gain richer, more comprehensive information about the environments we live in requires increasing the capacity to gain insights from ‘deep’ datasets, and giving greater depth to ‘broad’ datasets. In theory, information infrastructure that integrates, or ‘weaves’ across data sources and types can extend both depth and coverage, resulting in richer information about people and place, as illustrated in . For example, linking data from in-depth enquiries with broader secondary sources, or linking building and people data, could increase the usefulness, scope, and richness of information and therefore value of data.
Figure 2. Multi-source, multi-use integrated data to develop rich information.
This paper explores the current state of play of digital information infrastructure in New Zealand to identify the challenges to gain better value from geospatial information – whatever its source. What is currently in place, what approaches are being put forward, and what issues are being raised? It thereby contributes a cross-disciplinary analysis of digital information infrastructure examples across public and public-private stakeholder initiatives in New Zealand.
The remainder of this paper is structured as follows. First, the following section presents components of data infrastructures in the context of sociotechnical systems. The next section describes the state of play of data infrastructures in New Zealand based on examples of recent developments. Then, the potential and challenges of data infrastructures to leverage the value of data are discussed with a focus on geospatial information, followed by the conclusion.
The information infrastructure
Descriptions of DII and SDI have varying levels of complexity (Rajabifard & Williamson Citation2001; Giff & Coleman Citation2002; Steiniger & Hunter Citation2012). Components include information with spatial coordinates attached (Loenen Citation2006); supporting technologies to store, transport and manipulate data using a range of hardware and software technologies; technical standards to facilitate interoperability between datasets (McLaughlin & Nichols Citation1994); law and policy providing an overarching framework of any centrally developed or facilitated SDI (Loenen Citation2006); human resources, including stakeholders (such as data providers and users) and their organisations (Loenen Citation2006; Steiniger & Hunter Citation2012), governance (Rajabifard Citation2008), and skill development (Hendriks et al. Citation2012); and finally, the financial resources and funding models needed to facilitate implementation (NRC Citation2012), such as the establishments of consortiums, public-private co-funding, direct government financing, or solely private sector investment (Giff & Coleman Citation2002).
The description above suggests DII and SDI are part of a deeper ‘sociotechnical’ system of interactions between people, organisations, and technology (Chan & Williamson Citation1999). Systems include technical standards, data, software, and hardware alongside both governance structures and people at all levels of organisation (Chan & Williamson Citation1999; LINZ Citation2011, Citation2012). They are inherently collaborative, requiring complex governance arrangements (Rajabifard Citation2008; Johnston & Hansen Citation2011; Constantinides & Barrett Citation2014). In this way of thinking about infrastructure, technological innovation is inseparable from social processes, and any infrastructure must also look to the phenomenon that emerges when technological and social systems interact (Sawyer & Jarrahi Citation2014).
For example, the technical challenges raised by differences in data standards and capacities are compounded by ‘social’ challenges, including the multiplicity of data ‘owners’, their privacy and privilege concerns, and the degree of trust and agreement that is required to make the ‘best’ use of data (Welch et al. Citation2016). DII and SDI form part of a diverse data community which includes actors in business communities, social communities, and in research communities. In addition, each of these represents multiple disciplines and cultures, with a variety of values and perspectives (Constantinides & Barrett Citation2014).
Adding further complexity, silos exist in both the information technical systems and the data community (Hall Citation2005; Phillips et al. Citation2011). Data and information silos can occur particularly where ways of communicating vary, or issues of economy and resource allocation exist. For example, misunderstanding can occur through cross-cultural barriers (Damian & Zowghi Citation2003; Oertig & Buergi Citation2006; Niazi et al. Citation2010), which may lead to collaborators working at cross purposes, or where one organisation controls data but does not pass on the economic benefits of sharing, reducing the incentive for others to share.
Emergence of DII and SDI in New Zealand
As seen in other countries, the generation, use, sharing, and overall value of data is rapidly changing in New Zealand. The developments reflect significant changes in data sources, types, and content in New Zealand. The range of data sources is increasing. Routine data is being generated from the digitisation of the mundane, everyday activities such as parking and traffic flows, particularly through sensing. Building Information Modelling (BIM), digital engineering, and a ‘whole of life’ approach to Asset Management are driving the creation of detailed datasets about the built environment. There has been a rise of citizen-generated data around disasters (Mora et al. Citation2015) and management of the built environment, for example, the ‘My Waikato’ app provides an easy to use platform for residents to report issues to the regional council (My Waikato Citation2018). Novel data sources offer the promise (and challenges) of adding in novel types of data (such as geocoded photos) as well as richer, more qualitative content (such as narratives) that can complement formal and/or quantitative data sources.
New Zealand’s information infrastructure has been described as fragmented, siloed, and characterised by multiple standards (LINZ Citation2012). In 2011, the Land Information New Zealand (LINZ) Spatial Data Infrastructure Cookbook, for example, cited ‘nearly 100 standards … as part of the architecture and deployment of interoperable geospatial solutions’ (LINZ Citation2011, p. 18). Similarly, in 2012, LINZ reported the GIS community as rating readiness in New Zealand as low particularly in terms of planning for publication of non-fundamental datasets (‘this is taking place in an ad hoc manner’, LINZ, Citation2012 p. 8). They highlighted challenges whereby metadata catalogues were maintained by just a few specialists, and that ‘third sector’ organisations such as NGOs lacked representation. The public sector has also been said to hold large amounts of information that is not yet being shared effectively, in part due to a lack of shared knowledge about what is available (Ferriss & Erasmuson Citation2016).
A shift from DII and SDI as a large ad hoc, as needed, developments to a more planned, systematic approach can be seen in some quarters. For example, in 1997, Statistics New Zealand (Citation2017) was identified as the appropriate organisation to lead and develop data integration across government agencies (Statistics New Zealand Citation2018). Initial data integration projects were limited to the linkage of small numbers of datasets, for specific purposes, and only for the life of the project, limiting the capacity to undertake complex work built up over time and teams. 2011 then saw a shift towards a data integration service model with the prototype integration of immigration data with Statistics NZ’s integrated datasets. Integration was further expanded in 2013 with Cabinet agreement to expand data integration across social agencies to facilitate better delivery of public services (Statistics New Zealand Citation2018). Thus, there has been growing high-level support through central government initiatives and policy, albeit through enabling approaches rather than direct development through a public-private partnership focus and access to government data through permissive use-licenses.
Despite the largely ad hoc emergence of geospatial-enabled analysis and research, New Zealand has been at the forefront of data linkage initiatives perhaps in part to its small size and relatively comprehensive data sources. For example, linking environmental and individual data in public health analysis has a relatively long history. By linking of small-area (neighbourhood) measures of socio-economic deprivation with individual and household-level variables from census data, and then using probabilistic linkage with mortality data, epidemiological analyses were able to quantify geographic and socio-economic determinants of health inequalities (Blakely et al. Citation1999). Multilevel analyses using linked data sources were enabled by the provision of a geographic structure to the datasets held by Statistics NZ and the Ministry of Health. As important as the practical data platforms, they were also enabled by emerging theoretical socioecological frameworks and methods for the so-called multilevel statistical modelling, and by the social networks that allowed the working through of technical, policy, and ethical issues between researchers and data custodians.
NZ scene: scan across the state of play in New Zealand
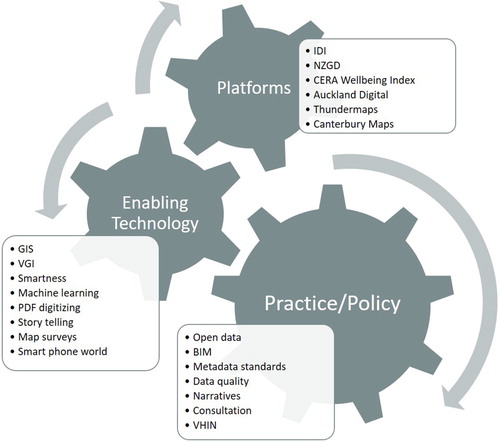
Unsurprisingly, there are a wide range of structures and approaches to data integration and geospatial data present in New Zealand. This paper provides an opportunity to bring a sociotechnical system lens to view these various structures and approaches so we can better describe and understand the phenomena emerging from them. The scan and analysis is a research exercise undertaken as part of the National Science Challenge, ‘Building Better Homes, Towns and Cities’ Strategic Research Area ‘Next-Generation Information For Better Outcomes’. However, it also calls on the challenge and practice of working with integrated data (or often un-integrated data) we have seen in other programmes, including health, transport, and natural hazards research. collates representative examples from our observations and experience as active research users of integrated data, policy documents, and our opportunistic and purposeful engagement with stakeholder forums and face-to-face interviews with data practitioners in a range of sectors (for example, open data policy, built environment practitioners such as traffic engineers, asset managers, planners). For the purposes of the following exercise, we have grouped them in terms of practice/policy (social), and platforms and enabling technologies (technology) as per the sociotechnical systems approach. We discuss examples of the two interacting groups, their capability, purpose, and challenges in the following.
Figure 3. Overview of New Zealand’s digital information infrastructure (including geospatial information) with examples grouped as per the sociotechnical systems approach.
Platforms and enabling technology
Platforms range from top-down initiatives from government agencies for planning purposes, to those developed by researchers to undertake analysis, to industry-led developments focused on addressing specific information needs. Platforms vary considerably in terms of their sophistication and user interfaces. For example, the Statistics NZ Integrated Data Infrastructure (IDI) (Statistics New Zealand Citation2018) federates across multiple, highly secure, data sets and provides users with the capacity to undertake an in-depth analysis of populations using linked, de-identified individual-level data without compromising confidentiality. Secure data laboratories have been established, complete with screening and training of users and approval of analysis plans and outputs as a means of ensuring confidentiality A feature of federated platforms has been the progression from ‘bespoke’ linkage to ‘fully integrated and wider access’ (Blakely et al. Citation2015). Such platforms are facilitating the use of administrative / operational data for wider purposes, including investment planning, programme monitoring, and cost–benefit analyses.
More targeted platforms have been developed to address specific needs. For example, the New Zealand Geotechnical Database (NZGD) (Ministry for Business, Innovation & Employment Citation2018) platform facilitated access to the thousands of geotechnical assessments being undertaken as Christchurch city rebuilt, reducing the burden on property owners, insurers and specialists, as well as providing a rich picture of the geo-morphology of the Christchurch area.
Industry-led platforms have emerged, which in many cases link data from governmental and private sector sources in commercial platforms. Digital Auckland (Nextspace & Auckland Council Citation2018) (colloquially known as ‘Bruce’) is an example of a tool commissioned by Auckland Council to integrate and manage data from multiple sources within Land Information New Zealand (LINZ), local councils and infrastructure providers. The tool’s visual interface provides an easier way to manage complex spatial datasets with obvious benefits to data custodians through cost effective data management and increased use of their linked data, but data access and management is retained by custodians. SaferMe (Citation2018) is an industry-driven platform using crowd-sourcing methods to spatially report and share information about risks, and Koordinates (Citation2018) offers clients the distribution of their spatial datasets in an integrated platform.
‘Observatory’ type platforms have also been developed with a primary focus on sharing information in more digestible and accessible ways. Environment Canterbury’s ‘Canterbury Maps’ (Canterbury Maps [Citationdate unknown]), for example, provide a single access point for anyone to engage with a wide range of information about Canterbury. Statistics NZ promote the easy use of census and business data through DataHub Table Viewer platform (Statistics New Zealand) where sensitive microdata data has been aggregated to retain confidentiality.
The above platforms have been enabled through the development and uptake of technology. Technology is, to a large degree, the means by which so-called ‘smartness’ happens (Scholl & Scholl Citation2014). That is, information and communication technologies are providing the means for greater transparency, efficiency, improving liveability, and collaboration around how we build, manage and plan for our built environments (Scholl & Scholl Citation2014). GIS (Geospatial Information System) has become ubiquitous, cloud systems and methods such as linked data have facilitated developments such as the ones mentioned above. Further, an increased use of Application Programming Interfaces (APIs) by local authorities provides nodes for developers to interact with public datasets, which fosters the re-use of information in linked applications and projects. Volunteered geospatial information (VGI) and sensing are enabling technologies now being used to populate many of the described platforms, adding to the variety of data sources, types and contents. The form of information and communication technology is recognised as critical to the ability of organisations to generate and use data, as well as consume information from other sources, as seen by government investment in rural broadband.
Practice and policy
Increasing collaboration and sharing of data between government and private sector entities is facilitated through such platforms and technology. The drivers for change are a range of initiatives involving governmental support through the (1) development of policy and frameworks, (2) initiatives related to setting or encouraging effective standards and technologies, and (3) initiatives aimed to address the people and community factors in SDI development.
Examples of policy and frameworks are the e-Government Interoperability Framework (e-GIF), the Directions and Priorities for Government Information and Communication (ICT) framework, and the Better Administrative Support Services (BASS) programme. Two particularly important initiatives have been that of the Open Government Partnership, and the New Zealand Government Open Access Licensing framework (NZGOAL).
As a top-down initiative, the Open Government Partnership includes policy direction and specific actions for improving official information practices, improving open data access, and ongoing stakeholder engagement. This goes some way to furthering New Zealand’s high global ranking for government transparency and accountability (SSC Citation2016). NZGOAL is a framework for the public release of non-personal material for re-use under creative commons licenses (in contrast to a revenue gathering approach) to encourage associated infrastructure development through lowering barriers to use (LINZ Citation2010, Citation2011). Various enabling projects exist to enhance access and use by lowering barriers and addressing factors such as developing data standards to facilitate sharing. A strong driver for open data policy has been the recognition of the greater economic value possible through connecting information: ‘New Zealand could have benefited from an additional $481 million in productivity-related benefits in 2008, generating at least $100 million in government revenue’ (ACILTasman Citation2009, p. ix).
Other drivers include those which focus on enabling through (metadata-) standards and technologies and bridging between government and private entities. Policy-level enablers include providing access to government data via open standards, and through providing information sources such as the Spatial Data Infrastructure Cookbook (LINZ Citation2011). The Cookbook itself is designed to guide the early stages of SDI implementation, to aid understanding of the various technical standards, and provide an overview on how to enable efficient, accessible data systems. However, they point out that ‘an SDI is merely a foundation. The data infrastructure must be augmented by a wider range of tools and applications that are needed to deliver business capabilities’ (LINZ Citation2011, p. 56). Implicit is the assumption that solutions will remain bespoke, but should be designed with integration in mind – ‘data stewards’ should ensure that datasets ‘conform to appropriate national, international, or agreed standards’ (LINZ Citation2011, p. 12).
People-focused initiatives have been broad. They include nation-wide stakeholder surveys, consultation, training and other activities designed to foster relationship building. The Open Data Charter Public Consultation held in 2016, for example, publicised and shared presentations by industry experts, and an Open Data Parliamentary Showcase where non-governmental organisations, business, and start-ups share their work (LINZ Citation2016). By their nature, the consultation and showcase activities have been the types which foster rather than mandate connections – a non-prescriptive, organic approach to SDI community building.
The LINZ Property Management Framework is one such example where a set of standards and systems was developed with a high level of consultation. Through an iterative, proof of concept project, with frequent stakeholder consultation and feedback, the framework encompasses conceptual modelling, and class and relationship modelling for the practical implementation of a comprehensive land information database (LINZ Citation2015a). Designed as a cross-agency initiative, ‘the need for such a framework has been demonstrated in the [Canterbury] post-earthquake recovery process, with location-based information being a vital element of many activities’ (Citation2015b, p.9). The LINZ Property Management Framework is an example of an initiative with both technical and social systems focus. Such work can help to connect actors so as to build relationships and identify opportunities to work together, and as a means to reduce associated barriers and silos.
A research-based example is The Virtual Health Information Network (VHIN) (Citation2018). VHIN is a National Science Challenge research initiative seeking to increase capacity to use big data for health analysis through the IDI. As well as developing and showcasing methods using exemplars (Teng, Blakely, et al. Citation2017), sharing of knowledge about health data as well as analytical methods is strongly encouraged part of gaining access to datasets. Researchers see collaborative models such as the VHIN as improving both research productivity and the quality of research, ultimately providing a more robust evidence base for policy makers (Blakely et al. Citation2015).
Challenges and opportunities for DII and SDI in New Zealand
The examples discussed above have in common several purposes to developing more effective DII and SDI in New Zealand, namely increased data use, facilitating collaboration, security, and benchmarking and monitoring. These identified purposes help reveal the challenges and opportunities as described in the following.
Increasing data use: A common purpose of the federating and integrating platforms is to recognise the value of data by expanding usage. Such endeavours are primarily about linking multiple datasets in an effective and efficient way so that richer information can be gained, beyond a single dataset or type of data. Platforms such as the IDI, Canterbury Maps and Geodata seek to increase the use of data by providing a platform that makes data more visible and accessible.
Appetites for sharing data within some agencies is changing. For example, Christchurch City Council has developed a data platform to share datasets of individual-level property value, something which was previously accessed through a commercial agency and therefore relatively expensive to acquire. The desire for increased use comes from both data investors and from information seekers. On the other hand, we found that advocates for more open data talked about increased reticence for data sharing from those closest to the data – those who generate and manage it – who are concerned about data quality and standards, security and privacy. Thus, it is a challenge to reduce the concerns with data generators and managers to increasingly share data.
Facilitating collaboration: Platforms such as Statistics NZ’s Integrated Data Infrastructure (IDI) and policy initiatives such as Open Data seek to encourage collaboration through data sharing between otherwise siloed organisations and sectors. Within the Smart City initiatives, Scholl and Scholl (Citation2014) described shared information as the ‘kingpin’ to making smartness work. Without information, governments are restrained in how efficiently and effectively they can collaborate internally and externally. Sharing information between agencies is seen as a means of jointly and effectively solving shared problems, reducing overlaps and redundancy through more coordinated provision of services (Gil-Garcia & Sayogo Citation2016). That is, shared information through DII can offer value in how organisations operate and make the best use of constrained resources.
The challenge is, however, that participation in a collaboration requires parties to recognise and value the benefits of data sharing. Collaboration is a particular challenge when there is competition between parties. Data sharing might be seen as ‘giving away’ something that is ‘owned’ by a client or community. For example, a local authority may be reluctant to make data shareable because it is regarded as being paid for by ratepayers, with uncertainty as to whether the information benefit can be shared to non-ratepayers. Further, if a party sees no benefit to accessing more and/or different data, there will be little incentive for them to use external data, nor to take any necessary steps to make their data shareable. The NZGD data sharing platform is an example of collaboration happening within a commercial, competitive environment that provides tangible benefits to participants by expanding the data and technical expertise beyond their own capacity. That is, it is a combination of the technological platform and the social collaborative culture that has facilitated data sharing.
Security: For a number of platforms dealing with sensitive data, a key goal is to improve information use in a way that also maintains the privacy, confidentiality and security of data. For example, highly sensitive micro-data from the population census can be used within the secure data environment, whereas less sensitive aggregated census data can be readily downloaded by anyone.
Gaining and maintaining the social license to share sensitive data through linkage is recognised as a significant challenge for federating platforms (Teng, Milne, et al. Citation2017). It is required both to assure contributing agencies and to maintain public confidence in data custodians (Opus International Consultants Citation2015). DII can help by providing access to technical knowledge, for example, best practice for de-identifying sensitive data (Yang & Wu Citation2016), as well as developing exemplars of cases where assurance can be given that data has been used for public good as well as being kept secure. Commercial sensitivities also pose challenges to data sharing of data generated through commercial activities. Policies such as procurement models that support open data can help, if commissioning agencies are aware of the value of open data.
Benchmarking and monitoring: SDIs can make it easier to benchmark built environment changes and initiatives and to plan for sustainability, resilience and wellbeing. Environment Canterbury aids monitoring through Canterbury Maps by hosting data and information about environmental indicators and resilience in a publicly accessible way. Geodata is an example of a platform which has been set up to make transparent which datasets governments hold. All publicly funded data are registered on the platform, making them visible and accessible to users.
Improved monitoring through open data also helps improve public accountability and decision-making transparency (Johnston & Hansen Citation2011; Scholl & Scholl Citation2014). One outlet (and a significant driver) for the increasingly sophisticated data infrastructure has been the ‘smart’ city concept. At the heart of the concept is a recognition that the effective use of data can create feedback loops between decisions, actions, and reactions, providing decision-makers with insights and therefore increasing our intelligence about how built environments are operating and changing. Under initiatives such as Smart Cities and 100 Resilient Cities (Citation100 Resilient Cities), towns and cities are using data to become more highly interconnected by exploiting the existence of multiple data sources and integrating those into decision-making processes. Yet, data integration and collaboration across multiple stakeholders is challenging.
Discussion
What do the insights gained from a sociotechnical system lens mean for getting richer geospatial information to aid decision-makers? summarises three emerging themes, namely ‘agreement’, ‘shared value’ and ‘place’, and associated key challenges arising from our above discussion.
Figure 4. Emerging themes and associated challenges for improving digital information infrastructure in New Zealand.
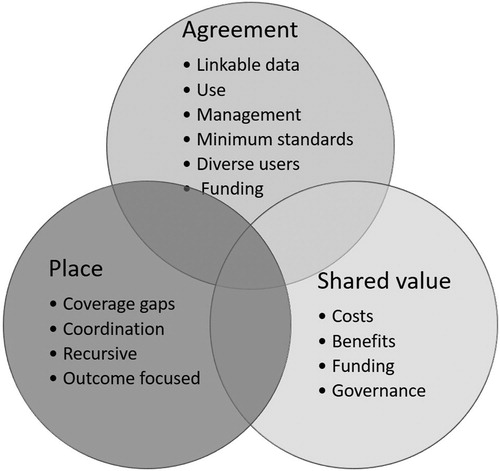
Firstly, agreement or at least consistency for how data is managed, shared and used needs to be reached across diverse data, users, stakeholders, and places. Agreements can include arrangements for the control over data use to preserve trust across stakeholders and protect sensitivity and confidentiality, and the social license to share data (Teng, Milne, et al. Citation2017). Any agreement between parties needs to recognise that both social and technical digital capability within organisations varies considerably. For some, the desired minimum standard might be ensuring records are digitised as PDF (Portable Document Format) to enable the development of searchable databases. For others, editable and re-usable data formats are key requirements. Different needs and priorities of different places, therefore, have to be accommodated within data infrastructures. Some smaller local council might gain more value from in-depth information from a small number of observations, while larger councils require a higher level of data coverage across the population for evidence-based decisions.
Shared benefits and costs between data users and data custodians
Secondly, infrastructure that enables sharing both the benefits and costs between information users and data custodians will help uptake. If custodians see the effort or risk of sharing data as greater than the information benefit they receive they will be less willing to fund new software or additional capacity to make their data compatible with other datasets (Yang & Wu Citation2016). For example, the secure nature of the IDI infrastructure increases the willingness for data sharing by agencies through reducing the risk of data misuse while providing a beneficial evidence-base from the in-depth cross-agency analysis. Other social barriers include governance barriers, such as a reluctance to share data that has been locally funded, or where procurement arrangements have meant the data is commercially sensitive.
Place as a powerful driver for richer information
Thirdly, an emphasis on place can be a powerful driver for richer information. Roche (Citation2016) argue for the smart city as being firstly spatial – through geospatial technology, cities function as ‘ … a network of places rather than … areal spaces’ (Roche Citation2016, p. 565). A focus on place leads to attention on the activities and functions of built environments and the role of information to increase resilience and quality of life, made more visible through citizen generated and used data as individuals actively engage in the social construction of their everyday environment. A ‘place’ focus also brings attention to the unevenness of information richness across urban environments and therefore inequalities of the ‘information overlay and digital representations’ (Robertson & Feick Citation2016). Constantinides and Barrett (Citation2014) raise the question of whose ‘good’ spatial information is and the potential for capture by technical, industry or social elites (Johnston & Hansen Citation2011). The place ‘lens’ on DII/SDI highlights the need for coordinating, guiding and monitoring the national framework.
Value stories to join platforms, technologies, practices and policies
Overall, our analysis has revealed that platforms, technologies, practices and policies all have a clear place in facilitating greater value from geospatial data. One way of bringing them together is through ‘value stories’ (Value Stories [Citationdate unknown]) that articulate persuasive value cases targeted to the concerns of data stakeholders and the benefits to New Zealand of a supportive and effective information infrastructure (Welch et al. Citation2016; Yang & Wu Citation2016; Schindler et al. Citation2018). These stories can identify and integrate the various perspectives and values stakeholders attach to geospatial information, and show how technical and social aspects of DII can contribute to a blanket of information that is both comprehensive and rich.
Conclusion and outlook
This paper has explored current developments towards digital information infrastructures in New Zealand and reviewed the challenges towards weaving a comprehensive infrastructure for geospatial data in New Zealand.
Current DII/SDI initiatives emerging in New Zealand are often ad hoc and largely uncoordinated. Ad hoc development can lead to poor trade-offs, whereas an overarching sociotechnical approach helps to weave platforms, technology, practice, and policy together. For instance, ad hoc developments result in a tendency towards technical solutions or platforms that are not utilised, fail to make the most of the full range of data, and are not addressing social barriers among stakeholders towards establishing a culture of data sharing (Schindler et al. Citation2018). Rather, information infrastructure, including funding mechanisms that address both technical and social dimensions are needed if we are to develop a supportive fabric of information across New Zealand. We argue that achieving higher value from geospatial; information requires a broad and systematic support for data sharing, articulated in persuasive stories with data custodians.
Key public and private sector stakeholders are initiating change within the sociotechnical system. Building upon the review provided in this paper, future work might explore the role played by critical parties within the system to maintain the momentum of change. What is the role of national agencies to facilitate uptake and further explore which spatial level of coordination might be most appropriate, for example, using training to grow positive data-sharing practices? And how can active community participation in data generation, management, and sharing about everyday places create a ‘bottom-up appetite’ for DII/SDI development in New Zealand?. Data about how and where we live our everyday lives is increasing exponentially in quantity, type and source. Viewing New Zealand’s information infrastructure through a sociotechnical lens suggests harnessing the abundance of data cannot be achieved through technology or policy, or national or community initiatives alone. Rather, getting higher value out of data requires finding ways to increase sharing; to share data, share benefits and costs, and to share and coordinate digital resources across our communities. Effective digital information infrastructure is vital if we are to harness the abundance of data to gain rich, high-value information to help us develop and manage our built environments.
Disclosure statement
No potential conflict of interest was reported by the authors.
ORCID
Vivienne C. Ivory http://orcid.org/0000-0001-6038-2395
Additional information
Funding
References
- 100 Resilient Cities. 2018. 100 Resilient Cities [Internet]; [accessed 2018 May 15]. https://www.100resilientcities.org/.
- ACILTasman. 2009. Spatial information in the New Zealand economy. Realising productivity gains. Wellington: LINZ.
- Bernknopf R, Shapiro C. 2015. Economic assessment of the use value of geospatial information. ISPRS International Journal of Geo-Information. 4:1142–1165. doi: 10.3390/ijgi4031142
- Blakely T, Atkinson J, Kvizhinadze G, Nghiem N, McLeod H, Davies A, Wilson N. 2015. Updated New Zealand health system cost estimates from health events by sex, age and proximity to death: further improvements in the age of ‘big data.’ New Zealand Medical Journal. 128:13–23.
- Blakely T, Salmond C, Woodward A. 1999. Anonymous record linkage of 1991 census records and 1991-94 mortality records. [Internet]. Wellington: Department of Public Health, Wellington School of Medicine, University of Otago; [accessed 2018 Jan 22]. http://www.otago.ac.nz/wellington/departments/publichealth/research/hirp/otago023986.html.
- Bowker GC, Baker K, Millerand F, Ribes D. 2009. Toward information infrastructure studies: ways of knowing in a networked environment. In: Hunsinger J, Klastrup L, Allen M, editors. International handbook of Internet Research. Dordrecht: Springer; p. 97–117.
- Bureau of Communications Research. 2016. Open government data and why it matters: a critical review of studies on the economic impact of open government data. [place unknown]: Australian Government; Department of Communications and the Arts.
- Canterbury Maps. [date unknown]. [accessed 2018 Oct 15]. https://canterburymaps.govt.nz/.
- Chan TO, Williamson I. 1999. Spatial data infrastructure management: lessons from corporate GIS development.
- Constantinides P, Barrett M. 2014. Information infrastructure development and governance as collective action. Information Systems Research. 26:40–56. doi: 10.1287/isre.2014.0542
- Damian DE, Zowghi D. 2003. Requirements engineering challenges in multi-site software development organisations. Requirements Engineering. 8:149–160. doi: 10.1007/s00766-003-0173-1
- Ferriss S, Erasmuson M. 2016. The Canterbury earthquake recovery authority spatial data infrastructure: A model for government information and communications technology delivery. Wellington: Canterbury Earthquake Recovery Authority.
- Frohlich KL, Corin E, Potvin L. 2001. A theoretical proposal for the relationship between context and disease. Sociology of Health & Illness. 23:776–797. doi: 10.1111/1467-9566.00275
- Giff G, Coleman D. 2002. Funding models for SDI implementation: From local to global. In: Proc GSDI6 Conf SDI. [place unknown].
- Gil-Garcia JR, Sayogo DS. 2016. Government inter-organizational information sharing initiatives: understanding the main determinants of success. Government Information Quarterly. 33:572–582. doi: 10.1016/j.giq.2016.01.006
- Graham SR, Carlton C, Gaede D, Jamison B. 2011. The benefits of using geographic information systems as a community assessment tool. Public Health Reports. 126:298–303. doi: 10.1177/003335491112600224
- Hall P. 2005. Interprofessional teamwork: professional cultures as barriers. Journal of Interprofessional Care. 19:188–196. doi: 10.1080/13561820500081745
- Henderson JV. 1986. Efficiency of resource usage and city size. Journal of Urban Economics. 19:47–70. doi: 10.1016/0094-1190(86)90030-6
- Hendriks PH, Dessers E, Van Hootegem G. 2012. Reconsidering the definition of a spatial data infrastructure. International Journal of Geographical Information Science. 26:1479–1494. doi: 10.1080/13658816.2011.639301
- Ivory VC, Russell M, Witten K, Hooper CM, Pearce J, Blakely T. 2015. What shape is your neighbourhood? investigating the micro geographies of physical activity. Social Science & Medicine. 133:313–321. doi: 10.1016/j.socscimed.2014.11.041
- Johnston EW, Hansen DL. 2011. Design lessons for smart governance infrastructures. In: Ink, Balutis A, Buss T, editors. Transform American Governance: rebooting the public Square. [place unknown]: National Academy of Public Administration; p. 197–212.
- Jonientz-Trisler C, Simmons RS, Yanagi BS, Crawford GL, Darienzo M, Eisner RK, Petty E, Priest GR. 2005. Planning for tsunami-resilient communities. In: Bernard EN, editor. Developing tsunami-resilient communities. Dordrecht: Springer; p. 121–139.
- Kaisler S, Armour F, Espinosa JA, Money W. 2013. Big data: issues and challenges moving forward. In: 2013 46th Hawaii International conference on system sciences HICSS. [place unknown]: IEEE; p. 995–1004.
- Koordinates. 2018. Koordinates [Internet]; [accessed 2018 Oct 15]. https://koordinates.com/.
- LINZ. 2010. Capturing economic benefits from location-based information. Wellington: New Zealand Government; Land Information New Zealand.
- LINZ. 2011. Spatial data infrastructure cookbook. Wellington: New Zealand Government; Land Information New Zealand.
- LINZ. 2012. New Zealand SDI state of play report 2012: 2012 NZSDI benchmark exercise. Wellington: New Zealand Government; Land Information New Zealand.
- LINZ. 2015a. Property data management framework for LINZ-Canterbury spatial data infrastructure: framework and data model report. Wellington: New Zealand Government; Land Information New Zealand.
- LINZ. 2015b. Property data management framework for LINZ-Canterbury spatial data infrastructure: framework and data model report. Wellington: New Zealand Government; Land Information New Zealand.
- LINZ. 2016. Overview of open data NZ’s work in 2016. Wellington: New Zealand Government; Land Information New Zealand.
- Loenen B. 2006. Developing geographic information infrastructures: the role of information policies. [place unknown]: IOS Press.
- McLaughlin J, Nichols S. 1994. Developing a national spatial data infrastructure. Journal of Surveying Engineering. 120:62–76. doi: 10.1061/(ASCE)0733-9453(1994)120:2(62)
- Ministry for Business, Innovation & Employment. 2018. New Zealand Geotechnical Database. NZGD [Internet]; [accessedd 2018 Jan 15]. https://www.nzgd.org.nz/HelpSupport/AboutNZGD.pdf.
- Mora K, Chang J, Beatson A, Morahan C. 2015. Public perceptions of building seismic safety following the Canterbury earthquakes: a qualitative analysis using twitter and focus groups. International Journal of Disaster Risk Reduction. 13:1–9. doi: 10.1016/j.ijdrr.2015.03.008
- Musa GJ, Chiang P-H, Sylk T, Bavley R, Keating W, Lakew B, Tsou H-C, Hoven CW. 2013. Use of GIS mapping as a public health tool – from cholera to cancer. Health Services Insights. 6:111–116. doi: 10.4137/HSI.S10471
- My Waikato. 2018. Waikato Reg Counc [Internet]; [accessed 2018 Jan 11]. https://www.waikatoregion.govt.nz/community/your-community/my-waikato/.
- NAO. 2012. Geographic information strategy: department for environment, food and rural affairs. Great Britain: National Audit Office UK.
- Nextspace, Auckland Council. 2018. Digital Auckland. Nextspace Digit Auckl [Internet]. [accessed 2018 Oct 15]. http://www.nextspace.co.nz/case-studies/digital-auckland.
- Niazi M, Babar MA, Verner JM. 2010. Software process improvement barriers: A cross-cultural comparison. Information and Software Technology. 52:1204–1216. doi: 10.1016/j.infsof.2010.06.005
- NRC. 2012. Advancing Strategic Science: A Spatial Data Infrastructure Roadmap for the U.S. Geological Survey [Internet]. Washington, DC: National Research Council, The National Academies Press; [accessed 2018 Feb 14]. https://www.nap.edu/catalog/13506/advancing-strategic-science-a-spatial-data-infrastructure-roadmap-for-the.
- Nykiforuk CIJ, Flaman LM. 2011. Geographic information systems (GIS) for health promotion and public health: a review. Health Promotion Practice. 12:63–73. doi: 10.1177/1524839909334624
- Oertig M, Buergi T. 2006. The challenges of managing cross-cultural virtual project teams. Team Performance Management: An International Journal. 12:23–30. doi: 10.1108/13527590610652774
- Opus International Consultants. 2015. Public attitudes to data integration: report prepared for statistics New Zealand [internet]. Wellington: Statistics New Zealand. www.stats.govt.nz.
- Phillips D, Watson L, Willis M. 2011. Benefits of comprehensive integrated reporting: by standardizing disparate information sources, financial executive can eliminate the narrow perspectives of the elephant and the blind man parable – and “see” beyond merely information silos or reports. Finance Executive. 27:26–31.
- Rajabifard A. 2008. A spatial data infrastructure for a spatially enabled government and society. In: Crompvoets J, Rajabifard A, van Loenen B, Delgado Fernandez T, editors. A Multi-view framework to assess SDIs. Melbourne: Wageningen University & University of Melbourne; p. 11–22.
- Rajabifard A, Williamson IP. 2001. Spatial data infrastructures: concept, SDI hierarchy and future directions. In Proceedings, of GEOMATICS'80 Conference, Tehran, Iran.
- Robertson C, Feick R. 2016. Bumps and bruises in the digital skins of cities: unevenly distributed user-generated content across US urban areas. Cartography and Geographic Information Science. 43:283–300. doi: 10.1080/15230406.2015.1088801
- Roche S. 2016. Geographic information science II: less space, more places in smart cities. Progress in Human Geography. 40:565–573. doi: 10.1177/0309132515586296
- Roche S, Rajabifard A. 2012. Sensing places’ life to make city smarter. In: Proceedings of the ACM SIGKDD International workshop urban computing. [place unknown]: ACM; p. 41–46.
- Rydin Y, Bleahu A, Davies M, Dávila JD, Friel S, De Grandis G, Groce N, Hallal PC, Hamilton I, Howden-Chapman P. 2012. Shaping cities for health: complexity and the planning of urban environments in the 21st century. Lancet. 379:2079. doi: 10.1016/S0140-6736(12)60435-8
- SaferMe. 2018. Mobilizing hazard data to make people safer. SaferMe [Internet]; [accessed 2018 Oct 15]. https://www.safer.me/.
- Sawyer S, Jarrahi MH. 2014. Sociotechnical approaches to the study of information systems. In: Topi H, Tucker A, editors. Computing handbook set. 3rd ed. Vol 2, Part 5. Florida: Chapman and Hall/ CRC; p. 1–27.
- Schindler M, Dionisio R, Kingham S. 2018. A multi-level perspective of a spatial data ecosystem: needs and challenges among urban planning stakeholders in New Zealand. International Journal of Spatial Data Infrastructures Research [Internet]. [accessed 2018 May 15]; 13. http://ijsdir.jrc.ec.europa.eu/index.php/ijsdir/article/view/480.
- Scholl HJ, Scholl MC. 2014. Smart governance: a roadmap for research and practice. In: IConference 2014 Proceedings. [place unknown]; p. 163–176.
- SSC. 2016. Open Government Partnership: New Zealand Action Plan 2014-2016. State Serv Comm Website.
- Statistics New Zealand. 2017. How the IDI and LBD work. IDI LBD Work [Internet]; [accessed 2017 Dec 18]. http://www.stats.govt.nz/browse_for_stats/snapshots-of-nz/integrated-data-infrastructure/idi-how-it-works.aspx.
- Statistics New Zealand. 2018. DataHub Table Viewer [Internet]; [accessed 2018 Oct 15]. http://nzdotstat.stats.govt.nz/wbos/Index.aspx.
- Steiniger S, Hunter AJ. 2012. Free and open source GIS software for building a spatial data infrastructure. Geospatial Free Open Source Software 21st Century. 247–261.
- Teng AM, Blakely T, Ivory V, Kingham S, Cameron V. 2017. Living in areas with different levels of earthquake damage and association with risk of cardiovascular disease: a cohort-linkage study. Lancet Planetary Health. 1:e242–e253.
- Teng AM, Milne B, Walker P, Blakely T. 2017. Open data, transparency and power – role of the Virtual Health Information Network – Public Health Expert, University of Otago, New Zealand. Public Health Expert [Internet]; [accessed 2017 Dec 12]. https://blogs.otago.ac.nz/pubhealthexpert/2017/06/14/open-data-transparency-and-power-role-of-the-virtual-health-information-network/.
- Value Stories. [date unknown]. Open Data Handb [Internet]; [accessed 2018 Apr 2]. http://opendatahandbook.org/value-stories/en/.
- Villagra P, Rojas C, Ohno R, Xue M, Gómez K. 2014. A GIS-base exploration of the relationships between open space systems and urban form for the adaptive capacity of cities after an earthquake: the cases of two Chilean cities. Applied Geography. 48:64–78. doi: 10.1016/j.apgeog.2014.01.010
- Virtual Health Information Network. 2018. [cited 2018 Jan 22]. https://vhin.co.nz/.
- Welch EW, Feeney MK, Park CH. 2016. Determinants of data sharing in U.S. city governments. Government Information Quarterly. 33:393–403. doi: 10.1016/j.giq.2016.07.002
- Yang T-M, Wu Y-J. 2016. Examining the socio-technical determinants influencing government agencies’ open data publication: a study in Taiwan. Government Information Quarterly. 33:378–392. doi: 10.1016/j.giq.2016.05.003