
 ?Mathematical formulae have been encoded as MathML and are displayed in this HTML version using MathJax in order to improve their display. Uncheck the box to turn MathJax off. This feature requires Javascript. Click on a formula to zoom.
ABSTRACT
Within NZ gambling and its associated harms are well-researched topics. However, most studies to date have relied upon the use of survey methodology or have focused on individual regions. In this paper we distribute gaming machine proceeds (GMP) from gaming venues to the surrounding localities in order to derive estimates of GMP per capita. It is hoped these estimates will enable the trusts who operate the electronic gaming machines (EGMs), and who are responsible for reinvesting a proportion of proceeds back into the community, to more accurately target funding towards the areas most affected by the harms of EGM gambling. Our estimates of GMP per capita also provide a means of assessing the criterion validity of the recently developed Dynamic Deprivation Index. Furthermore, although it is well known that Māori and Pacific Island populations have a higher incidence of problem gambling, our results imply that when controlling for socio-economic deprivation and the geographic location of EGMs the associations between ethnicity and GMP per capita are weak. From a policy perspective, this suggests the most effective way of limiting the harms of EGM gambling on these populations is to place tighter controls on the number of venues within their communities.
1. Introduction
New Zealand has one of the highest per capita expenditures on gambling in the developed world (The Economist Citation2014). According to the Department of Internal Affairs (DIA Citation2018b), during 2017 New Zealanders lost a total of $883 million on Electronic Gaming Machines (EGMs). EGM gambling is estimated to constitute around 40% of New Zealand’s total gambling expenditure (Abbott Citation2017) and has frequently been identified as being one of the most harmful forms of gambling (Binde Citation2011; Binde et al. Citation2017), being both highly addictive (Livingstone Citation2017) and providing the fewest positive externalities to the wider economy. A study by the Ministry of Health (Citation2008a) found that playing EGMs was associated with poorer self-reported mental and physical health, poorer relationships with family and friends, poorer child rearing and lower overall quality of life. Within the aforementioned study, individuals who played EGMs were found to be significantly more likely to have engaged in illegal activities (predominantly stealing and fraud), whilst 25% of the individuals who admitted committing such crimes stated that they would not have done so had they not gambled within the past 12 months. Indeed, half of all individuals receiving gambling intervention services in 2015/16 identified non-casino EGMs as a primary gambling mode (Ministry of Health Citation2018). It is for reasons such as these that EGMs have been coined the ‘crack cocaine’ of gambling (Dowling et al. Citation2005).
Gambling and gambling-related harm are well-researched topics within New Zealand. Indeed, New Zealand is unique in the sense that it has a series of five-yearly national gambling participation and attitude surveys dating back to the mid-1980s (DIA Citation2007). National surveys focusing more specifically on the incidence of problem gambling were conducted in 1990 (Abbott and Volberg Citation1991, Citation1996) and 1999 (Abbott and Volberg Citation2000), with a current longitudinal study in operation between 2012 and 2019 (Abbott et al. Citation2014, Citation2015). In addition, national and local governments have frequently facilitated studies investigating the social harms of gambling within their particular jurisdictions (e.g. Rankine and Haigh Citation2003; Adams Citation2004; Ministry of Health Citation2018; Tauranga City Council Citation2018). For a comprehensive overview of the history of gambling research within New Zealand the reader is directed to Abbott (Citation2017).
However, a fundamental limitation of the existing body of research within the New Zealand context is that the majority of studies to date have either been constructed using surveyed samples of the population, have relied upon the use of individual self-reporting and face-to-face interviews or have focused only on individual cities or territorial authorities. In this paper we use a novel approach to examine EGM gambling across the whole of New Zealand in such a way that does not incur any of the previously mentioned methodological limitations. In essence, we distribute gaming machine proceeds (GMP) from electronic gaming venues (EGVs) to the surrounding localities using an inverse Huff model in order to obtain estimates of GMP per capita at a meshblock and area unit (AU) level. We create estimates of GMP per capita at the AU level each month from Mar13 to Mar18, whereas our estimates of GMP per capita at the meshblock level are restricted to the quarter ending Mar13 for reasons that will become apparent. Given that New Zealand is one of only a few countries in the world to operate a ‘community based’ model, whereby the trusts that own the EGMs are required by law to reinvest 40% of all GMP back into the community in the form of grants (New Zealand Community Trust Citation2018), our primary aim in constructing the aforementioned AU level estimates of GMP per capita is to provide a means for these trusts to target funding towards the areas most affected by the harms of EGM gambling.
The Huff model (Huff Citation1964) is a well-established method in spatial analytics. Typically used to estimate the catchment zones of retail outlets, the basic formulation of the Huff model (often referred to as a gravity model) is given by the equation:Here Pi,j represents the probability that a customer from region j interacts with venue i, Ai is the attractiveness of venue i, di,j is a measure of the distance from venue i to region j and α is a positive parameter which can be modified to prioritise attractiveness over distance (or vice versa). The intuition underlying the Huff model is that the probability that a particular customer interacts with a particular venue is a function of the attractiveness and distance of the venue relative to the attractiveness and distance of other competing venues. Although the Huff model has been in use for over five decades it is still considered to be the best tool for estimating the catchment zones of venues when used in conjunction with contemporary Geographic Information Systems (GIS) (Huff and McCallum Citation2008).
Despite its longevity and widespread use to inform policy (Mátyás Citation1998), particularly within the context of healthcare (Guagliardo Citation2004), up until the last decade applications of Huff models within the gambling literature were rare (Robitaille and Herjean Citation2008). Since then considerable progress has been made in this regard. Doran and Young (Citation2010) used a Huff model to predict the spatial distribution of EGV catchment zones in a metropolitan region of Australia’s Northern Territory. This methodology was subsequently replicated by Rintoul et al. (Citation2013) to analyse catchment zones in the city of Melbourne and used to show that gambling expenditure was positively associated with both EGM accessibility and increased levels of socio-economic disadvantage. At a national level Markham et al. (Citation2014b) employed a Huff model to estimate the catchment zones of Australian casinos. The same authors also sought to calibrate the model of Doran and Young (Citation2010) by comparing its predictions to empirically observed results (Markham et al. Citation2014a). This was achieved by tuning the parameters of the Huff model to the results of a postal survey indicating which EGM venues respondents had visited in the previous month. In doing so it was demonstrated that venue catchment zones differ not only by venue but also by sub-group of visitors. Indeed, this latter finding complimented earlier results from Young et al. (Citation2012) who had shown that EGM gamblers and problem gamblers are more likely to visit venues closer to their homes than non-gamblers and non-problem gamblers. In the context of the current paper, we seek to distribute GMP from all EGM venues across New Zealand to the surrounding localities using an inverse Huff model. In the absence of empirical data describing both the address of EGV patrons and the venues they frequent we tune the parameters of our Huff model using an exogenous variable, namely socio-economic deprivation levels.
It is well understood that the harms caused by EGM gambling are not distributed uniformly across socio-economic groupings. Both within Australia and New Zealand there is considerable evidence that EGVs are more likely to be located within more highly deprived areas (Marshall and Baker Citation2002; Ministry of Health Citation2005; Wheeler et al Citation2006). Consequently, it is not surprising that a plethora of studies have found a positive association between increased levels of socio-economic deprivation and increased levels of EGM gambling and its associated harms (Rintoul et al. Citation2013; Ministry of Health Citation2015, Citation2018). The standard measures of (relative) socio-economic deprivation within New Zealand are the NZDEP studies constructed by Crampton et al. (Citation1998a, Citation1998b, Citation2002, Citation2007, Citation2014). However, being constructed from census data these studies are only able to provide a snapshot of the distribution of socio-economic deprivation across the country at five-year intervals or more. The latest study, NZDEP13, was constructed using data from the March 2013 New Zealand Census. Recently, a more contemporaneous measure of socio-economic deprivation has been developed. The Dynamic Deprivation Index™ (DDI) (see Ward et al. Citation2019), constructed by researchers at data science company DOT Loves Data (DOT), assigns a deprivation score and deprivation index to each AU in New Zealand each month from Mar13 onwards. However, evaluating the criterion validity of the DDI, i.e. determining how well it predicts other variables known to be associated to socio-economic deprivation, is challenging given that there are very few current enough, publicly available data sets which can be used in this regard. The AU GMP per capita estimates produced in this paper provide a notable exception. That is to say that by comparing the association between GMP per capita and socio-economic deprivation as measured by the NZEP13 study in Mar13 to the association between GMP per capita and socio-economic deprivation as measured by the DDI in all subsequent months, we are able to provide a degree of criterion validity for the DDI. This is the secondary aim of the current paper.
Just as the harms of EGM gambling are not distributed uniformly across socio-economic groups neither are those harms distributed uniformly across the various ethnicities within New Zealand. As Abbott (Citation2017) puts it:
In all New Zealand problem gambling surveys … Māori and Pacific people have substantially higher prevalence rates (of problem gambling) than other New Zealanders … Most of the high risk groups live disproportionately in neighbourhoods that, in addition to being deprived, contain high concentrations of EGMs.
2. Materials and methods
2.1 Meshblocks and AUs
Meshblocks are contiguous geographical units defined by Statistics New Zealand and are the smallest geographic unit for which statistical data is publicly reported. Each meshblock borders another to form a network covering all of New Zealand’s land mass and 200 mile exclusive economic zone. Although meshblocks can vary in size considerably in rural areas, in urban areas meshblocks usually coincide with streets or city blocks. AUs are aggregations of meshblocks which in urban areas generally coincide with suburbs or parts thereof. At the time of the 2013 New Zealand Census, the median usually resident meshblock and AU populations were 78 people and 1985 people respectively. The geographic regions defined by meshblocks and AUs are updated by Statistics New Zealand on the 1st of January every year. The meshblock and AU geographies (QGIS maps) and concordance with geographies for previous years can be found on the Statistics New Zealand website (Citation2018a, Citation2018b). We take this opportunity to stress that, from the perspective of the current investigation, the difference between the 2013 and 2017AU boundaries is negligible (see Ward et al. Citation2019 for further details).
Using the aforementioned geographic boundary files, DOT obtained the geo-coordinates of each of the 45,989 inland 2013 meshblock centroids by utilising the QGIS ‘Polygon Centroid’ geometry tool. Meshblock centroids are effectively the centre of mass for the meshblock polygon, such that if some flat substance of uniform thickness were cut into the shape of the meshblock polygon, then the shape would balance at the point of the centroid.
2.2 Meshblock and AU adult population estimates
Within New Zealand an individual must be at least 18 years of age in order to legally play EGMs. To ease the exposition, throughout the remainder of this paper we refer to the population aged 18 years old or above as the adult population.
In order to estimate the adult population of each 2013 meshblock as of Mar13, DOT used publicly available data from the March 2013 New Zealand Census (Statistics New Zealand Citation2013). The aforementioned data set details the number of usually resident individuals living within each meshblock and the number of usually resident individuals living within each meshblock by pre-defined age category. For reasons of privacy and confidentiality, when the total population of a meshblock is small the associated age data is suppressed. For all meshblocks where age data was available, DOT simply multiplied the population in the 15–19 age group by a factor of 2/5 and added the result to the populations of all older age groups. For all meshblocks for which age data had been suppressed, a different approach was used. Nationally, it was found that approximately 76% of the usually resident population of New Zealand were aged 18 or over. As such, for meshblocks where age data was not available, DOT simply estimated the adult population to be 76% of the usually resident meshblock population. Using the same data set, DOT also estimated the proportion of each meshblock identifying as European, Māori, Pacific Island and Asian.
Next, for each month from Mar13 to Mar18, DOT constructed estimates of the usually resident adult population of each 2017AU in the following way. The medium usually resident population projections constructed by Statistics New Zealand (Citation2018c) provide estimates of the population of each AU as of the 30th June 2013 and as of the 30th of June 2018. These projections can be broken down by age group to provide estimates of the population aged under 15, 15–39, 40–64 and above 64. By discarding the under 15 age group, multiplying the population aged 15–39 by a factor of 22/25 and adding this to the populations of the remaining age groups, DOT obtained estimates of the adult population of each AU for Jun13 and Jun18. By linearly interpolating by month, DOT transformed these values into monthly estimates of the adult population level of each 2017AU.
2.3 Measures of socio-economic deprivation
Within New Zealand, the standard measures of relative socio-economic deprivation are the NZDEP studies constructed by Crampton et al. (Citation1998a, Citation1998b, Citation2002, Citation2007, Citation2014). Using census data from the corresponding year these studies assign a deprivation score to each populated meshblock within New Zealand. A deprivation score for each AU is then calculated (essentially) as a population-weighted average of the associated meshblock deprivation scores. Meshblocks and AUs are then ranked separately into deciles (known as deprivation indices) on the basis of their score. Conceptually, the higher the deprivation score and index assigned to a meshblock or AU the higher the level of socio-economic deprivation endured by its inhabitants. The most recent of these studies, NZDEP13 (Crampton et al. Citation2014), is constructed using data from the March 2013 New Zealand Census.
The NZDEP studies are extremely rigorous, high-quality research outputs and are widely used in government funding formulas and by social policy analysts. However, being constructed from census data they are only able to provide a snapshot of the distribution of socio-economic deprivation across New Zealand at five-year intervals or more. As such, a more contemporaneous measure of the distribution of relative socio-economic deprivation across New Zealand is provided by the Dynamic Deprivation Index™ (DDI). The DDI uses a combination of publicly available and commercially purchased data sets to assign a deprivation score and decile to each 2017AU each month from Mar13 onwards. The data sets that form the structural basis of the DDI cover variables such as Job Seeker Support claimants (employment), Means-Tested Benefit claimants (income), Single Parent Support claimants (support), Educational Attainment levels (education) and consumer spending patterns (material deprivation). Indeed, the DDI is seeded by the NZDEP13 study in the sense that the deprivation scores and deciles assigned to each AU in Mar13 by the DDI coincide exactly with the deprivation scores and deciles associated to each AU in the NZDEP13 study. For further information on the methodology and construction of the DDI see Ward et al. (Citation2019).
2.4 Geographic location of EGVs
Each quarter the Department of Internal Affairs (DIA) publishes data detailing the name, street address and containing territorial authority of all non-casino EGVs operating in the preceding three month period (DIA Citation2018a). This data set also details the number of EGMs present at each venue. For ease of reference we will subsequently refer to this data set as Report A1. Over the period from Mar13 to Mar18 there were a total of 1427 distinct EGVs in operation across New Zealand. Using the street address fields provided in Report A1, two independent researchers geo-coded the location of each EGV. Where the calculated geo-locations differed by more than 50 m, the addresses were geo-coded manually for a third time using a combination of Google Maps and Google Street view. Once the geo-coordinates of each EGV had been determined, DOT subsequently calculated the geodetic distance between each of the 1427 EGVs and each of the 45,989 inland 2013 meshblock centroids. This procedure is computationally intensive as it involves the calculation of over 65 million geodetic distances. However, once this had been achieved this enabled DOT to determine the number of EGVs within a given radius of each meshblock centroid and the distance between each centroid and the nearest EGV.
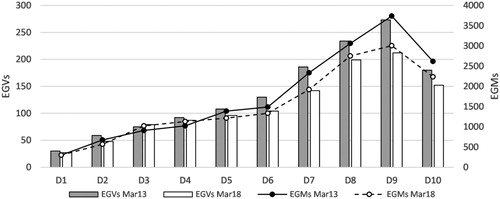
below shows the distribution of EGVs and EGMs by deprivation decile as of Mar13 and Mar18 as measured by the DDI. It is evident that EGVs and EGMs are more likely to be located in more highly deprived area units and that the quantity of both have decreased over the aforementioned period.
Figure 1. Distribution of EGVs and EGMs by DDI deprivation decile.
2.5 GMP data and venue level GMP estimates
Each quarter the DIA also publishes data detailing non-casino GMP (DIA Citation2018b). For the purposes of the current investigation this data set contains two reports of interest.
Report B1 – EGMs and GMP at suburb level.
This document lists the number of EGVs, the combined number of EGMs and combined GMP within each suburb in New Zealand. Herein suburbs are referred to as clusters and bear only a loose relation to AU geographies.
Report B2 – List of venues per cluster.
This document details the name and venue number of each EGV as well as the territorial authority and cluster to which it belongs.
For each quarter from Mar13 to Mar18 DOT matched the data in Reports A1, B1 and B2 together in order to obtain estimates of the level of GMP at each venue in the following way. If, in a particular quarter, a venue was known to contain ten EGMs and within the corresponding cluster the combined number of EGMs was equal to one hundred, then 10% of cluster GMP would be assigned to that venue.
For reasons of privacy and security, the DIA makes it deliberately difficult to match the aforementioned reports in the manner described above. First, venue numbers (unique identifiers) are only provided in Report B2. Furthermore, whilst in Report B2 the containing territorial authority and cluster of each venue are reported, in Report A1 only the containing territorial authority is provided. This frequently causes matching issues when venues within the same territorial authority have the same name. Nevertheless, for each quarter, DOT managed to match the reports in such a way that summing up venue level GMP by cluster yields exactly the same results as those stated within Report B1.
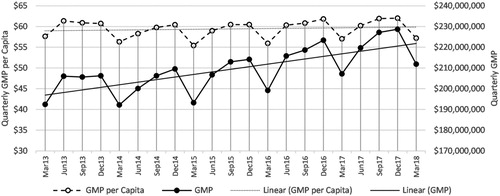
below shows that whilst nominal GMP within New Zealand has been increasing over the period from Mar13 to Mar18, GMP per capita has largely remained constant. Since we have made no attempts to counteract the effects of inflation within our analysis, this suggests that across New Zealand GMP per capita has been decreasing in real terms.
Figure 2. Quarterly nominal GMP and GMP per capita across New Zealand: Mar13–Mar18.
2.6 Construction of GMP per capita estimates
DOT took the GMP per venue estimates described in the previous section for Mar13 and distributed these values to the surrounding 2013 meshblocks whose centroids lay within a λ km radius of the venue using an inverse Huff model similar to that employed by Doran and Young (Citation2010), Rintoul et al. (Citation2013) and Markham et al. (Citation2014a). The specific form of the model used is stated below.Here
is the value of GMP assigned from venue i to meshblock j,
is the estimated value of GMP at venue i,
is the geodetic distance from venue i to the centroid of meshblock j,
is the Mar13 adult population of meshblock j, α is a positive parameter describing the extent to which population is prioritised over distance (or vice versa) in the distribution process and the relevant summation is taken over all meshblocks whose centroid lies within a λ km radius of venue i. Once the distribution process had been conducted for each EGV, DOT then summed up the result to a 2013 meshblock level and obtained estimates of GMP per capita for each meshblock by dividing the nominal GMP values by the corresponding Mar13 adult population estimates described in Section 2.2. Finally, DOT took the 2013 meshblock GMP per capita estimates and correlated these against the meshblock level NZDEP13 scores.
The above procedure was repeated for different values of the distance threshold λ and the parameter α, with the resulting correlation between meshblock GMP per capita and meshblock deprivation scores recorded at each iteration. below shows the outcome of this process and indicates that the combination of λ and α parameters that gave the strongest correlation (0.3208) between meshblock GMP per capita and meshblock level NZDEP13 scores were λ = 5 and α = 0.50. As such, DOT used this parameter combination to create our final estimates of meshblock GMP per capita as of Mar13.
Table 1. Pearson correlation between meshblock NZDEP13 scores and 2013 meshblock GMP per capita (Mar13).
Each quarter from Mar13 to Mar18, DOT assigned a level of GMP to each 2017AU in the following way. First, DOT distributed GMP from venues to the surrounding 2013 meshblocks using the Huff model described above and the optimal parameter combination (λ = 5, α = 0.5). DOT then summed up the result to a 2017AU level using the Statistics New Zealand (Citation2018b) geographic area correspondence file. Quarterly AU GMP values were then divided by a factor of three in order to obtain monthly GMP values and then divided by the corresponding monthly AU adult population estimates to arrive at monthly estimates of AU GMP per capita. Finally, for each month from Mar13 to Mar18 DOT calculated the degree of correlation between the AU GMP per capita estimates and the corresponding DDI deprivation scores. The results of this process are shown in Section 3.2.
2.7 Median personal income
Using publicly available data from the 2013 New Zealand Census (Statistics New Zealand Citation2013), DOT constructed estimates of the median personal income (hereafter referred to as median income) within each 2013 meshblock as of Mar13. In the first instance, the aforementioned data set contains estimates of the median income for 42,216 (92%) of the 45,989 inland 2013 meshblocks. However, the median incomes of the remaining 3773 meshblocks were either suppressed for privacy reasons or could not be calculated. In these instances DOT estimated the median income for the meshblock as the median income for the AU in which it was located. In the case of 87 meshblocks, this process failed as the corresponding AU median income values had also been suppressed. As such, these meshblocks were assigned the national median income level.
2.8 Data Analysis
Using the data sources and methodology described in the previous sections, DOT constructed a data set which, for 43,689 (95%) of the 45,989 inland 2013 meshblocks, detailed GMP per capita (dependent variable) and the following independent variables:
NZDEP13 meshblock deprivation score (Deprivation).
Number of EGVs in a 5 km radius of meshblock centroid (EGV Density).
Distance from meshblock centroid to nearest EGV (EGV Proximity).
Median personal income (Income)
Proportion of meshblock population identifying as European, Māori, Pacific Island and Asian (Ethnicity).
DOT correlated each of the independent variables with the dependent variable, and also with each other, in order to identify possible sources of multicollinearity. The resultant correlation matrix produced is provided in below.
Table 2. Pearson correlation matrix for dependent and independent variables.
DOT used stepwise regression to determine that each of the aforementioned independent variables were statistically significant predictors of meshblock GMP per capita (i.e. the F-statistic when stepping each independent variable into the model was always significant at the p < 0.0001 level). However, due to the high levels of multicollinearity evident in , DOT was forced to restrict its analysis to constructing three linear regression models of the form:
Model 1:
GMP per Capita = f(Deprivation, EGV Density, EGV Proximity, Income, %Euro, %Māori, %Pacific, %Asian);
Model 2:
GMP per Capita = f(Deprivation, EGV Density, EGV Proximity, Income, %Māori);
Model 3:
GMP per Capita = f(EGV Density, EGV Proximity, Income, %Māori | Deprivation);
3. Results
3.1 AU GMP per capita estimates
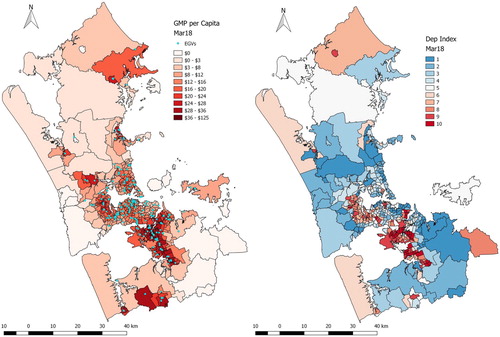
The quantitative estimates of monthly AU GMP per capita levels derived within this paper may be made available to researchers and policy analysts upon request. In this regard, the left hand panel of below shows a heat map of AU GMP per capita as of Mar18 within the Auckland Territorial Authority. The location of EGVs are overlaid as blue dots. The right-hand panel of shows the deprivation indices of the Auckland AUs as measured by the DDI in Mar18. We see that GMP per capita levels are highest in the highly socio-economically deprived South Auckland region. This is partly the result of the high concentration of EGVs within this locality and partly the result of high GMP spend at the relevant venues. Maps showing the distribution of GMP per capita across AUs in other major New Zealand territorial authorities are available as supplementary material.
Figure 3. GMP per capita map (including location of EGVs) and Dynamic Deprivation Index map of Auckland as of Mar18.
3.2 The temporal association between AU GMP per capita and socio-economic deprivation
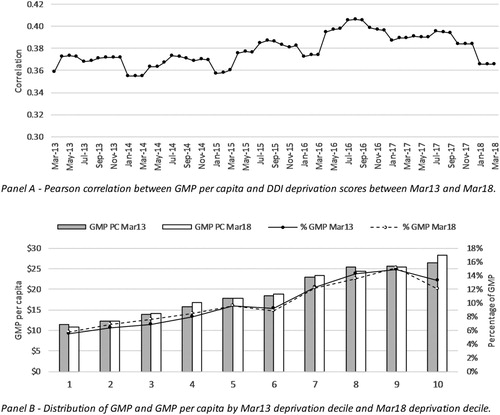
Panel A of below shows the correlation between AU GMP per capita and DDI deprivation score for each month from Mar13 to Mar18. We see that the degree of association between GMP per capita and socio-economic deprivation has remained roughly constant over the period in question. This demonstrates the criterion validity of the DDI. That is to say that the association between GMP per capita and socio-economic deprivation (as measured by the DDI) in all months post Mar13 is just as strong as the association between GMP per capita and socio-economic deprivation as measured by the NZDEP13 study as of Mar13. In other words, in all months post Mar13 the DDI ‘predicts’ GMP per capita just as well as the NZDEP13 study ‘predicts’ GMP per capita in Mar13. The criterion validity of the DDI is further reinforced by Panel B of which shows that the distribution of GMP and GMP per capita by Mar13 deprivation decile is virtually identical to the distributions of the same variables by Mar18 deprivation decile.
Figure 4. Criterion validity metrics for the DDI. Panel A–Pearson Correlation between GMP per capita and DDI deprivation scores between Mar13 and Mar18. Panel B–Distribution of GMP and GMP per capita by Mar13 deprivation decile and Mar18 deprivation decile.
3.3 The association between meshblock GMP per capita, socio-economic deprivation, income, EGV density, EGV proximity and ethnicity
The fact that stepwise regression identified all variables listed in as being statistically significant predictors of GMP per capita indicates that, even when controlling for socio-economic deprivation, income and the geographic location of EGVs, there are still statistically significant associations between GMP per capita and ethnicity.
However, these associations are weak. In the first instance this is evidenced by the fact that, under the aforementioned stepwise regression procedure, model R2 increased by no more than 0.0169 when adding any ethnicity into the analysis. In the second instance, indicates that whilst socio-economic deprivation (0.3208) and EGV density (0.2398) are moderately positively correlated with GMP per capita, whereas income (−0.1997) and EGV proximity (−0.2428) are moderately negatively correlated with the same variable, the correlations between ethnicity and GMP per capita are weaker (%Māori = 0.1648, %Pacific = 0.0859, %Asian = 0.0329, %Euro = −0.1705). Indeed, the fact that ethnicity is only weakly associated to GMP per capita is also evidenced in below, which shows the results of the linear regression models described in Section 2.8.
Table 3. Standardised regression coefficients derived from linear regression models of GMP per capita.
With regards to Model 1, the standardised regression coefficients associated to the various ethnicities are much smaller in magnitude than the standardised regression coefficients associated to deprivation, EGV density or EGV proximity. However, the fact that the standardised coefficients associated to Pacific Island and Asian ethnicity within this model are negative, whereas the corresponding correlation coefficients presented in are positive, is indicative of the high level of multicollinearity between independent variables within the model. For this reason we restricted subsequent models to contain Māori ethnicity only (see Section 2.8).
Looking at the standardised regression coefficients for Model 2, we see that the coefficient associated to Māori ethnicity is again positive and again smaller in magnitude than the coefficients associated to deprivation, EGV density and EGV proximity. Although, it could be argued that the positivity of the coefficient associated to Maori ethnicity is merely a result of the fact that there is a strong positive correlation (0.5587) between the proportion of meshblock population identifying as Māori and socio-economic deprivation levels (the variable in most strongly associated to GMP per capita), in Model 3 this possibility is controlled for by removing deprivation as an independent variable and essentially performing the subsequent regressions on each deprivation quintile separately. In all iterations of Model 3 the positivity of the standardised coefficient associated to Māori ethnicity persists and the corresponding standardised coefficients are much smaller in magnitude than the standardised coefficients associated to EGV density and EGV proximity.
Although there is no overall consensus with regards how best to rank the predictivity of independent variables within multi-variate regression models, in general the analysis above suggests that the association between Māori ethnicity and GMP per capita is much weaker than the associations between GMP per capita and deprivation, EGV density or EGV proximity.
4. Discussion and conclusion
Several qualifications should be made with regards to this study. To begin with, we have restricted our analysis to EGM gambling only and have made no attempt to analyse spend per capita on other forms of gambling opportunities available in New Zealand, e.g. TAB, Lotto or online gambling. This is an important qualification given that EGM gambling is only estimated to constitute around 40% of New Zealand’s total gambling expenditure (Abbott Citation2017).
Secondly, due to the nature of the data published by the DIA (Citation2018b), we were only able to create estimates of GMP at each venue. That is to say that the DIA only releases data detailing GMP per suburb and does not release data detailing GMP at a venue level for reasons of privacy and security. Consequently, we were forced to estimate GMP at a venue level by distributing suburb GMP to each venue on the basis of the proportion of suburb EGMs they contain (see Section 2.5). This, of course, adds an unavoidable degree of error into our constructed estimates of GMP per capita and subsequent analysis.
Next, our analysis includes only non-casino EGVs and GMP. Again, this is a consequence of the fact that the GMP data published by the DIA does not include spend on EGMs located within casinos. As such, our estimates of GMP per capita are naturally underestimates, particularly for meshblocks and AUs in close proximity to casinos. Once more, this is an important qualification given that 9% of individuals receiving some form of gambling intervention service in 2015/16 identified casino EGMs as their primary mode of gambling (Ministry of Health Citation2018). In theory, if casinos were forced to publicly divulge the number of EGMs they contained and the level of GMP they received, then this deficiency within our methodology would be resolved. However, one must be aware that casinos typically have substantially larger catchment zones compared to community EGM venues. Indeed, one would have to estimate casino catchment zones using a methodology akin to that employed by Markham et al. (Citation2014b), before distributing GMP from each casino to meshblocks inside the catchment zone. One would also have to factor into the analysis the fact that a significant proportion of GMP from casino venues may be attributed to international tourism.
Fourth, and perhaps most importantly, we have treated all EGM venues as having homogenous catchment zones. In other words, the inverse Huff model employed within this paper distributes GMP from each venue to meshblocks whose centroids are within 5kms of the venue. This distance threshold was chosen because it provided the greatest possible degree of correlation between meshblock GMP per capita and meshblock socio-economic deprivation levels as of Mar13. However, looking back at we see that the degree of correlation between these variables is roughly constant over the parameter range 2.5 ≤ λ ≤ 5 and 0.25 ≤ α ≤ 1. This corresponds well with other ‘blanket measures’ of venue catchment zones within the prevailing Australasian literature. In a Victoria-based survey study KPMG Consulting (Citation2000) found that EGM gamblers travel 2.5kms on average to a venue, whilst the Productivity Commission (Citation1999) estimated that venue catchment zones extended radially 5kms from each EGV. However, subsequent studies have questioned the assumption of homogenous catchment zones. Through the use of survey data it has been shown that not only do venue catchments differ by venue (Doran et al. Citation2007) but also by sub-group of visitor (Markham et al. Citation2014a). Indeed, as noted by Doran et al. (Citation2007):
predefined definitions of catchments (i.e. within a 2–5 km radius) … fail to capture fine-scale patterns of gaming venue use.
Fifth, with regards to our aim of quantifying the extent to which GMP per capita levels are associated to ethnicity once the effects of socio-economic deprivation, income and the geographic location of EGVs have been taken into account, it could be argued that there is a degree of circularity within our analysis. That is to say that the parameters of the inverse Huff model used to distribute GMP from EGM venues to the surrounding meshblocks were tuned to give the maximum possible degree of correlation between meshblock GMP per capita and meshblock deprivation levels. Given this, and the nature of the Huff model itself, one may contend that it should be of no surprise that we find ethnicity to be more weakly associated to GMP per capita levels than socio-economic deprivation or the proximity/density of EGVs. However, as noted above, the degree of correlation between GMP per capita and socio-economic deprivation is roughly constant over the parameter range 2.5 ≤ λ ≤ 5 and 0.25 ≤ α ≤ 1. This implies that our conclusions would not have been substantially different had we chosen the parameters of our Huff model to lie elsewhere in this ‘plausible range’. From experimentation we can verify that this is indeed the case.
As a final qualification, although we were able to show that the correlations between Māori or Pacific Island ethnicity and GMP per capita are weaker than the correlations between GMP per capita and the variables socio-economic deprivation, EGV density and EGV proximity, due to the strong multicollinearity of variables we were only able to construct regressions modelling GMP per capita as a function of Māori ethnicity.
Despite these limitations there are a number of strengths to our approach. To begin with, we are the first in the New Zealand context (that we know of) to be able to conduct an investigation into EGM gambling at a national level using a methodology that does not rely upon taking a sampled survey of the population, use self-reported data or use data extracted from face-to-face interviews or telephone interviews. In doing so we have succeeded in creating meaningful and robust monthly estimates of GMP per capita at an AU level. It is hoped that the trusts who operate the EGMs, and who are required by law to reinvest 40% of all GMP back into the community in the form of grants, will use our estimates to help direct funding towards the areas most affected by the harms of EGM gambling. However, one should be aware of the distinction between GMP per capita levels and EGM related harm. That is to say that we cannot disregard the possibility that although an AU may have a low level of GMP per capita, low participation rates therein may mean that only a small number of individuals contribute a majority of the GMP. In this case EGM related harm may be greater than within an AU which has a higher level GMP per capita but which also has a much higher participation rate (i.e. in which GMP spend is ‘spread out’ more equitably across the population). Nevertheless, as pointed out by Rintoul et al. (Citation2013), it is common practice to use gambling expenditure as a proxy for gambling related harm.
Furthermore, creating the aforementioned monthly estimates of GMP per capita not only provides a form of criterion validity for the DDI (see Section 3.2), but also open up intriguing new lines of research. For instance, in light of the fact that GMP per capita is positively associated with higher levels of socio-economic deprivation, a criticism often levied against the current regulatory system within New Zealand is that the distribution of funding by the trusts operating the EGMs functions like a socially regressive tax, i.e. that funds are predominantly raised from individuals living in more highly deprived areas and distributed to groups living in less highly deprived areas. The construction of the AU GMP per capita estimates within this paper make this argument a testable hypothesis. That is to say that if the trusts that operate the EGMs were to make the details of the grants made to community groups available, one could use a methodology similar to that applied within the current paper to distribute this funding from a venue level to the surrounding AUs. It would then be possible determine whether AU net gaming proceeds, GMP per capita minus funding per capita (or some derivative thereof), is positively or negatively correlated with socio-economic deprivation levels. Whilst there are obvious methodological limitations to this proposed line of research, if the former were found to be true then this would provide evidence for the hypothesis that New Zealand’s current regulatory environment acts in a socially regressive manner.
Turning to our analysis of GMP per capita at the meshblock level, we believe that the following elements of our results should be contextualised within the existing New Zealand literature. First, indicates that there is a positive (negative) association between GMP per capita and EGV density (proximity) and that this association is of moderate strength. In other words, the greater the number of EGVs in a 5 km radius of each meshblock centroid and the shorter the distance from each meshblock centroid to the nearest EGV, the higher meshblock GMP per capita. Although, this is to be expected given the methodology employed, these findings are broadly consistent with the existing New Zealand research. For instance, a study by the Ministry of Health (Citation2008b) found that closer proximity to gambling venues is associated to higher problem gambling incidence, whilst Storer et al. (Citation2009) found that per capita density of EGMs was positively associated with the same phenomenon.
Secondly, analysis of the standardised regression coefficients in suggests that income is only weakly negatively associated to GMP per capita levels. Indeed, the relationship between income and GMP per capita is likely to be a function of two opposing effects. On the one hand, given that EGVs are more likely to be located in more highly deprived areas, EGM participation is likely to be higher in lower income deciles. On the other hand, lower income levels are likely to limit an individual’s ability to spend on EGMs. Overall, the negative association between income and GMP per capita levels contrasts with some studies that have found that nominal gambling expenditure (not restricted to EGMs) increases with income (see Abbott and Volberg Citation2000). However, other studies focusing specifically on EGM gambling have found that EGM losses increase with increased levels of socio-economic deprivation and, therefore, with lower levels of income (Rintoul et al. Citation2013).
Thirdly, our results also suggest that the proportion of meshblock population identifying as being of Māori or Pacific Island ethnicity is positively associated with GMP per capita, whereas the proportion of meshblock population identifying as European is negatively associated with the same variable. Again, this is broadly consistent with a host of other studies that have identified Māori and Pacific Island populations as having higher participation rates, and being at a greater risk of gambling related harm, than European populations (e.g. Ministry of Health Citation2015, Citation2018; Abbott Citation2017). However, we note that suggests that Māori ethnicity is more strongly associated with GMP per capita than Pacific Island ethnicity. This is potentially slightly surprising as several studies have found that Pacific Island populations have a higher incidence of problem gambling relative to Māori populations (e.g. Ministry of Health Citation2015). Yet, this may be explained by the fact that although Pacific Island populations have high prevalence rates of problem gambling, actual gambling participation rates are relatively low (Abbott Citation2017). Indeed, as explained by the Ministry of Health (Citation2015):
Māori and Pacific peoples continue to have higher average monthly gambling expenditure than other groups. Given that Pacific Island population groups [have] a higher level of non-gamblers, there is a high chance that there is a subgroup of Pacific peoples that gambles frequently and has very high expenditure.
Distribution of GMP per Capita March 2018
Download MS Power Point (4.2 MB)Acknowledgements
The authors would like to express their sincere thanks to Professor Max Abbott and Dr Anne Macaskill for their insights and suggestions in constructing this manuscript. Any errors within the paper are our own and should not tarnish the reputations of the aforementioned persons.
Disclosure statement
No potential conflict of interest was reported by the authors.
ORCID
Adam D. Ward http://orcid.org/0000-0002-5259-2728
References
- Abbott M. 2017. Gambling and gambling harm in New Zealand: a 28-year case study. International Journal of Mental Health and Addiction. 15(6):1221–1241. doi: 10.1007/s11469-017-9767-6
- Abbott M, Bellringer M, Garrett N, Mundy-McPherson S. 2014. New Zealand 2012 national gambling study: overview and gambling participation. Report number 1. Auckland: Auckland University of Technology, Gambling and Addictions Research Centre. Prepared for Ministry of Health.
- Abbott M, Bellringer M, Garrett N, Mundy-McPherson S. 2015. New Zealand 2012 national gambling study: attitudes towards gambling. Report number 3. Auckland: Gambling and Addictions Research Centre, Auckland University of Technology. Prepared for Ministry of Health.
- Abbott M, Volberg R. 1991. Gambling and problem gambling in New Zealand. Research series no.12. Wellington: Department of Internal Affairs.
- Abbott M, Volberg R. 1996. The New Zealand national survey of problem and pathological gambling. Journal of Gambling Studies. 12(2):143–160. doi: 10.1007/BF01539171
- Abbott M, Volberg R. 2000. Taking the pulse on gambling and problem gambling in New Zealand: a report on phase one of the 1999 National Prevalence Survey (Report number three of the New Zealand Gaming Survey). Wellington: Department of Internal Affairs.
- Adams P. 2004. Gambling impact assessment: for Auckland City Council, Manukau City Council, North Shore City Council, Waitakere City Council, Franklin District Council, Papakura District Council and Rodney District Council. Centre for Gambling Studies - Auckland UniServices. [accessed 2019 Jun 25]. https://www.fmhs.auckland.ac.nz/assets/fmhs/faculty/Centre%20for%20Gambling%20Studies/documents/2004adams2_overview.pdf.
- Binde P. 2011. What are the most harmful forms of gambling? Analyzing problem gambling prevalence surveys. rapport nr.: CEFOS Working Papers 12.
- Binde P, Romild U, Volberg R. 2017. Forms of gambling, gambling involvement and problem gambling: evidence from a Swedish population survey. International Gambling Studies. 17(3):490–507. doi: 10.1080/14459795.2017.1360928
- Crampton P, Salmond C, Atkinson J. 2007. NZDEP06: index of deprivation. [accessed 2019 Jun 25]. http://www.otago.ac.nz/wellington/departments/publichealth/research/hirp/otago020194.html.
- Crampton P, Salmond C, Atkinson J. 2014. NZDEP2013: index of deprivation. New Zealand Ministry of Health. [accessed 2019 Jun 25]. http://www.otago.ac.nz/wellington/departments/publichealth/research/hirp/otago020194.html.
- Crampton P, Salmond C, Sutton F. 1998a. NZDEP91: a New Zealand index of deprivation. Australian and New Zealand Journal of Public Health. 22(7):835–837. [accessed 2019 Jun 25]. http://www.otago.ac.nz/wellington/departments/publichealth/research/hirp/otago020194.html.
- Crampton P, Salmond C, Sutton F. 1998b. NZDEP96: index of deprivation. Health Services Research Centre. [accessed 2019 Jun 25]. http://www.otago.ac.nz/wellington/departments/publichealth/research/hirp/otago020194.html.
- Crampton P, Salmond C, Sutton F. 2002. NZDEP01: index of deprivation. Research report. [accessed 2019 Jun 25]. http://www.otago.ac.nz/wellington/departments/publichealth/research/hirp/otago020194.html.
- Department of Internal Affairs. 2007. People’s participation in, and attitudes to, gambling, 1985–2005: results of the 2005 survey. Wellington: Department of Internal Affairs. [accessed 2019 Jun 25]. https://www.dia.govt.nz/Pubforms.nsf/URL/GamblingParticipationSurvey1985-2005.pdf/$file/GamblingParticipationSurvey1985-2005.pdf.
- Department of Internal Affairs. 2018a. All venues and numbers by territorial authority / district. [accessed 2019 Jun 25]. https://www.dia.govt.nz/diawebsite.nsf/wpg_URL/Resource-material-Information-We-Provide-All-Venues-and-Numbers-by-Territorial-AuthorityDistrict.
- Department of Internal Affairs. 2018b. Gaming machine proceeds (GMP) data. [accessed 2019 Jun 25]. https://www.dia.govt.nz/diawebsite.nsf/wpg_URL/Resource-material-Information-We-Provide-Gaming-Machine-Proceeds-(GMP)-Data.
- Doran B, Marshall D, McMillen J. 2007. A GIS-based investigation of gaming venue catchments. Transactions in GIS. 11(4):575–595. doi: 10.1111/j.1467-9671.2007.01061.x
- Doran B, Young M. 2010. Predicting the spatial distribution of gambling Vulnerability: an application of gravity modeling using ABS mesh blocks. Applied Geography. 30(1):141–152. doi: 10.1016/j.apgeog.2009.04.002
- Dowling N, Smith D, Thomas T. 2005. Electronic gaming machines: are they the ‘crack-cocaine’ of gambling? Addiction. 100(1):33–45. doi: 10.1111/j.1360-0443.2005.00962.x
- Guagliardo D. 2004. Spatial accessibility of primary care: concepts, methods and challenges. International Journal of Health Geographics. 26(3):1–13. [Accessed 2019 Jun 25]. https://ij-healthgeographics.biomedcentral.com/articles/10.1186/1476-072X-3-3.
- Huff D. 1964. Defining and estimating a trading area. The Journal of Marketing. 28(3):34–38. doi: 10.1177/002224296402800307
- Huff D, McCallum B. 2008. Calibrating the Huff model using ArcGIS business analyst. Redlands, CA: ESRI. [Accessed 2019 Jun 25]. http://www.esri.com/library/whitepapers/pdfs/calibrating-huff-model.pdf.
- KPMG Consulting. 2000. Longitudinal community impact study: 1999 report. Melbourne: Victorian Casino and Gaming Authority.
- Livingstone C. 2017. How electronic gambling machines work? EGM structural characteristics. Australian Gambling Research Centre. [accessed 2019 Jun 25]. https://aifs.gov.au/agrc/sites/default/files/publication-documents/1706_argc_dp8_how_electronic_gambling_machines_work.pdf.
- Markham F, Doran B, Young M. 2014a. Estimating gambling venue catchments for impact assessment using a calibrated gravity model. International Journal of Geographical Information Science. 28(2):326–342. doi: 10.1080/13658816.2013.838770
- Markham F, Doran B, Young M. 2014b. The spatial extents of casino catchments in Australia. Growth and Change. 45(1):60–78. doi: 10.1111/grow.12032
- Marshall D, Baker R. 2002. The evolving market structures of gambling: case studies modelling the socio-economic assignment of gaming machines in Melbourne and Sydney, Australia. Journal of Gambling Studies. 18(3):273–291. doi: 10.1023/A:1016847305942
- Mátyás L. 1998. The gravity model: some econometric considerations. The World Economy. 21(3):397–401. doi: 10.1111/1467-9701.00136
- Ministry of Health. 2005. Problem gambling geography of New Zealand. Public health intelligence monitoring report No. 7. [accessed 2019 Jun 25]. http://www.moh.govt.nz/notebook/nbbooks.nsf/0/19021F103A3B1766CC2571D1006FF3CC/$file/ProbGamGeographydocument.pdf.
- Ministry of Health. 2008a. Assessment of the social impacts of gambling in New Zealand. Centre for Social and Health Outcomes Research and Evaluation, Auckland [accessed 2019 Jun 25]. https://www.health.govt.nz/system/files/documents/publications/social-impacts-gambling-nz08.pdf.
- Ministry of Health. 2008b. Raising the odds? Gambling behaviour and neighbourhood access to gambling venues in New Zealand. Wellington: Ministry of Health. [accessed 2019 Jun 25]. https://www.health.govt.nz/publication/raising-odds-gambling-behaviour-and-neighbourhood-access-gambling-venues-new-zealand.
- Ministry of Health. 2015. Informing the 2015 gambling harm needs assessment. [accessed 2019 Jun 25]. https://www.health.govt.nz/system/files/documents/publications/informing-2015-gambling-harm-needs-assessmnt-jul15.pdf.
- Ministry of Health. 2018. Gambing harm reduction needs assessment. [accessed 2019 Jun 25]. https://www.health.govt.nz/system/files/documents/publications/gambling-harm-reduction-needs-assessment-aug18.pdf.
- New Zealand Community Trust. 2018. New Zealand’s pub gaming industry. [accessed 2019 Jun 25]. http://www.nzct.org.nz/assets/Factsheets/Fact-Sheet-2018-Pub-Gaming.pdf.
- Productivity Commission. 1999. Australia’s gambling industries. Melbourne: AusInfo.
- Rankine J, Haigh D. 2003. Social impacts of gambling in Manukau City. [accessed 2019 Jun 25]. https://researchspace.auckland.ac.nz/bitstream/handle/2292/26203/2003RankineImpactsGamblingManukauCity.pdf?sequence=6.
- Rintoul AC, Livingstone C, Mellor AP, Jolley D. 2013. Modelling vulnerability to gambling related harm: how disadvantage predicts gambling losses. Addiction Research & Theory. 21(4):329–338. doi: 10.3109/16066359.2012.727507
- Robitaille É, Herjean P. 2008. An analysis of the accessibility of video lottery terminals: the case of Montréal. International Journal of Health Geographics. 7(1):2. [accessed 2019 Jun 25]. https://ij-healthgeographics.biomedcentral.com/articles/10.1186/1476-072X-7-2.
- Statistics New Zealand. 2013. Census data tables. [accessed 2019 Jun 25]. http://archive.stats.govt.nz/Census/2013-census/data-tables/meshblock-dataset.aspx#csv.
- Statistics New Zealand. 2018a. Geographic boundary files. [accessed 2019 Jun 25]. https://datafinder.stats.govt.nz/?_ga=2.104329920.1374450794.1538517806-319449020.1526095344.
- Statistics New Zealand. 2018b. Geographic area files. [accessed 2019 Jun 25]. http://archive.stats.govt.nz/browse_for_stats/Maps_and_geography/Geographic-areas/geographic-area-files.aspx.
- Statistics New Zealand. 2018c. Population projections. [accessed 2019 Jun 25]. http://nzdotstat.stats.govt.nz/wbos/Index.aspx?DataSetCode=TABLECODE7545&_ga=2.192936361.2058210572.1539730206-736740145.1490499328#.
- Storer J, Abbott M, Stubbs J. 2009. Access or adaptation? A meta-analysis of surveys of problem gambling prevalence in Australia and New Zealand with respect to concentration of electronic gaming machines. International Gambling Studies. 9(3):225–244. doi: 10.1080/14459790903257981
- Tauranga City Council. 2018. Assessing the social impacts of gambling within Tauranga City. [accessed 2019 Jun 25]. https://www.tauranga.govt.nz/Portals/0/data/community/consultation/files/2018/gambling_social_imp_assessment.pdf.
- The Economist. 2014. The house wins, who gambles the most? [accessed 2019 Jun 25]. https://www.economist.com/graphic-detail/2014/02/03/the-house-wins?fsrc=scn/tw/te/dc/thehousewins.
- Ward AD, Trowland H, Bracewell PJ. 2019. The dynamic deprivation index: measuring relative socio-economic deprivation in New Zealand on a monthly basis. Kōtuitui: New Zealand Journal of Social Sciences Online. 16:1–20.
- Wheeler B, Rigby J, Huriwai T. 2006. Pokies and poverty: problem gambling risk factor geography in New Zealand. Health & Place. 12(1):86–96. doi: 10.1016/j.healthplace.2004.10.011
- Young M, Markham F, Doran B. 2012. Too close to home? The relationships between residential distance to venue and gambling outcomes. International Gambling Studies. 12(2):257–273. doi: 10.1080/14459795.2012.664159