
 ?Mathematical formulae have been encoded as MathML and are displayed in this HTML version using MathJax in order to improve their display. Uncheck the box to turn MathJax off. This feature requires Javascript. Click on a formula to zoom.
ABSTRACT
Compared to the burgeoning literature discussing the importance of agglomeration externalities for development, limited attention has been given to network externalities. This is largely due to limited data availability. We propose a general measure to proxy city network externalities based on toponym co-occurrences that indicate the relatedness between cities. This paper extracts intercity relationships based on the co-occurrence of Chinese place names on 2.5 billion webpages. We calculate and map absolute and relative network positions, which we use to explain urban labour productivity. We found that a stronger embeddedness in networks of cities is significantly and positively associated with urban productivity. Smaller cities benefit comparatively more from being well embedded in city networks, suggesting that these relations can compensate for a lack of agglomeration externalities. We also compare the importance for urban performance of city network externalities vis-à-vis agglomeration externalities. City network externalities turn out to be more important in explaining urban performance than agglomeration externalities. This calls for new theorizing on a relational approach to urban and regional development. Rather than stimulating further concentration of urbanization, our findings suggest that fostering relationships between cities is a viable alternative urban development strategy. We conclude with suggestions for a research agenda that delves deeper into city network externalities.
Highlights
We proxy city network externalities through co-occurrences of city names on Web pages
We map relations between Chinese cities and calculate their network position
Cities that are well-embedded in networks with other cities perform better
Network externalities better explain urban productivity than agglomeration externalities
Fostering relationships between cities is an important development strategy
1. Introduction
Agglomeration economies are considered key to urban growth, and much scholarly attention has consequently gone into studying this relationship. However, cities cannot be studied in isolation (Pumain, Citation2021). They are connected in varying degrees to a range of other cities through flows of labour, capital and information (McCann & Acs, Citation2011). These various kinds of flows constitute the urban network system and open up possibilities for synergy in urban and economic development (Gordon & McCann, Citation2000; Johansson & Quigley, Citation2004; Parr, Citation2004). A growing awareness of cities’ external economies is reflected in the introduction of new concepts such as ‘regional externalities’ (Parr, Citation2002), ‘borrowed size’ (Meijers & Burger, Citation2017; Phelps, Fallon, & Williams, Citation2001) and ‘urban network externalities’ (Capello, Citation2000). This means that studies of urban performance need to incorporate both agglomeration externalities and the externalities resulting from the relationships of firms, households and organizations with other cities (Burger & Meijers, Citation2016; Glaeser, Ponzetto, & Zou, Citation2016).
Nevertheless, although emphasis on the importance of city network externalities for city performance is not new (see for instance the urban systems literature of the 1960s and 1970s), and definitely on the rise, relatively little is still known about the comparative importance of city network externalities vis-à-vis agglomeration externalities. This is mostly due to challenges in quantifying city network externalities (Burger & Meijers, Citation2016; Capello, Citation2000; Van Meeteren, Neal, & Derudder, Citation2016). Yet, it is important to get an understanding of the relative importance of city network externalities and agglomeration externalities in improving urban performance, as benefiting from agglomeration externalities requires an entirely different urban and regional development strategy (focused on concentration) than enforcing network externalities (focused on establishing a myriad of connections and relationships). This paper therefore addresses an important planning debate on the future of urbanization. Should we focus on a more balanced development of national urban systems or rather put our eggs in one basket of a national champion city?
To answer such a fundamental question it is essential to solve the issue of how to measure city network externalities. This is easier said than done; the lack of city relational data was once considered to be the ‘dirty little secret’ (Short, Kim, Kuus, & Wells, Citation1996) of city network research and the measurement of city networks has been a continuous and common challenge ever since (Meijers & Peris, Citation2019; Salvini & Fabrikant, Citation2016). A typical challenge is that information on flows on higher geographical scales between cities is limited as traditional data collection is either focused on flows relevant for daily urban systems (e.g. commuting), or on inter-regional rather than inter-urban flows (e.g. trade, migration). Moreover, existing data often focuses on just one type of relation or flow (e.g. train timetables; participation in projects; intra-firm networks) which may be very useful for a particular analysis, but does not necessarily represent a comprehensive picture of city networks.
For these reasons, new methods of collecting intercity relational data are being explored. One promising method is geographic text analysis, which extracts information about places from text through keywords, structure and content (Gregory, Cooper, Hardie, & Rayson, Citation2015; Porter, Atkinson, & Gregory, Citation2015). This type of methods is of particular interest due to its accessibility and its ability of obtaining large-scale, intercity relational data. For instance, geo-tagged posts on social media (Fang, Yu, Zhang, Fang, & Liu, Citation2020; Hu, Wang, Wu, & Stanley, Citation2020) and photos (Yuan & Medel, Citation2016) have been extracted for analyzing intercity relationships. The potential of analyzing text corpora for geographic purposes is very substantial, as estimates suggest that about 70% of our documents contain place references (Hill, Citation2009).
In geography, we often derive spatial relationships from co-occurrences. For instance, we search for co-occurrences of geo-located authors in scientific co-publication patterns (Dai, Derudder, Cao, & Ji, Citation2023; Ma & Xu, Citation2023) or patents (Petralia, Balland, & Rigby, Citation2016). At a higher, macro scale, we can also search directly for the co-occurrence of city names. This has the advantage of being more comprehensive than a micro-level approach, but the disadvantage that a specific co-occurrence of place names is harder to specify or categorize and does not necessarily imply a tangible relationship, nor an actual flow, as it can be more abstract and symbolic (Watts, Citation2004). Yet, as is the standard assumption underpinning every text mining analysis, co-occurrences indicate relatedness, and we assume that more than usual or expected co-occurrence of a pair of city names indicates that they are relatively more strongly related. We believe that, in order to proxy the broad concept of city network externalities, it makes sense to rely on such a more generic measure of relatedness, just as the broad concept of agglomeration externalities is typically proxied with generic proxies as ‘size’ or ‘density’.
The nature of the objective of this paper is both methodological and theoretical. Methodologically, we aim to identify intercity relationships and aggregate network patterns through applying the still rather novel toponym co-occurrence method. Theoretically, we aim to evaluate and compare the relative importance of city network externalities vis-à-vis agglomeration externalities on city performance, thereby using a Cobb Douglas production function. Empirically, we focus on China. This country’s unbalanced urbanization and heterogenous intercity relationships lead to a variety of city network positions (Phelps, Miao, & Zhang, Citation2023), which thus allows us to study their relevance for performance. The difficulty of finding city relational data in China is an additional reason why applying the toponym co-occurrence method to this country is of value. Another reason is that both the central and local governments have developed strategies to integrate cities within mega-regions through reform and major infrastructure projects (Fang & Yu, Citation2017; Harrison & Gu, Citation2019), thereby prioritizing the development of networks over further concentration. This study will shed light on the desirability and feasibility of strategies aimed at enhancing the presence of city network externalities. As such, the relevance of this paper goes well beyond China.
This paper demonstrates the potential of the toponym co-occurrence method to identify intercity relationships and highlights the positive impact of a strong network position on a city's performance, especially for smaller cities. Network externalities are more crucial in explaining productivity levels than agglomeration externalities, suggesting that fostering relationships between cities can serve as a viable alternative urban development strategy to stimulating further agglomeration.
The paper is structured as follows. First, we provide a brief overview of how network externalities benefit city performance, and discuss the toponym co-occurrence method (Section 2). Second, we present our experiment, detailing the steps taken in the process (Section 3) to obtain the pattern of relationships between Chinese cities. Third, we present and map this toponym co-occurrence network of China and analyze how it compares to theoretical predictions of these patterns using the gravity model (Section 4). Fourth, we analyze the impact of network externalities on city performance in comparison to agglomeration externalities (Section 5). Finally, we discuss our findings and how they translate into a research agenda that is both of theoretical and methodological interest (Section 6).
2. Literature review
2.1. Network externalities versus agglomeration externalities
The discussion of agglomeration economies often traces back to the economist Alfred Marshall (Marshall, Citation1920), who argued that agglomeration creates a more efficient labour market and reduces transportation costs and explained how input sharing, labour market pooling and knowledge spillovers were drivers of agglomeration. ‘Sharing, matching and learning’ are still the sources of agglomeration benefits (Duranton & Puga, Citation2004). More recent studies also find other sources, including home market effects (Krugman, Citation1980, Citation1995), where concentration of demand encourages agglomeration, and consumption-related effects (Glaeser, Kolko, & Saiz, Citation2001; Waldfogel, Citation2008).
While agglomeration benefits are still considered the main driving force for urban development, fear of agglomeration costs such as congestion, pollution, high housing prices and large-scale social unrest often deters politicians and urban planners from actively supporting high urban concentrations (Au & Henderson, Citation2006; Wei, Huang, Lam, & Yuan, Citation2015). An optimal balance between agglomeration benefits and costs is what urban policy-makers often strive for.
Although in many early empirical studies, agglomeration externalities are defined as being geographically constrained (Rosenthal & Strange, Citation2004), it is also known that agglomerations are not islands and most cities interact to a certain degree (McCann & Acs, Citation2011). Therefore, a possible strategy to avoid agglomeration costs but still enjoy the type of benefits known as agglomeration benefits is to strengthen the relations between cities. This would lead to ‘urban network externalities’ that can be defined as ‘external economies from which firms and households can benefit by being located in agglomerations that are well embedded in networks that connect with other agglomerations’ (Burger & Meijers, Citation2016). This idea was already at the heart of Howard’s Garden City concept (Citation1898) and conceptualized in Alonso’s (Citation1973) idea of ‘borrowed size’. Recent studies further clarified this concept and find that borrowed size is enabled through the interactions in networks of cities (Capello & Camagni, Citation2000; Meijers & Burger, Citation2017; Meijers, Burger, & Hoogerbrugge, Citation2016). The general idea is that the city interactions provide potentials for cities to exploit increasing returns through co-operative activities and complementary sectoral specializations. This effect is referred to as network externalities, to differentiate from agglomeration externalities.
Spatial proximity is certainly an important factor that encourages the interactions between cities. However, with the advance of communication technologies such as online meeting platforms, spatial forms of proximity can be complemented by other types of proximity (Capello, Citation2020; Johansson & Quigley, Citation2004), such as organizational, institutional, cognitive and social proximity (Boschma, Citation2005). Moreover, urban economies develop from manufacturing industries to services in which creativity and innovation play an important role (Florida, Gulden, & Mellander, Citation2008; Glaeser, Citation2011), and for instance distant networks may have become an additional important source of performance next to local interactions (Bathelt, Malmberg, & Maskell, Citation2004), which may even make network externalities better at stimulating innovations (Basile, Capello, & Caragliu, Citation2012; Galaso & Kovářík, Citation2021). For instance, research in the USA (Schilling & Phelps, Citation2007), Europe (Sebestyén & Varga, Citation2013) and China (Yao, Li, & Li, Citation2020) and worldwide (Belderbos, Benoit, & Derudder, Citation2022) all found that firms well embedded in interfirm collaboration networks have higher innovative output as the network facilitates the circulation of knowledge across a larger pool of sources. Numerous scholars (Florida, Gulden, & Mellander, Citation2008; Lang, Lim, & Danielsen, Citation2020; Ross, Woo, & Wang, Citation2016) have presented the notion of globally interconnected cities as the primary drivers of economic growth.
Camagni, Capello, and Caragliu (Citation2015) found that second tier cities in Europe can overcome the lack of agglomeration through innovation and city networks. However, regarding cultural amenities, Burger, Meijers, Hoogerbrugge, and Masip Tresserra (Citation2015) find that size of a city still matters most – larger cities actually profit more than smaller cities, and in fact, often cast an ‘agglomeration shadow’ over smaller cities. While agglomeration economies remain important, several studies (Camagni, Capello, & Caragliu, Citation2016; Cicerone, McCann, & Venhorst, Citation2020; Huang, Hong, & Ma, Citation2020; Meijers et al., Citation2016) show that stronger relations and connectivity to other regions and (larger) cities fosters development, and makes agglomeration benefits spill over to nearby smaller places. Similar results were also found for Japan (Otsuka, Citation2020), USA (Chatman & Noland, Citation2014) and China.
In China, many studies have used the high-speed railway network as a proxy representing the strength of city relationships (Huang et al., Citation2020; Jiao, Wang, Zhang, Jin, & Liu, Citation2020; Niu & Li, Citation2018). Generally, these show that there is a positive effect on the economic growth of cities by improving cities’ connectivity and accessibility in the high-speed railway network. Shi and Pain (Citation2020) collected the passenger, freight and intercity capital flows within the Mid-Yangtze River city region (MYR) in China. They found that a city’s economic growth is significantly related with a city’s internal capital stock, labour cost and technology advances, but is also significantly linked with a city’s network position in the three types of flows. However, it must be noted that while there may be generative effect (a general positive effect of transport infrastructure improvement) for the economy as a whole, this may hide a distributive effect too in the sense that some cities profit, whereas others lose out due to improved accessibility, and in its wake, increased competition (Meijers, Hoekstra, Leijten, Louw, & Spaans, Citation2012). This would be the case particularly in non-targeted peripheral cities, as they are driven to specialize more in agriculture activities and lose industrial output (Baum-Snow, Henderson, Turner, Zhang, & Brandt, Citation2020; Faber, Citation2014). Here, we may draw an analogy with agglomeration benefits and costs, as there are also network benefits and costs.
2.2. Geographic text analysis: toponym co-occurrences
Documents often contain geolocated-information such as place names, addresses, postal codes, etc. Enabled by the increasing digitalization of texts, geographical information retrieval and text analysis allows to summarize and analyze geographical information in texts (Gregory et al., Citation2015). By searching words that frequently co-occur with a place name, it is possible to identify certain characteristics of a place. For instance, one can combine place names and disease-related keywords to map mortality patterns (Porter et al., Citation2015). The toponym co-occurrence method searches for the co-occurrence of two or more place names. Two place names are considered as ‘co-occurring’ if both are mentioned in a predefined textual context. When cities are often mentioned together, it is assumed they are strongly related. The roots of the method in geography go back to the famous geographer Waldo Tobler who reconstructed the urban system of 119 pre-Hittite towns in Capadoccia 4,000 years ago based on toponym co-occurrences on cuneiform tablets (Tobler & Wineburg, Citation1971), which inspired his first law of geography ‘Everything is related to everything else, but near things are more related than distant things’.
Toponym co-occurrences have been explored in various types of corpora, such as Wikipedia (Devriendt, Derudder, & Witlox, Citation2008; Overell & Rüger, Citation2008; Salvini & Fabrikant, Citation2016), newspapers (Liu, Wang, Kang, Gao, & Lu, Citation2014) and web archives (Meijers & Peris, Citation2019). The frequency of the toponym co-occurrence is found to be positively correlated with the strength of these relationships (Ballatore, Bertolotto, & Wilson, Citation2014; Liu et al., Citation2014), however, most of the applications are limited in toponym disambiguation (Overell & Rüger, Citation2008). Patterns found correspond with known patterns of interaction, and a certain overlap with predictions based on gravity modelling adds to its plausibility (Meijers & Peris, Citation2019).
Regarding the application of toponym co-occurrence in China, some pioneering studies have shown the potential this method has for analyzing intercity relationships. Liu et al. (Citation2014) applied this method to a search engine to investigate the relationship between geographical entities with data collected from Baidu, a Chinese Internet search engine. They found this method can be used to find similarities between neighbouring provinces and to study the spatial organization of China. Zhong, Liu, Gao, and Wu (Citation2017) further developed this method by applying complex network theory to evaluate the topological structures of the toponym occurrence network which was extracted daily from a newspaper over the course of a year. They found that the network showed strong cluster characteristics, and the frequency of toponym co-occurrence was negatively correlated with the administrative hierarchy, but less so with geographic distance. Guo, Zhang, Du, Kang, and Liu (Citation2022) calculated a city’s total appearance with other Chinese cities on the search engine Baidu, and examined the factors that can contribute to the frequency of this appearance, finding that factors such as GDP, administration level, tourism and the number of enterprises all significantly increase a city’s appearance on the Internet.
3. Method
3.1. Data
The accuracy of the toponym co-occurrence method depends on the choice of the text corpus to which it is applied. This choice depends on the purpose of the analysis, as very specific text corpora can be used. Here, we want to obtain a very general picture of the Chinese urban system, which is why we chose to focus on all Chinese webpages as our text corpus. While it is possible to search for toponym occurrences using a search engine like google, results returned are vulnerable to bias (Meijers & Peris, Citation2019), and like Meijers and Peris we prefer using corpora from the CommonCrawl Archive of webpages as our text corpus. We used the entire April 2019 database for processing and conducting experiments. The original database we extracted contains about 6.98 TB of uncompressed text containing 2.5 billion web pages crawled between 18 and 26 April 2019. We selected all pages using at least 10 Chinese characters. The filtered corpus contains approximately 110 billion Chinese words on 91 million pages from 1067 different domains. Over 91% of the tokens are from websites registered under the four top-level domains (TLD): .com (62.23%), .cn (14.80%), .net (7.86%) and .org (2.68%). The four TLDs make up about 87.57% of pages.
3.2. Corpora preprocessing
To identify Chinese place names, accurate separation of Chinese words is a prerequisite. This is because Chinese words are often composed of more than one Chinese character, and a Chinese sentence is formed by consecutive Chinese characters, without any clear separation. Here we used a popular Chinese word-segmentation module named JIEBA for accurate word separation. The principle of this word-separation module is based on frequency-inverse document frequency (TF-IDF) method, which assigns an importance to words according to their frequency in a given corpora relative to the frequency of these words across the complete document set. The detailed processing is explained in Tongjing, Yin, Bao & Meijers (Citation2022).
3.3. Gravity model benchmark
We selected the 293 cities in China at prefecture administration or higher. We subsequently retrieved the number of webpages where each pair of cities co-occurs, studying 42,778 pairs in total (which means it is a fully-connected network). As could be expected, the frequency of toponym co-occurrences is highly correlated with population size of the places involved. For our later analysis it is essential to disentangle city network and agglomeration effects, and measure the relative rather than absolute strength of relationships a city has. We decided to follow Meijers and Peris’ approach, thus comparing absolute frequencies of co-occurrences with expected frequencies as predicted by the gravity model.
In the simplest form of the gravity model, the interaction of place and place
is proportional to the product of place
and
, and inversely proportional to the distance between the two places:
where
is the total relationship,
is the constant,
and
are the population sizes of place
and
, respectively,
is the physical distance between the two places,
and
reflects the ability of place
and
to attract flows,
reflecting the rate of increase in the friction of distance.
We first fit the gravity model with the toponym co-occurrence results to estimate the strength of intercity relationship by controlling the size and distance. And then the estimated relationship is set as benchmark to determine whether the toponym co-occurrence between two cities is stronger or weaker than the gravity model estimation. The link weight of the intercity relationship is defined as the ratio of toponym co-occurrence to gravity model predicted results:
where
is the relative strength of intercity relationship between city i and city j (which we refer to as ‘link weight’),
is the actual toponym co-occurrence of city i and city j and
is the estimated co-occurrence of city i and city j in the gravity model. After transformation to percentages, a value higher than 100% means the relationship is stronger than expected given size and distance between the cities. Obviously, a value less than 100% indicates that the relationship is weaker than expected.
3.4. Network externalities
To measure a city’s network position, we use a network topological attribute, namely average relatedness. Average relatedness (AR) is a concept of average node strength borrowed from network theory (Newman, Citation2010). It is the sum of link weight associated with city i divided by the number of links city i connects with, indicating the average relationship level of a city:
where
is the set of the link weights of city i, N is the number of links city i connects with in the network, and
is the relative strength of intercity relationship between city i and city j, as defined in 3.3. A value higher than 1 indicates that on average, the city is relatively more related to other cities than expected according to the gravity model.
3.5. City performance assessment
Next, we proceed to models investigating if there is a significant association between certain kinds of city network positions and city productivity when controlling for factors such as land (L), human capital (H) and investment (K). A city’s productivity is measured as the city’s product (Q) divided by the city’s population (P). The Cobb–Douglas production function is a widely used standard approach for estimating city performance, as noted in previous studies (Bird, Lebrand, & Venables, Citation2020; Meijers & Burger, Citation2010; Melo, Graham, & Noland, Citation2009). Based on the linear Cobb–Douglas production function, the city productivity (Q/P) is specified as:
In this function, average relatedness (AR) is the network externality variable, population size (
) captures agglomeration externalities, and investment per capita
, human capital per capita
, land per capita
and industrial structure (IS) are control variables, while ‘r’ represents the remaining differences in total factor productivity. We added the industrial structure variable, measured by the ratio of secondary-tertiary industry (Barro, Citation1996), to account for the impact of industrial composition on productivity. Their measurement is discussed in the following subsection.
3.6. Data and variables
To estimate our productivity model, data was gathered from the 2019 China Statistical Yearbook for Cities, provincial statistical yearbooks, Hong Kong 2019 Annual Digest of Statistics, and Macau 2019 Yearbook of Statistics, which all provided city statistics for 2018.
The dependent variable nominal output (Q) was measured as the 2018 GDP in real Chinese yuan (CNY) of each individual prefecture-level city and its administered counties. The GDP of Hong Kong and Macau were converted into Chinese yuan based on the 2018 yearly average exchange rate.
As is common (Melo et al., Citation2009), we measure the presence of agglomeration externalities with a variable capturing city size (P), which is measured as the size of the total year-end permanent residents in 2018.
There are four control variables in our model. This includes human capital per capita , which is often based on the average years of schooling (Benhabib & Spiegel, Citation1994), but such data is generally not available in China. Another important factor is that China’s big cities’ populations have a large proportion of migrants. For instance, of Shanghai’s 24 million residents, 9 million (or over 39%) are long-term migrants. Thus, tabulating the number of years in school for local residents only provides a fraction of the actual education level in these big cities. Instead, a positive relationship between patents and human capital has been identified and extensively researched (Li & Jiang, Citation2016; Li & Phelps, Citation2019). Here we use the number of patent authorizations as a proxy for human capital (H) from the statistical yearbooks. A second control variable is data on the investment per capita
, which is based on the government expenditure to reflect the internal intervention of local governments (Li, Sun, & Zhang, Citation2019). The third control variable is land per capita
, which is captured through the size of the built-up area of a city. The fourth control variable is the industrial structure, which is measured by the ratio of secondary-tertiary industry (Barro, Citation1996). Descriptive statistics are provided in and correlations in .
Figure 1. Correlation matrix. Significance codes: 0 ‘***’ 0.001 ‘**’ 0.01 ‘*’.
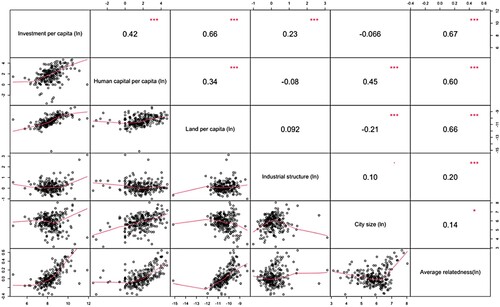
Table 1. Descriptive statistics.
4. The Chinese urban system according to toponym co-occurrences
4.1. Absolute patterns of toponym co-occurrences
We explored how often pairs of Chinese city names are mentioned ‘in one breath’ on websites, the resulting network is presented in . For readability, we only present the top20% most frequently occurring pairs of cities.
Figure 2. The visualization of top 20% toponym co-occurrence in China.
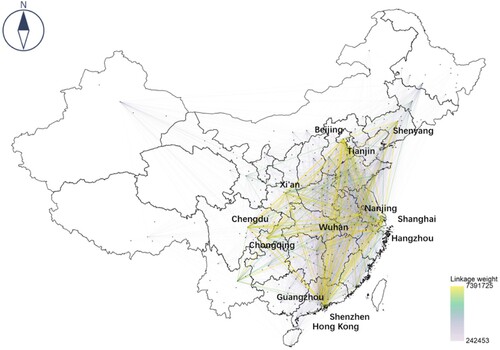
shows that, in absolute terms, most of the relationships concentrate in the southeastern side of China where the Chinese population also concentrates, and the well-known ‘Hu Huanyong Line’ divide is visible (Chen, Gong, Li, Lu, & Zhang, Citation2016). Our results reveal that the strongest relationships exist between five city clusters (thus, also clusters of relationships) that are highlighted in yellow. These relationships together form a diamond shape where the outline is formed by five city clusters: Yangtze River Delta (Shanghai, Hangzhou and Nanjing) in the east; Pearl River Delta (Guangzhou, Shenzhen and Hong Kong) in the south; Chengyu Region (Chongqing and Chengdu) in the west; the Beijing–Tianjin–Hubei Region (Beijing and Tianjin) in the north; and the Middle-Yangzte River Region (Wuhan) in the centre. It is noteworthy that all five city clusters are classified as top-tier city clusters in the latest China fourteen-five-year plan, which emphasizes the importance of developing interconnected and interdependent city clusters to promote sustainable economic growth and regional development. Importantly, this diamond pattern is also found in the gravity economic index map plotted by Lao et al. (Lao, Zhang, Shen, & Skitmore, Citation2016), in the social connection map plotted by Zhen, Wang, and Chen (Citation2012) using Sina microblog data, a social medium or in the patterns between city pairs using Baidu search engine (Guo et al., Citation2022).
We also summed up the toponym co-occurrences a city has with the other cities to represent a city’s ‘attraction’. As shown in , there is a positive correlation between city ‘attraction’ and its GDP rank. This verifies the previous study activities (Guo et al., Citation2022) that cities with more affluence or higher populations appear more frequently in news reports, social media and business, and apparently are also mentioned more often in the same breadth with other cities. However, we also observed that cities with high administration levels tend to have higher ‘attraction’ than normal prefectural cities with similar GDP rankings. Notably, Hong Kong and Macau, two highly prosperous cities, had relatively lower aggregated toponym co-occurrence compared to cities with similar GDP rankings, an issue to which we return below. Additionally also shows that cities with higher populations usually have more relations. The top ten cities in terms of relationship strength are listed in . As can be seen, the network position of those cities is not very dissimilar.
Figure 3. Cities’ aggregated toponym co-occurrence versus GDP rank and population size.
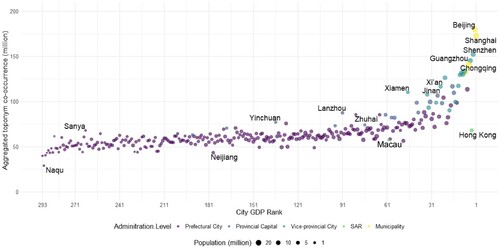
Table 2. Top 10 China aggregated toponym co-occurrence.
4.2. Relative pattern of toponym co-occurrences
In Section 4.1 we found that the population size has a clear impact on the absolute strength of intercity relationship. Building upon this finding, our more comprehensive analysis in shows that the gravity model reasonably captures the absolute pattern of toponym co-occurrences.
Table 3. Gravity model result.
The adjusted indicates that about 40% of the variation of the toponym co-occurrence frequency can be explained by the two cities’ populations and the distance. For comparison, Meijers and Peris (Citation2019) found that the gravity model can explain 56% of the variation in toponym co-occurrences of places with populations over 10,000 in the Netherlands.
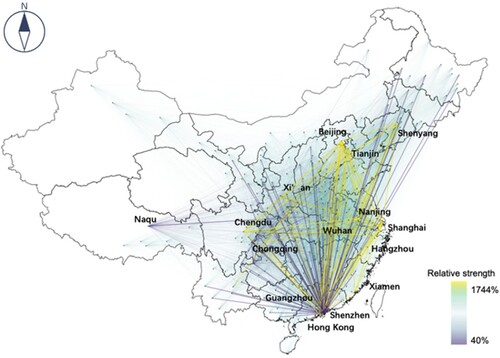
The visualization of the relative strength of relationships is shown in . For each pair of cities, we calculated the ratio between the observed actual toponym co-occurrence value and the expected value (based on the gravity model). For interpretation: 100% means that both are similar, 50% means that only half of the expected co-occurrences were found. A similar diamond pattern between the top linkages can still be identified. It means the relationships between those top administration cities cannot be fully explained just by population or distance.
Figure 4. Relative strength of relationships between Chinese cities.
Before comparing city network externalities with agglomeration externalities, we first visualized the relationship between a city’s GDP rank, population and average relatedness in . Recall that a city’s average relatedness (AR) is defined at the city (not city pair) level and concerns the ratio of observed toponym co-occurrences to gravity model predicted values. For interpretation: 100% means that both are similar, 50% means that only half of the co-occurrences expected were found.
Figure 5. Observed toponym co-occurrences compared with gravity model prediction.
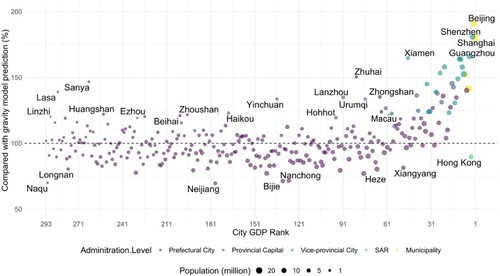
As presented in , a positive correlation between network position and GDP rank can be observed. However, it also shows that cities with high administration levels generally have higher network strength than normal prefecture cities with similar GDP rankings. It is interesting to compare Shenzhen, Hong Kong and Macau in this Figure. Shenzhen and Hong Kong are both top tier cities in China, and neighbours. However, their relationships with other cities vary significantly. Some of the largest negative residuals are linked with Hong Kong, which indicates a relatively weak position of Hong Kong in the Chinese urban system. In sharp contrast, most linkages with Shenzhen are positive. This shows that Hong Kong, a special administration region in China with its own judicial power and customs, is not yet fully integrated in the Chinese urban system: the strength of relationships is clearly moderated by border effects (Capello, Caragliu, & Fratesi, Citation2018; Sohn, Licheron, & Meijers, Citation2022). Yet, when comparing Hong Kong with Macau, also a Special Administrative Region, Macau seems to be much more integrated than Hong Kong (), meaning that borders cannot explain everything.
5. City networks vis-à-vis agglomeration
In this section we turn to the discussion whether the position in networks between cities matters for the performance of cities, and assess the importance of such network externalities in comparison to agglomeration externalities. In our models 1-2-3-4-5 (see ), we include all cities and all variables, but also focus on just our variables of interest capturing agglomeration and network externalities, including the interaction effect variable between agglomeration and network externalities (because of some collinearity between our network variable and controls – recall ). Next to the overall picture for all cities, and as a robustness check, we explore whether effects differ for subregions, thereby running regressions for cities in the three megaregions (Yangtze River Delta, Pearl River Delta and Jingjinji) and for all other cities in the remainder of China in models 6-9.
Table 4. Results of regression models on metropolitan productivity.
In general, as shown in Model 1-4, average relatedness is positively associated with city performance. The positive sign indicates that being well related to other cities enhances productivity. This effect is repeatedly found in nearly all other model specifications which suggests that it is a rather robust finding.
Nevertheless, when comparing Model 1-2-3-4-5, the network variable shows significant association in all models, while the agglomeration variable is only significant when it is entered just by itself and can only explain negligible variance of productivity when compared with network variable results. Surprisingly, though, this effect runs counter to what the literature on agglomeration externalities predicts, as the agglomeration effect is commonly considered key for productivity (Camagni et al., Citation2016; Cicerone et al., Citation2020). A possible explanation is that agglomeration costs often outweigh agglomeration benefits in the Chinese cities, which is actually a key reason for the Chinese government to pursue a polycentric development strategy in combination with fostering relations between cities. Rather than agglomeration externalities driving productivity, it seems that network externalities are a much more relevant productivity enhancing mechanism.
Regarding the interaction effect between agglomeration (city size) and network externalities, Model 5 indicates a negative and significant relationship. When city size increases, the importance of relations for performance decreases. Vice versa, when population size decreases, the importance of relatedness for performance becomes stronger. It confirms previous studies that the benefits of network externalities diminish in large cities (Li et al., Citation2019; Meijers & Burger, Citation2010). At the same time, relatively small cities that have stronger than expected relations with other cities have higher productivity – they probably can use their networks to compensate for a (comparative) lack of agglomeration externalities. These results suggest that relations with other cities allow smaller and medium-sized cities to ‘borrow size’ through those relations.
As a robustness check, we split the sample to compare cities in megaregions (, models 6–7) and cities that are not located in megaregions (Models 8–9).
Table 5. Results of regression models by regions.
The results show that in models 6–7, including just cities in the three megaregions, the average relatedness has no significant association with the city performance, but for cities in the remainder of China it has a positive effect (models 8–9). A possible explanation is that the average relatedness represents an overall relatedness at the national level. For most Chinese cities a greater nation-wide relatedness brings higher performance. However, cities in megaregions seem less dependent on their national network position. There are several large cities in each megaregion, such as Shanghai, Nanjing, Hangzhou in Yangtze River Delta, Beijing and Tianjin in Jingjinji, which may function as gateway to other cities at the national scale. Probably, for the smaller cities in megaregions, the relation with their larger neighbour is primarily of importance, allowing them to borrow their agglomeration benefits, whereas relations with cities beyond their megaregion are only secondary. Another contrast between cities in megaregions and those outside the three main megaregions concerns the effect of population size (or, agglomeration). It tends to be not significant for cities in megaregions, but population size is positively associated with productivity for cities outside those megaregions. One possible explanation is that in more highly related megaregions (recall , with a higher average relatedness for cities in megaregions), the complex interplay between agglomeration and networks produces the ‘borrowed size’-effects and ‘agglomeration shadows’ discussed in Section 2, which disrupt the more traditional patterns that we still see for cities outside of megaregions.
6. Conclusion
Around the world, there is growing interest in development strategies aimed at integrating cities more strongly. The underlying assumption is that a city’s performance is not only determined by agglomeration externalities but also, and perhaps increasingly by its network position (Huang et al., Citation2020; Sassen, Citation2007). While many studies have used rather specific data to capture city network externalities, we proposed and used a generic measure of city network embeddedness derived from toponym co-occurrences in an enormous text corpus of all websites in Chinese. Previous studies have shown that the toponym co-occurrence method is able to (re)construct networks of relationships between cities, and given the increasing availability of text corpora, be it digitalized historical archives or archives of contemporary resources like Web Archives, such methods are very promising. Using this method, and computational social science, we extracted intercity relationships at an unprecedented large scale, detailing over 42,000 intercity relationships in China. Although this method is used in China as we studied the Chinese city relationship, it is also suitable to study other countries by searching their local languages.
The toponym co-occurrence method is presented in this paper, and its results mapped and analyzed. Gravity modelling is used to gain an understanding of the relative network position of cities in China. This all served the bigger ambition of this paper, namely to explore the importance of network externalities in comparison to agglomeration externalities. In line with Huang et al. (Citation2020), a strong network position was found to be positively associated with a city’s performance, emphasizing the existence of network externalities. This importance was greater for the relatively smaller Chinese cities among the almost 300 largest cities studied. In comparison to agglomeration externalities, network externalities were much more important in explaining productivity levels.
This finding begs for more theorizing as the urban and regional development literature is dominated by urban triumph narratives in which agglomeration benefits are considered the key driver of growth. Quite in contrast, we find that a relational perspective on urban growth and decline is a more promising avenue, and this calls for a better understanding of urban network externalities. What we have seen in this paper is that larger cities profit less from their network position, whereas well-performing smaller cities seem to compensate a lack of size with a good network position. Of course, in this debate we need to discuss whether our findings only hold for China, or have wider relevance, but findings for Europe do not seem to be dissimilar (Meijers & Burger, Citation2017).
An essential theme for further research is how agglomeration externalities and network externalities relate to each other, and perhaps even may be dependent on each other. This will require further disentangling the interconnected concepts of agglomeration and network externalities (Van Meeteren et al., Citation2016). Based on Drucker (Citation2012), who found that the spatial extent of agglomeration externalities depends on the industry, type of agglomeration, and type of externality examined, we may assume that only some agglomeration externalities can also be obtained in networks. This makes that the significance of agglomeration (size) and network relations varies depending on what benefit (or cost) is being measured (Meijers et al., Citation2016; Phelps, Citation2021). Disentangling a potential recursive relationship should be a key concern for future studies.
This also has important implications for policy making. Strategies to make Chinese cities more competitive and productive should not be foremost oriented at a further concentration of people and firms in space. Instead, our results suggest that in particular smaller- and medium-sized cities can better gain competitiveness from being strongly related to other cities in the country. Those that are better embedded in all kinds of functional, political, cultural, economic, academic and social networks do perform better. Policies could target the institutions and infrastructures that allow for such networks to develop. There is no a priori reason to assume that such a general policy strategy should be different in other countries. Further research is needed to specify which types of relationships are most important for positive city network externalities (see Schweitzer et al., Citation2009).
Methodologically speaking, the toponym co-occurrence method is still in its infancy in geography and needs to be more widely tested and applied as a way to measure interurban relatedness. Conceptually, it would be good to know which share of co-occurrences generally involves some physical transfer of for instance people or goods, and which share is more symbolic. Particular attention needs to be devoted to how relationships between cities that co-occur frequently in texts should be interpreted. A logical next step is to classify such relationships. Also the application of the method to different text corpora is recommended. A comprehensive database, such as Common Crawl, may indicate a general city-network pattern but detailed analysis requires an understanding of the actual meaning of the relationships. Perhaps a more targeted data source, such as newspapers, social media, or Wikipedia, may provide a clearer city network. Alternatively, the use of machine-learning techniques to classify linkages, as suggested by Meijers and Peris (Citation2019), deserves attention. In terms of modelling, while we included the main factors in urban productivity, future studies could expand the range of factors included to see whether our results still hold, thereby including evolutionary, behavioural and institutional factors. Also the endogeneity issue deserves more attention. A complex interplay between agglomeration and network externalities on the one hand, and labour productivity on the other exists. While we theoretically argue that being well positioned in networks allows to profit (‘borrow size’) from production factors located in other cities with which one city is well-connected, it is not unthinkable that highly productive cities develop more relations, because of their productivity.
While the research agenda still ahead call for some caution in drawing final conclusions, it is nevertheless obvious that city network externalities deserve much more attention, both in theory and in empirical research. Methodologically, the text mining of digital text corpora, still a nascent research approach in economic geography, seems to hold much promise and needs to be further developed potentially enabling a better understanding of urban and regional development.
Acknowledgement
We would like to thank Zhao Yin, Tinglin Zhang, Nicola Cortinovis and Martijn Smit for helpful comments on an earlier draft of this paper.
Disclosure statement
No potential conflict of interest was reported by the author(s).
References
- Alonso, W. (1973). Urban zero population growth. Daedalus, 102, 191–206.
- Au, C.-C., & Henderson, J. V. (2006). How migration restrictions limit agglomeration and productivity in China. Journal of Development Economics, 80, 350–388.
- Ballatore, A., Bertolotto, M., & Wilson, D. C. (2014). An evaluative baseline for geo-semantic relatedness and similarity. GeoInformatica, 18, 747–767.
- Barro, R. J. (1996). Determinants of economic growth: A cross-country empirical study. Cambridge, MA: MIT Press Books.
- Basile, R., Capello, R., & Caragliu, A. (2012). Technological interdependence and regional growth in Europe: Proximity and synergy in knowledge spillovers. Papers in Regional Science, 91(4), 697–722.
- Bathelt, H., Malmberg, A., & Maskell, P. (2004). Clusters and knowledge: Local buzz, global pipelines and the process of knowledge creation. Progress in Human Geography, 28, 31–56.
- Baum-Snow, N., Henderson, J. V., Turner, M. A., Zhang, Q., & Brandt, L. (2020). Does investment in national highways help or hurt hinterland city growth? Journal of Urban Economics, 115, 103124.
- Belderbos, R., Benoit, F., & Derudder, B. (2022). World city innovation and service networks and economic growth. Papers in Regional Science, 101(4), 979–999.
- Benhabib, J., & Spiegel, M. M. (1994). The role of human capital in economic development evidence from aggregate cross-country data. Journal of Monetary Economics, 34, 143–173.
- Bird, J., Lebrand, M., & Venables, A. J. (2020). The belt and road initiative: Reshaping economic geography in Central Asia? Journal of Development Economics, 144, 102441.
- Boschma, R. A. (2005). Proximity and innovation: A critical assessment. Regional Studies, 39, 61–74.
- Burger, M., & Meijers, E. (2016). Agglomerations and the rise of urban network externalities. Papers in Regional Science, 95, 5–15.
- Burger, M., Meijers, E., Hoogerbrugge, M., & Masip Tresserra, J. (2015). Borrowed size, agglomeration shadows and cultural amenities in North-West Europe. European Planning Studies, 23, 1090–1109.
- Camagni, R., Capello, R., & Caragliu, A. (2015). The rise of second-rank cities: What role for agglomeration economies? European Planning Studies, 23, 1069–1089.
- Camagni, R., Capello, R., & Caragliu, A. (2016). Static vs. dynamic agglomeration economies. Spatial context and structural evolution behind urban growth. Papers in Regional Science, 95, 133–158.
- Capello, R. (2000). The city network paradigm: Measuring urban network externalities. Urban Studies, 37, 1925–1945.
- Capello, R. (2020). Proximity and regional competitiveness. Scienze Regionali, 19(3), 373–394.
- Capello, R., & Camagni, R. (2000). Beyond optimal city size: An evaluation of alternative urban growth patterns. Urban Studies, 37, 1479–1496.
- Capello, R., Caragliu, A., & Fratesi, U. (2018). Breaking down the border: Physical, institutional and cultural obstacles. Economic Geography, 94(5), 485–513.
- Chatman, D., & Noland, R. (2014). Transit service, physical agglomeration and productivity in US metropolitan areas. Urban Studies, 51, 917–937.
- Chen, M., Gong, Y., Li, Y., Lu, D., & Zhang, H. (2016). Population distribution and urbanization on both sides of the Hu Huanyong line: Answering the premier’s question. Journal of Geographical Sciences, 26(11), 1593–1610.
- Cicerone, G., McCann, P., & Venhorst, V. (2020). Promoting regional growth and innovation: Relatedness, revealed comparative advantage and the product space. Journal of Economic Geography, 20, 293–316.
- Dai, L., Derudder, B., Cao, Z., & Ji, Y. (2023). Examining the evolving structures of intercity knowledge networks: The case of scientific collaboration in China. International Journal of Urban Sciences, 27(3), 371–389.
- Devriendt, L., Derudder, B., & Witlox, F. (2008). Cyberplace and cyberspace: Two approaches to analyzing digital intercity linkages. Journal of Urban Technology, 15(2), 5–32.
- Drucker, J. (2012). The spatial extent of agglomeration economies: Evidence from three US manufacturing industries. US Census Bureau Center for Economic Studies Paper No. CES-WP-12-01.
- Duranton, G., & Puga, D. (2004). Micro-foundations of urban agglomeration economies. In J. V. Henderson, & J.-F. Thisse (Eds.), Handbook of regional and urban economics 4 (pp. 2063–2117). Amsterdam.: Elsevier.
- Faber, B. (2014). Trade integration, market size, and industrialization: Evidence from China's National Trunk Highway System. Review of Economic Studies, 81(3), 1046–1070.
- Fang, C., & Yu, D. (2017). Urban agglomeration: An evolving concept of an emerging phenomenon. Landscape and Urban Planning, 162, 126–136.
- Fang, C., Yu, X., Zhang, X., Fang, J., & Liu, H. (2020). Big data analysis on the spatial networks of urban agglomeration. Cities, 102, 102735.
- Florida, R., Gulden, T., & Mellander, C. (2008). The rise of the mega-region. Cambridge journal of regions, economy and society, 1(3), 459–476.
- Galaso, P., & Kovářík, J. (2021). Collaboration networks, geography and innovation: Local and national embeddedness. Papers in Regional Science, 100(2), 349–377.
- Glaeser, E. (2011). Triumph of the city. New York, NY: The Penguin Group.
- Glaeser, E., Kolko, J., & Saiz, A. (2001). Consumer city. Journal of Economic Geography, 1, 27–50.
- Glaeser, E., Ponzetto, G., & Zou, Y. (2016). Urban networks: Connecting markets, people, and ideas. Papers in Regional Science, 95(1), 17–59.
- Gordon, I., & McCann, P. (2000). Industrial clusters: Complexes, agglomeration and/or social networks? Urban Studies, 37, 513–532.
- Gregory, I., Cooper, D., Hardie, A., & Rayson, P.. (2015). Spatializing and analyzing digital texts: Corpora, GIS, and places. In D.J. Bodenhamer, J. Corrigan, & T.M. Harris (Eds.), Deep maps and spatial narratives (pp. 150–178). Bloomington, IN: Indiana University Press.
- Guo, H., Zhang, W., Du, H., Kang, C., & Liu, Y. (2022). Understanding China’s urban system evolution from web search index data. EPJ Data Science, 11(1), 20.
- Harrison, J., & Gu, H. (2019). Planning megaregional futures: Spatial imaginaries and megaregion formation in China. Regional Studies, 55, 77–89.
- Hill, L. (2009). Georeferencing: The geographic associations of information. Cambridge, MA: MIT Press.
- Howard, E. (1898). Garden cities of To-morrow. London: Swan Sonnenschein and Co. Ltd.
- Hu, X., Wang, C., Wu, J., & Stanley, H. E. (2020). Understanding interurban networks from a multiplexity perspective. Cities, 99, 102625.
- Huang, Y., Hong, T., & Ma, T. (2020). Urban network externalities, agglomeration economies and urban economic growth. Cities, 107, 102882.
- Jiao, J., Wang, J., Zhang, F., Jin, F., & Liu, W. (2020). Roles of accessibility, connectivity and spatial interdependence in realizing the economic impact of high-speed rail: Evidence from China. Transport Policy, 91, 1–15.
- Johansson, B., & Quigley, J. (2004). Agglomeration and networks in spatial economics. Papers in Regional Science, 83, 165–176.
- Krugman, P. (1980). Scale economies, product differentiation, and the pattern of trade. The American Economic Review, 70, 950–959.
- Krugman, P. (1995). Increasing returns, imperfect competition and the positive theory of international trade. Handbook of International Economics, 3, 1243–1277.
- Lang, R. E., Lim, J., & Danielsen, K. A. (2020). The origin, evolution, and application of the megapolitan area concept. International Journal of Urban Sciences, 24(1), 1–12.
- Lao, X., Zhang, X., Shen, T., & Skitmore, M. (2016). Comparing China's city transportation and economic networks. Cities, 53, 43–50.
- Li, J., & Jiang, Y. (2016). Calculation and empirical analysis on the contributions of R&D spending and patents to China’s economic growth. Theoretical Economics Letters, 6, 1256.
- Li, W., Sun, B., & Zhang, T. (2019). Spatial structure and labour productivity: Evidence from prefectures in China. Urban Studies, 56, 1516–1532.
- Li, Y., & Phelps, N. (2019). Megalopolitan glocalization: The evolving relational economic geography of intercity knowledge linkages within and beyond China’s Yangtze River Delta region, 2004-2014. Urban Geography, 40, 1310–1334.
- Liu, Y., Wang, F., Kang, C., Gao, Y., & Lu, Y. (2014). Analyzing relatedness by toponym co-occurrences on web pages. Transactions in GIS, 18, 89–107.
- Ma, H., & Xu, X. (2023). The effects of proximities on the evolving structure of intercity innovation networks in the Guangdong–Hong Kong–Macao Greater Bay Area: Comparison between scientific and technology knowledge. International Journal of Urban Sciences, 27(3), 390–413.
- Marshall, A. (1920). Principles of economics (8th Ed.). London.: Macmillan.
- McCann, P., & Acs, Z. (2011). Globalization: Countries, cities and multinationals. Regional Studies, 45, 17–32.
- Meijers, E., & Burger, M. (2010). Spatial structure and productivity in US metropolitan areas. Environment and Planning A, 42, 1383–1402.
- Meijers, E., & Burger, M. (2017). Stretching the concept of ‘borrowed size’. Urban Studies, 54, 269–291.
- Meijers, E., Burger, M., & Hoogerbrugge, M. (2016). Borrowing size in networks of cities: City size, network connectivity and metropolitan functions in Europe. Papers in Regional Science, 95, 181–198.
- Meijers, E., Hoekstra, J., Leijten, M., Louw, E., & Spaans, M. (2012). Connecting the periphery: Distributive effects of new infrastructure. Journal of Transport Geography, 22, 187–198.
- Meijers, E., & Peris, A. (2019). Using toponym co-occurrences to measure relationships between places: Review, application and evaluation. International Journal of Urban Sciences, 23, 246–268.
- Melo, P., Graham, D., & Noland, R. (2009). A meta-analysis of estimates of urban agglomeration economies. Regional Science and Urban Economics, 39, 332–342.
- Newman, M. (2010). Networks: An introduction. Oxford: Oxford University Press.
- Niu, F., & Li, J. (2018). Visualizing the intercity railway network in Mainland China. Environment and Planning A: Economy and Space, 50(5), 945–947.
- Otsuka, A. (2020). Inter-regional networks and productive efficiency in Japan. Papers in Regional Science, 99, 115–133.
- Overell, S., & Rüger, S. (2008). Using co-occurrence models for placename disambiguation. International Journal of Geographical Information Science, 22, 265–287.
- Parr, J. (2002). Agglomeration economies: Ambiguities and confusions. Environment and Planning A, 34, 717–731.
- Parr, J. (2004). The polycentric urban region: A closer inspection. Regional Studies, 38, 231–240.
- Petralia, S., Balland, P.-A., & Rigby, D. (2016). Unveiling the geography of historical patents in the United States from 1836 to 1975. Scientific Data, 3(160074), 1–14.
- Phelps, N. (2021). City systems research: From morphology to relationality and positionality. International Journal of Urban Sciences, 25(4), 480–500.
- Phelps, N., Fallon, R., & Williams, C. (2001). Small firms, borrowed size and the urban-rural shift. Regional Studies, 35, 613–624.
- Phelps, N., Miao, J., & Zhang, X. (2023). Polycentric urbanization as enclave urbanization: A research agenda with illustrations from the Yangtze River Delta Region (YRDR), China. Territory, Politics, Governance, 11(2), 261–280.
- Porter, C., Atkinson, P., & Gregory, I. (2015). Geographical text analysis: A new approach to understanding nineteenth-century mortality. Health & Place, 36, 25–34.
- Pumain, D. (2021). From networks of cities to systems of cities. In Z. Neal, & C. Rozenblat (Eds.), Handbook of cities and networks (pp. 16–40). Cheltenham: Edward Elgar Publishing.
- Rosenthal, S. S., & Strange, W. C. (2004). Evidence on the nature and sources of agglomeration economies. In V. Henderson & J.F. Thisse (Eds.), Handbook of regional and urban economics (Vol. 4, pp. 2119–2171). Amsterdam: Elsevier.
- Ross, C., Woo, M., & Wang, F. (2016). Megaregions and regional sustainability. International Journal of Urban Sciences, 20(3), 299–317.
- Salvini, M., & Fabrikant, S. (2016). Spatialization of user-generated content to uncover the multirelational world city network. Environment and Planning B: Planning and Design, 43(1), 228–248.
- Sassen, S. (2007). Megaregions: Benefits beyond sharing trains and parking lots. In K.S. Goldfeld (Ed.), The economic geography of megaregions (pp. 59–83). Princeton, NJ: Policy Research Institute for the Region.
- Schilling, M., & Phelps, C. (2007). Interfirm collaboration networks: The impact of large-scale network structure on firm innovation. Management Science, 53(7), 1113–1126.
- Schweitzer, F., Fagiolo, G., Sornette, D., Vega-Redondo, F., Vespignani, A., & White, D. (2009). Economic networks: The new challenges. Science, 325(5939), 422–425.
- Sebestyén, T., & Varga, A. (2013). Research productivity and the quality of interregional knowledge networks. The Annals of Regional Science, 51(1), 155–189.
- Shi, S., & Pain, K. (2020). Investigating China’s Mid-Yangtze River economic growth region using a spatial network growth model. Urban Studies, 57, 2973–2993.
- Short, J., Kim, Y., Kuus, M., & Wells, H. (1996). The dirty little secret of world cities research: Data problems in comparative analysis. International Journal of Urban and Regional Research, 20, 697–717.
- Sohn, C., Licheron, J., & Meijers, E. (2022). Border cities: Out of the shadow. Papers in Regional Science, 101(2), 417–438.
- Tobler, W., & Wineburg, S. (1971). A Cappadocian speculation. Nature, 231, 39–41.
- Tongjing, W., Yin, Z., Bao, Z., & Meijers, E. (2022). Dataset ofintercity relationships between 293 Chinese cities extractedand classified on the basis of toponym co-occurrences onCommon Crawl. https://www.researchgate.net/publication/362952059_Dataset_of_intercity_relationships_between_293_Chinese_cities_extracted_and_classified_on_the_basis_of_toponym_co-occurrences_on_Common_Crawl.
- Van Meeteren, M., Neal, Z., & Derudder, B. (2016). Disentangling agglomeration and network externalities: A conceptual typology. Papers in Regional Science, 95(1), 61–80.
- Waldfogel, J. (2008). The median voter and the median consumer: Local private goods and population composition. Journal of Urban Economics, 63, 567–582.
- Watts, D. (2004). The “new” science of networks. Annual Review of Sociology, 30, 243–270.
- Wei, Y., Huang, C., Lam, P. T., & Yuan, Z. (2015). Sustainable urban development: A review on urban carrying capacity assessment. Habitat International, 46, 64–71.
- Yao, L., Li, J., & Li, J. (2020). Urban innovation and intercity patent collaboration: A network analysis of China’s national innovation system. Technological Forecasting and Social Change, 160, 120185.
- Yuan, Y., & Medel, M. (2016). Characterizing international travel behavior from geotagged photos: A case study of Flickr. PloS one, 11, e0154885.
- Zhen, F., Wang, B., & Chen, Y. (2012). China's city network characteristics based on social network space: An empirical analysis of sina micro-blog. Acta Geographica Sinica, 67(8), 1031–1043.
- Zhong, X., Liu, J., Gao, Y., & Wu, L. (2017). Analysis of co-occurrence toponyms in web pages based on complex networks. Physica A: Statistical Mechanics and its Applications, 466, 462–475.