
 ?Mathematical formulae have been encoded as MathML and are displayed in this HTML version using MathJax in order to improve their display. Uncheck the box to turn MathJax off. This feature requires Javascript. Click on a formula to zoom.
ABSTRACT
Recent research shows that automated decision-making systems based on Artificial Intelligence (AI) may lead to perceived unfairness and bias, especially in some sensitive areas. There is no universal debiasing solution for AI applications and systems. This paper proposes a bias-reducing framework based on contextual knowledge graphs for decision-making systems to help analyse and detect potential bias factors during system operation in near-real time. In particular, the contextual knowledge graph is designed to learn the relations between current tasks and corresponding features and explore the correlation among data, context and tasks. Three bias assessment metrics (i.e., label bias, sampling bias and timeliness bias) are proposed to measure, quantify and qualitatively define the bias level for the pre- and post-modelling. The trained model using debiased datasets combines contextual knowledge to support fairer decision-making. Experimental results show that the proposed method is more effective in supporting fairer decision- making than the existing methods.
1. Introduction
Artificial Intelligence (AI) based systems and applications rely on accurate predictions and classifications generated by different Machine Learning (ML) models to provide intelligent services for various use case scenarios in our daily lives. In the past decades, the application and popularisation of AI and ML technology have indeed brought unprecedented convenience to our lives, such as efficient handling of big data, discovering patterns from complex relationships, location recommendations (Huang, Deng, Xie, et al., Citation2020), and accurately predicting weather and traffic congestion (Huang, Deng, & He, Citation2020). As these AI-enabled applications play an increasingly important role in various aspects, the performance of these AI-ML models has attracted significant attention, which also poses a new challenge: Are the predictions of ML models really fair and objective? One of the points worth highlighting is how to correctly apply such models and predicted results to support users in making fair decisions, especially in some sensitive use cases, which may significantly impact a certain category, vulnerable group or an individual. e.g. Recidivism prediction instruments (Chouldechova, Citation2017), such as COMPAS, can provide decision-makers with an estimate of the likelihood that a criminal defendant will reoffend at some point in the future, but have generated tremendous controversy due to their involvement in potential discriminatory biases (i.e. bias against people of colour) in risk assessments. In particular, high-risk misclassification will have a direct adverse impact on the outcome of a criminal defendant’s trial.
We have found some examples of bias and unfairness in real-world AI applications, such as gender bias in AI chatbots (Feine et al., Citation2020) and employment matching (Houser, Citation2019), race bias in face recognition (Robinson et al., Citation2020), regional prejudice in advertising placement strategies, and preference bias in search engines and so on. Some researchers have recognised the impact of unfair decision-making for different domains, and there are studies that attempt to address these biases. For example, error rate balance and statistical parity are used to tune classifiers and revisit predictive parity (Dieterich et al., Citation2016). Making fair decisions is important because it may have significant impact on different groups or individuals in various use case scenarios, e.g. loan risk assessment, customer purchasing power prediction and product recommendations. However, to properly solve such problems, a comprehensive analysis of the causes of decision bias is required. In this paper, we identify the fairness as follows: in the decision-making process, fairness refers to the absence of any bias or favouritism based on hidden or neglected features against certain category (Liu et al., Citation2021), while an unfair model refers to its predictions being biased towards a particular category of entities. Therefore, biased decisions arise either because of the individual choice with preference from the decision maker, or because of misleading decision-making by the unbalanced output from the AI-ML models. For the former, existing solutions mainly set a series of rules and criteria to assist decision makers in making fair decisions. For the latter, developing an unbiased model to support fair decision making is the ideal though hard solution.
In order to build bias-reduced decision support systems, better methods must first be considered to identify and avoid the bias, and thus it is necessary to comprehensively analyse how the system introduces bias from the design to implementation and then transfers it to an operational phase. Specifically, AI systems may introduce bias in their design. Before starting to build a specific system, developers often make some assumptions about what should be built, who should be the potential user, what features and services should be pre-designed, and how the system should work. For example, potential gender bias happens in the chatbot design, i.e. Female-by-Default chatbot designs. Most of the chatbots are described as female chatbots by default, particularly evident in three application domains, i.e. branded conversations, customer service and sales, such as Siri (Feine et al., Citation2020). Therefore, a new strategy that meets comprehensive considerations is needed to guide system development. In terms of AI-ML models, most AI applications are data-driven and require data for training. Biased training data sets are often considered to be one of the critical factors affecting the fairness of machine learning. Using these imbalanced datasets to train AI-ML models will inevitably introduce bias into these pre- trained models, thus resulting in biased predictions. For example, a vehicle detection model may misclassify or miss the detection for buses, if the training dataset is mostly relates to cars and trucks. Therefore, removing the bias in the training data is an effective way for modelling unbiased AI-ML models. Although there are some studies that have started to debias the datasets, the existing studies mainly focus on individual datasets, such as gender, race, face features or privacy information. For example, a mechanism (an adaptive threshold that varies depending on the characteristics of detected facial attributes, e.g. gender and ethnicity) is proposed (Robinson et al., Citation2020) to mitigate problems of bias using Balanced Faces in the Wild (BFW) dataset with eight subgroups balanced across gender and ethnicity: data balanced for gender and ethnic groups. In another example, Pujol et al., (Citation2020) propose randomised differentially private algorithms to measure the fairness in the context, and then the privacy-protected data is used for fair decision-making. However, in terms of AI-based decision systems, there is no universal debiasing solution for pervasive AI applications and systems. Therefore, developing a generic approach that can quantify, reduce and mitigate bias to support fair decision-making is challenging but also promising.
Based on the above discussion and to address the identified knowledge gap, this paper proposes a systematic framework based on contextual knowledge graphs for bias-reduced decision support systems. In particular, our method provides a strategy that can comprehensively consider the relevant context and mitigate biased features/labels in the model dataset, and then the AI-ML model trained by the debiased dataset and combined with the contextual knowledge graph can well support fair decision- making, thereby enabling ideally bias-free or bias-reduced decision support systems. The contributions of this paper include:
A bias-reduced decision support system framework is proposed to help comprehensively analyse potential bias factors during system design and development and during the operational phase, in which the contextual knowledge graph is designed to learn task-related context representations to identify possible biases in an interpretable manner.
By exploring fairness variables in the machine learning modelling process, three bias assessment metrics (i.e. label bias, sampling bias and timeliness bias) are proposed to measure, quantify and qualitatively define the bias level in the model data set, hence, ensuring trained AI-ML models are bias- reduced by filtering out bias in imbalanced datasets.
One motivating use case scenario is used to evaluate the performance of the proposed method and to demonstrate how different features and data distributions affect the AI-ML model’s prediction performance in terms of fairness and the important role that contextual knowledge plays in fair decision-making. Experimental results indicate that the proposed method can more effectively support fair decision-making compared with existing methods.
The rest of the paper is organised as follows: Section 2 presents related work; Section 3 presents the proposed method, including definitions, contextual knowledge graph and detailed methodology; Section 4 demonstrates the experiment and discusses the performance; Section 5 concludes the paper.
2. Related work
2.1. Fairness in decision-making
A decision support system is an interactive system designed to provide the most relevant information of the current context to support decision-making activities (Burstein et al., Citation2010, Citation2011)[30]. Driven by AI technology, AI-ML models play the core role in decision support systems. The introduction of AI in decision- making can reduce human subjectivity, and a reliable AI model will abate the issue caused by unconscious biases in human decision-making to achieve fair decision-making (Houser, Citation2019). For example, to mitigate unconscious bias (i.e. bias in intuition and personal opinion) in employment decisions and talent-management practices. However, researchers have found unfair decision-making exists in AI- powered applications and systems. For example, an investigation into a recidivism prediction software (COMPAS) found a bias against African-Americans (Chouldechova, Citation2017). The definition of fairness involves three types: individual fairness, group fairness and causality-based fairness notions (Xu et al., Citation2020). Inherent or sensitive attributes that represent a specific group or individual are often the source of discriminatory bias in data sets, e.g. race. In (Xu et al., Citation2020), a Derivable Conditional Fairness Regularizer is proposed to track the trade-off between precision and fairness of algorithmic decision making. In (Zhang and Bareinboim, Citation2018), the language of structural causation is proposed to derive the causal explanation formula from counterfactual direct, indirect and spurious effects to evaluate fairness for automated systems. In (Burstein et al., Citation2010, Citation2011), context awareness is mentioned to support a dynamic decision-making process, especially when the context is constantly changing and decision outcomes are time critical. In particular, context and context-awareness are emphasised for introduction into decision support systems, as they can improve efficiency and enhance the user experience by intelligently providing satisfactory outcomes in the decision-making.
2.2. Bias and fairness in machine learning
There are multiple definitions of bias and fairness in the machine learning literature (Verma & Rubin, Citation2018). In prediction models for classification, fairness is considered a trade-off for the accuracy of the classifiers (Corbett-Davies et al., Citation2017). Classifying target relationships can be used to determine the bias of sensitive relationships. Biased training data sets are often considered to be one of the important factors affecting the fairness of machine learning, because most machine learning models are obtained by pre-training on large labelled data sets (Mehrabi et al., Citation2021). Mehrabi et al. (Citation2021). investigate different real-world applications where bias exists and identify three main potential sources that affect unfair outputs of AI-based applications: 1) bias in the data; 2) bias in algorithms; and 3) bias in user interaction loop (e.g. bias in design and evaluation criteria). In particular, data bias can be defined as measurement bias, omitted variable bias, representation bias, aggregation bias, sampling bias, longitudinal data fallacy and linking bias. Regarding bias in algorithms, mainstream machine learning techniques are ‘black box’ characteristics by the automated process of training and prediction, which is difficult to explain fully by its mechanisms. Thus, the fairness of the model output is doubtful (Mehrabi et al., Citation2021). Furthermore, algorithms can even amplify and perpetuate existing biases in the data (Mehrabi et al., Citation2021). Examples include Neural Networks (NNs), Logistic Regression (LR) and Support Vector Machine (SVM). When inputting a large amount of data with labels (e.g. prediction or classification task), these algorithms learn patterns of the training data to predict the labels of the testing data. During the learning process, the model maximises any learned features to improve the model accuracy, including biased features. In terms of bias in design, the algorithm itself is the projection of the preferences of developers, and as the algorithm continues to learn, these selection tendencies will gradually be solidified in the AI systems, thus forming decision bias. Many attempts have been made to address bias in AI-ML models to support fair decision-making (Wang et al., Citation2017). Three ways are defined as: (1) in the pre-processing phase, screening and transforming the training data to eliminate the underlying bias/discrimination; (2) in the learning phase, modifying the algorithms and adding constraints to remove bias/discrimination during the training process; (3) In the prediction phase, optimising and post-processing the output to ensure the fairness. Although there are various definitions and classification of fairness and bias for machine learning models in the existing literature, they are imperfect when considering the whole decision making process, especially ignoring the context changes. Thus, a new definition is required based on a comprehensive analysis and full consideration.
3. Methodology
In this section, we present relevant technical background and detail our proposed method.
3.1. Problem definition
In AI applications, the purpose of machine learning models is to learn underlying rules from target datasets (Liu et al., Citation2021). For example, in a prediction task of supervised learning, there is a dataset with known inputs X and outputs Y. By training the sample datasets with labels, the AI-ML model learns relationships and builds a mapping f from input X to output Y, i.e. f: X→ Y. Thus, the trained model can make predictions for unlabelled input xi, represented by y’ = f (xi). In this modelling process, the sample data selected for training will play a decisive role in the performance of the trained model. There are two circumstances: 1) the dataset with bias; 2) the dataset without bias. For the first circumstance, when bias exists in the datasets, the model will not be able to learn the true rules, and thus the trained model may exhibit bias towards certain categories or views while ignoring others. Such bias can lead to unfair outcomes or misleading decision-making. That is, a lack of diversity in a data set can lead to model bias and fairness issues. Therefore, removing the bias in the training data is crucial. For the second circumstance, when there is no bias in the dataset, the pre-trained machine learning models can output prediction with a certain degree accuracy. However, since ML models with different architectures perform differently even on the same dataset (Huang, He, et al., Citation2020), how to support fair decision-making also depends on the context related to the current task. Thus, a novel approach that can provide comprehensive contextual information relevant to the task will be essential for enabling bias-reduced decision support systems.
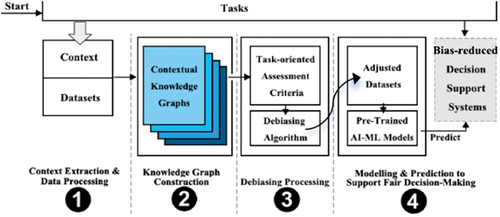
Therefore, this paper proposes a systematic approach based on the bias assessment metric and contextual knowledge graphs, aiming to build bias-reduced decision support systems by mitigating the biased features/labels in the datasets and providing comprehensive contextual knowledge to support fair decision-making. The overall design of the proposed method is illustrated in . The framework consists of four main steps. Specifically, step-1, contextual information relevant to the task is extracted, and the data is pre-processed according to the received task. Step-2, parsing the task and constructing contextual knowledge graphs are used to identify bias from the model dataset. Step-3, bias assessment metrics are calculated to measure and quantify bias levels, and filter out potential bias in imbalanced datasets. Step-4, adjusted datasets are used for training and modelling AI-ML models to ensure reduced bias in the output predictions, combined with the contextual knowledge to support fair decision-making of the AI system, thereby enabling a bias-reduced decision support system.
Figure 1. The overall design of the proposed framework for bias-reduced decision support systems.
Note that, sometimes the bias in machine learning may be necessary and justified depending on the circumstances. However, model bias against social classes such as a particular race or gender is undesirable, especially when such bias violates accepted social fairness norms. Thus, such sensitive attributes or biased features need to be protected in machine learning.
3.2. Contextual knowledge graph
A Knowledge Graph (KG), viewed as a semantic network with a structured knowledge base, can be used to comprehensively describe entities (e.g. concepts) and their relationships in the physical world (Wang et al., Citation2017). Its powerful semantic processing capability enables massive amounts of information to be organised and managed more efficiently, especially in the big data environment. As mentioned earlier, whether data bias will be introduced into the model depends on the context and specific task. How to identify these biases is a critical step. However, there are currently no ready-made methods that can comprehensively reveal biases in data sets. Context refers to location, identity of nearby objects (including people), time, surrounding environment (e.g. temperature) and their changes, as well as users’ emotions and preferences (Huang et al., Citation2022). Who, What, Where, When and Why are defined as the minimum context information (Abowd & Mynatt, Citation2000). In Brézillon, Citation2005, context can be grouped into the local context (or micro context) and global context (or macro context). The contextual graph is proposed as a new and uniform way to represent knowledge and model task accomplishment (Brézillon, Citation2005), where the context is considered as two kinds of knowledge: external knowledge unrelated to the decision process and contextual knowledge related to the decision-making. Inspired by the above, we propose a contextual knowledge graph approach to capture the relation between the current task and corresponding features, and explore the correlation among data, context and tasks, thus identifying bias in AI-ML model datasets. (Note that, the contextual information can be perceived, derived, reasoned about, computed, or explicitly entered by the user (Burstein et al., Citation2011). We define the following:
Definition 1: Contextual Knowledge Graph Ontology.
Generally, ‘a knowledge graph consists of a set of interconnected typed entities and their attributes’ (Panet al., 2017). A fact can be represented by a structured unit, consisting of entities or concepts, relations and semantic descriptions. That is, the basic unit of a typical knowledge graph is the triad composed of ‘node – edge – node’. In our method, the contextual knowledge graph is a set of knowledge graphs, and each sub-graph uses the task as a focus and the corresponding context as nodes, where the edge represents the relevance or relation. Here, we consider the contextual information from five aspects and map it to machine learning tasks: who, what, where, when and why. That is, ‘who’ refers to the target involved in the current task, e.g. the user; ‘what’ refers to the specific circumstances related to the task, e.g. requirements; ‘where’ refers to the spatial environment in which the task occurs, e.g. a specific location or area; ‘when’ refers to the temporal context in which the task occurs or is applicable, e.g. peak hours; and ‘why’ refers to a predefined setting or preconditions, e.g. when it rains. Thus, each machine learning task can construct a contextual knowledge graph according to the above definition. An example is shown in . Note that, the number of relevant context nodes may vary depending on the specific task, so the contextual knowledge graph can be constructed according to the actual situation. Based on the constructed contextual knowledge graph, we can check the relevant context in accordance with the Bias Assessment Metrics (see details in Section 3.3).
Figure 2. An example of contextual knowledge graph ontology.
3.3. Bias assessment metrics
To enable bias-reduced decision support systems, construction of an unbiased model is an important part, while the key to modelling is to overcome the bias issue caused by imbalanced training datasets. As most machine learning models are obtained by pre-training on large labelled data sets, assessing whether a training data set will introduce bias is not a simple question, which involves various relevant factors and complex evaluation criteria, as well as further comprehensive analysis. Bias in the training datasets can be analysed from both the quantity and quality. When the amount of data is insufficient, that is, the collected features and categories are highly likely to be uneven or inconsistent, which cannot cover all attributes of the target data. And there is also measurement-caused bias when data are mislabelled or classified. As a whole, we summarise three main biases in modelling: 1) Label Bias: which refers the imbalance of the distribution of labels or categories in the training data set. An imbalanced dataset means that some elements or features in the dataset have greater weight or representation than others, and do not accurately cover the use case of the model, leading to unfairness, poor accuracy and incorrect results. e.g. unbalanced female to male ratio. 2) Sampling Bias: which refers the inconsistency of training datasets and testing datasets. The trained model learns biased features from the training data and outputs unfair predictions. 3) Timeliness Bias: which refers to the change in the context represented before and after modelling. Thus, the trained model fails to adapt to the new data or changing situations, leading to biased predictions. Therefore, to support unbiased decision-making, when task context changes, the decision support system should capture relevant contextual information and consider these changes to ensure fair decisions (Burstein et al., Citation2011). Thus, acquiring and sharing contextual knowledge (Brézillon, Citation2005) in a dynamic manner is a key step in solving Timeliness Bias.
For the above two types of bias, we propose new quantitative assessment metrics that can be used for bias detection in machine learning models while Metric 3 is rather a qualitative criterion.
Bias Assessment Metric 1: To measure the label bias, first, the sample data is counted according to different labels, represented by x1, x2,…, xn (i.e. the total number X = x1 + x2 + … + xn). The ratio of each label in the total data is calculated, represented by p1, p2,…, pn (i.e. pi = xi /X). Selecting the minimum ratio pmin and the maximum ratio pmax, and the bias extreme value and Mean Square Deviation (MSD) are calculated by the following formulas:
(1)
Bias Assessment Metric 2: To measure the sampling bias, the ratios of different categories in the training data and the testing data are calculated according to the above steps respectively, represented by <ptr1, ptr2, …, ptrm> for the training dataset and <pts1, pts2, …, ptsm> for the testing dataset. The bias extreme value and MSD for each category in both data sets are calculated in turn. The sampling bias is calculated by the following formulas:
Bias Assessment Metric 3: To measure the timeliness bias, the assessment mainly relies on analysing the difference of the contextual knowledge graph between the training situation and the prediction situation, i.e. anomaly analysis of the contextual knowledge graph.
Among the above three bias assessment metrics, metric 1 and metric 2 are applicable for the training dataset, i.e. before modelling, while the metric 3 is applicable for the predicted result, i.e. after modelling. To assess the balance of the dataset for training machine learning models, we introduce the radar chart (Shrestha, Citation2002), which is an analytical tool which shows the distribution of several parameters and their relation to each other (Shrestha, Citation2002). In this paper, we introduce radar charts to analyse and visualise the differentiation of features in the datasets. For different tasks and biases, we redefine the indicator and map them into graphs, as shown in . For example, suppose there is a sample dataset with ten labels and six categories. The label bias is visualised using a Radar Chart, as shown in , and the sampling bias is visualised using a Radar Chart, as shown in . In , after mapping the ratio of each feature into the radar chart, it can be directly observed that feature 10 is the label bias. In , after mapping the ratio of each category for the training data set and the testing data set into the radar chart, it can be observed that there is a sampling bias for category 6. In terms of metric 3, there is an example in to illustrate the principle. In , the timeliness bias is measured by comparing two contextual knowledge graphs corresponding to the pre-modelling situation (i.e. training) and post-modelling situation (i.e. prediction), respectively. As shown in the , there is a set of changing contexts and relations. Since the constructed contextual knowledge graph varies for different tasks, case-by-case analysis is needed to determine whether these changes may introduce bias.
Figure 3. Visualising the label bias and sampling bias using radar charts.
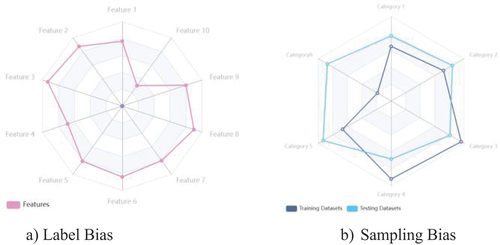
Figure 4. Assessing the timeliness bias by comparing the difference in contextual knowledge graphs for pre- and post-modelling situations.
By backtracking, fair decision-making is inseparable from the specific tasks of the AI-ML model, which can be seen from the fact that existing studies usually focus on particular cases to solve the problem of imbalanced datasets. In a specific task scenario, not all data and context are relevant to the current task directly, and an unbiased AI-ML model is expected to make precise predictions for the current task in a specific context. When we obtain the prediction of the AI-ML model as the output, we still need to combine contextual knowledge to comprehensively consider whether there are potential biases. Thus, the context is important for supporting fair decision-making as the contextual information covers the essential knowledge to ensure the decision-makers react with a fair response (Burstein et al., Citation2011). In other words, the decision-maker is able to make fair decisions in an informed manner.
4. Experimental evaluation
4.1. Motivating scenarios and datasets
In this section, we demonstrate the effectiveness of our proposed method through a motivating use case scenario.
Use Case Scenario: Developing an automatic detection system that can capture licence plate numbers of speeding cars and record the violations in Victoria, Australia. Step 1: Parsing the task and extracting the relevant contextual information to construct the context knowledge graph. Step 2: identifying the possible bias of the model data set and debiasing. Step 3: training the AI-ML model for identifying the licence plate numbers for vehicles. Step 4: System implement and making decisions to record the violated speeding cars. (Note that, the licence plate number recognition process is shown in ).
Figure 5. Some image data samples for the training and testing datasets.
Datasets: The original data set was collected manually, with a total of 4285 images in 33 categories, as shown in and . For testing, licence plate images are collected from CaltechData (Weber & Perona, Citation2022), https://vplates.com.auand https://www.vicroads.vic.gov.au/registration/number-plates, as well as some randomly collected public images using Google searches.
Figure 6. The license plate number recognition process.
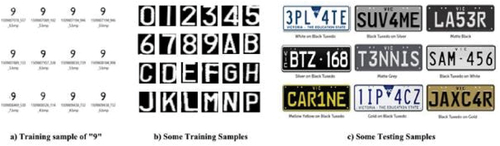
Table 1. The original training data set.
4.2. Bias assessment and debiasing
First, parsing the task and extracting the relevant contextual information are used to construct the contextual knowledge graph and to identify the possible bias in the model data set. Based on the previous definition 1, the contextual knowledge graph can consider the relevant context from five aspects, as shown in . In this use case, ‘Who’, the user, might be Victoria traffic management department or the traffic police. ‘Where’, the area where the system is implemented, can include various designated road segments and locations, such as near schools, internal community roads or highways. ‘When’ means vehicle speeding events being detected. ‘Why’ and ‘What’ include different circumstances, road signs and settings. In addition, there are other predefined settings, for example, vehicles performing special missions may be excluded, including police cars, ambulances and fire trucks on duty. By analysing the contextual knowledge graph, the possible bias of this task includes different regions, different times and different conditions, as listed below:
Generally speaking, licence plates in different countries or regions have different standards in terms of size, fonts, languages, licence plate number patterns, background and foreground colours. Even within a region, these attributes can vary by vehicle type, such as cars, trucks and motorbikes. Knowing these contexts as prior knowledge will help in developing unbiased decision support systems, such as the aspect ratio of the characters and the ratio of various colour pixels in the licence plate image for character segmentation.
Also, most existing solutions are usually specific to the regions where they were designed to operate, i.e. country-specific (Shashirangana et al., Citation2020). For example, in China, there are no letters ‘I’ and ‘O’ used in the vehicle licence plate number, as they are too similar to digital numbers 1 and 0. But in Victoria, Australia, the letter – digital pair ‘I’ and ‘1’ is available (see )). In some other countries, national flags or specific designs may also be used. Thus, the recognition and prediction of the vehicle number licence plate varies in different regions.
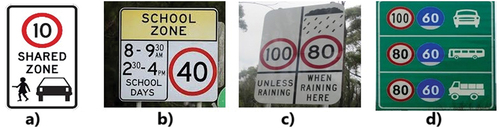
The definition of overspeed driving is different according to the specific limitation of each road segment. e.g. time interval, or geographical area. For example, in Australia and New Zealand, shared zones are areas where pedestrians, cyclists and motorised traffic share the same road space, and special rules (e.g. speed limits) apply to such areas. As shown in ), the speed limit in the shared area is 10 km/h. A school zone refers to an area on a street near a school or near a crosswalk leading to a school, while there are also usually speed limits on these roads. As shown in ), the speed limit in the school zone and specific period of school days (i.e. 8:00–9:30 AM and 2:30–4:00 PM) is 40 km/h. There are other different types of road signs with speed limits shown in .
Other context information may include environment variations, lighting conditions (e.g. bright light, dawn, dusk, night, shadows on vehicles, vehicle headlights), weather conditions (e.g. rainy, snowy, foggy, cloudy, windy etc.), diversity of scenes (e.g. country roads, highways, parking lots, etc), different viewpoints (e.g. rotation and scale), challenging conditions (e.g. occlusions, degraded plates, plate rotations, dirt on plates), and image quality (high and low resolution). Thus, the system requires high compatibility for image recognition.
Figure 7. Some different types of road signs with speed limits. (a) The speed limit in the shared area is 10 km/h; (b) the speed limit in the school zone and specific period of school days is 40 km/h; (c) the speed limit when raining is 80 km/h, otherwise 100 km/h; (d) the different maximum and minimum speed limits for different types of vehicles on expressway.
Secondly, considering different standards of licence plates in different countries and regions, we calculate the data bias of character features/labels in collected licence plate numbers according to bias assessment metrics, i.e. formulas (1), (2), (3) and (4). The bias in the original training data set is shown in . After analysis, the label bias in the original data set exists mainly in the labels ‘I’, ‘A’, ‘B’ and ‘C’, while the sampling bias mainly in the labels ‘A’, ‘B’, ‘8’, ‘5’, ‘1’, ‘7’ and ‘9’. In this use case, in addition to standard number plates, VicRoads also offer custom, or personalised, plates and special interest plates, which can be restyled using a unique letter combination or represent a special interest group, for example, ‘Thoroughbred Country’, ‘Regional plates’, ‘Aboriginal Australia’ plates and many more. There are other naming rule considerations. This means that the currently collected characters (numbers and letters) may not fully cover the licence plate already issued. Therefore, a series of adjustments was made for the dataset (). That is, the ratio of relevant labels was adjusted accordingly, and image samples of licence plate number were re-collected. The adjusted data set is shown in . Note that, the adjustment thresholds and parameters can be set with reference to the average value.
Figure 8. The bias in the original data set. (a) label bias – metric 1: the MSD value; (b) label bias metric 1: the extreme value; (c) sampling bias – metric 2.
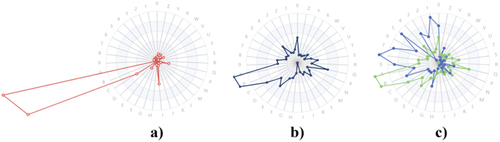
Table 2. The bias assessment and debiasing for the training data set.
Table 3. The adjusted data set.
4.3. Modelling and evaluation
In this system, the images first are pre-processed by converting the RGB image to grey scale, noise removal and binarization (see ). Then we use Convolutional Neural Network (CNN) to train and test the model for vehicle licence plate recognition. The advantage of using CNN is that it can directly take the raw pixel data from the image and act as feature extractors and classifiers on their own, which is widely used in existing studies. For example, in Gnanaprakash et al., Citation2021, the prediction accuracy of character recognition achieved 95.6%. In Kaur et al., Citation2022, an automatic Licence Plate Recognition System for Vehicles Using CNN is proposed, and the overall prediction accuracy is 98.13% to recognise the licence plate of a vehicle. To verify whether the dataset can lead to a biased model, we use the CNN as the target model to train the original data set and the adjusted data set, and then compare and analyse the prediction results, shown in . The system is implemented using Python programming.
Table 4. Model performance comparison.
To quantify the performance of trained models, we utilise classical classification evaluation metrics, i.e. Accuracy (ACC), Precision (P) and Recall (R). Furthermore, to comprehensively evaluate the trade-off between accuracy and precision, the F1-Score is introduced. Specifically, the accuracy represents the proportion of correctly predicted samples to the total number of samples. Precision is the proportion of correctly predicted positive samples among all predicted positive samples. Recall is the proportion of correctly predicted positive samples among all actual positive samples. The F1-Score is a harmonic mean of precision and recall, providing a balanced assessment of the model’s overall performance, as it considers both precision and recall and offers a comprehensive evaluation.
4.4. Discussion and analysis
Based on the above experiments and results, a better performance AI-ML model can be trained through the adjusted revised data set, which is proved on Accuracy (ACC), Precision(P), Recall(R), and F1-Score. With the above use case, we also found some interesting facts: 1) Different features and data distributions affect the model’s prediction performance in terms of fairness. Inequity in data-driven computational models stems from exposure bias – being exposed to a certain type of data distribution that is inconsistent with the expected performance of the model itself. As shown in , the original data set missed sample labels of the letter ‘I’ and delimiter ‘–’; thus, the trained model cannot recognise both characters at all, i.e. the predicting accuracy for ‘I’ and ‘–’ is 0%. 2) some label pairs with similar features are easily affected by biased data sets, while using the debiasing strategy will significantly improve the predicting accuracy, such as ‘8’ and ‘B’, ‘4’ and ‘A’, ‘2’ and ‘Z’, ‘1’ and ‘I’, and so on. In the counterpart method (Shashirangana et al., Citation2020), an ambiguous character set is defined to store some character pairs that are more difficult to distinguish. Hence, if the system finds any character belonging to that set, an additional comparison is performed. Although that algorithm may improve the prediction accuracy to some extent, there are still considerable errors. That method has shown a prediction accuracy rate of 93.6%, precision of 94.14%, recall of 94.88% and F1-Score is reported as 0.945. Compared with (Weber & Perona, Citation2022), our proposed method combined with contextual knowledge (i.e. the different region and licence plate naming rules) to help analysing predicted results and can achieve 98.8% prediction accuracy, 99.89% precision, 100% recall and 0.992 F1-Score. The proposed method can well solve the bias problem existing in the licence plate recognition by CNN models.
5. Conclusion
This paper proposes a bias-reduced decision support system framework based on contextual knowledge graphs to help comprehensively analyse potential bias factors during system design, development and operational phase, aiming to build unbiased AI-Ml models by mitigating/reducing the biased features/labels in the datasets and to provide comprehensive contextual knowledge to support fairer decision-making. In this paper, imposing fairness as a goal of a machine learner could be seen as a trade-off to performance. In the experiment, the machine learning model for licence plate recognition is used as an example to explain how different features and data distributions affect the model’s prediction performance in terms of fairness. A socially fair classifier would need to deviate from the underlying data distribution and introduce fairness to its predictions. A perceived system bias may not be completely avoidable depending on the scenario and use case. A model’s bias towards a social class like a certain race or gender can be undesirable, especially when the bias is against the accepted norms of social fairness. Such attributes or variables that need to be protected from AI algorithm bias are called sensitive or protected attributes, such as gender discrimination, racial bias and age bias in the workplace recruitment. This paper has demonstrated that the proposed approach reduces bias in a considered use case – number plate recognition – and could be extended to other use cases and decision-support applications. For example, in the use case of route navigation for bicycles, assuming that most of the data collected from a specific group of users (e.g. 20–30 years old), that is, relevant features (e.g. the riding speed, reaction time or preferences) occupy the dominant part in the model, it would be likely to generate biased predictions for other users with different features. Another use case, the traffic prediction model may produce biased predictions due to different weather condition, e.g. heavy rain or sunny. The paper argues that the proposed method is applicable to a wider range of possible use cases and scenarios.
Disclosure statement
No potential conflict of interest was reported by the author(s).
Additional information
Funding
Notes on contributors
Guang-Li Huang
Guang-Li Huang is a research fellow at the School of Information Technology, Deakin University, Australia. She received the BSc degree in Computer Science from University of Electronic Science and Technology, China, in 2004. She received her PhD degree in Computer Science from RMIT University, Australia, in 2019. Her research interests include Spatiotemporal Data Mining, Traffic Anomaly Detection, Machine Learning/Deep Learning, Computer Vision and Pattern Recognition.
Arkady Zaslavsky
Arkady Zaslavsky is a Professor of Distributed Systems & Security and Director of CITECORE – Centre for IoT Ecosystem Research and experimentation at Deakin University, Melbourne, Australia. Arkady is leading and participating in R&D projects in Internet of Things, mobile analytics and distributed contextual intelligence science areas. He was a technical leader of the EU Horizon-2020 project bIoTope – building IoT Open Innovation Ecosystem for connected smart objects and in EU FP7 project OpenIoT. Professor Arkady Zaslavsky holds Adjunct-Professorship appointments with a number of Australian and International universities, including La Trobe University, University of Luxembourg and ITMO University, StPetersburg. Arkady Zaslavsky has published more than 400 research publications throughout his professional career and supervised to completion more than 45 PhD students. Arkady Zaslavsky is a Senior Member of ACM, a Senior Member of IEEE Computer and Communication Societies. More information Google Scholar | LinkedIn | ORCID.
References
- Abowd, G.D., & Mynatt, E.D. (2000). Charting past, present, and future research in ubiquitous computing. ACM Transactions on Computer-Human Interaction (TOCHI), 7(1), 29–58. https://doi.org/10.1145/344949.344988
- Brézillon, P. (2005, July). Task-realization models in contextual graphs. In International and Interdisciplinary Conference on Modeling and Using Context (pp. 55–68). Springer
- Burstein, F., Brézillon, P., & Zaslavsky, A. (Eds.). (2010). Supporting real time decision-making: The role of context in decision support on the move (Vol. 13). Springer Science & Business Media.
- Burstein, F., Brézillon, P., & Zaslavsky, A. (2011). Introducing context into decision support on the move. Annals of Information Systems, (13), xxxiii–xxxix. https://doi.org/10.1007/978-1-4419-7406-8_3
- Chouldechova, A. (2017). Fair prediction with disparate impact: A study of bias in recidivism prediction instruments. Big Data, 5(2), 153–163. https://doi.org/10.1089/big.2016.0047
- Corbett-Davies, S., Pierson, E., Feller, A., Goel, S., & Huq, A. (2017, August). Algorithmic decision making and the cost of fairness. KDD ‘17: The 23rd ACM SIGKDD International Conference on Knowledge Discovery and Data Mining, Halifax NS Canada, August 13–17, 2017 (pp. 797–806).
- Dieterich, W., Mendoza, C., & Brennan, T. (2016). COMPAS risk scales: Demonstrating accuracy equity and predictive parity. Northpointe Inc, 7(4), 1–36.
- Feine, J., Gnewuch, U., Morana, S., & Maedche, A. (2020). Gender bias in chatbot design. In A. Folstad, T. Araujo, S. Papadopoulos, E. L. C. Law, O. C. Granmo, E. Luger, & P. B Brandtzaeg (Eds.), Chatbot Research and design: Third international workshop, conversations 2019, Amsterdam, the Netherlands, November 19–20, 2019, revised selected papers 3 (pp. 79–93). Springer International Publishing.
- Gnanaprakash, V., Kanthimathi, N., & Saranya, N. (2021, March). Automatic number plate recognition using deep learning. IOP Conference series: materials science and engineering, Tamil Nadu, India, December 11–12, 2020 (Vol. 1084. pp. 012027). IOP Publishing.
- Houser, K.A. (2019). Can AI solve the diversity problem in the tech industry: Mitigating noise and bias in employment decision-making. Stanford Technology Law Review, 22, 290. https://ssrn.com/abstract=3344751
- Huang, G.L., Deng, K., & He, J. (2020). Cognitive traffic anomaly prediction from GPS trajectories using visible outlier indexes and meshed spatiotemporal neighborhoods. Cognitive Computation, 12(5), 967–978. https://doi.org/10.1007/s12559-020-09735-3
- Huang, G.L., Deng, K., Xie, Z., & He, J. (2020). Intelligent pseudo‐location recommendation for protecting personal location privacy. Concurrency and Computation: Practice and Experience, 32(2), e5435. https://doi.org/10.1002/cpe.5435
- Huang, G.L., He, J., Xu, Z., & Huang, G. (2020). A combination model based on transfer learning for waste classification. Concurrency and Computation: Practice and Experience, 32(19), e5751. https://doi.org/10.1002/cpe.5751
- Huang, G.L., Zaslavsky, A., Loke, S.W., Abkenar, A., Medvedev, A., & Hassani, A. (2022). Context-aware machine learning for intelligent transportation systems: A survey. IEEE Transactions on Intelligent Transportation Systems, 24(1), 17–36. https://doi.org/10.1109/TITS.2022.3216462
- Kaur, P., Kumar, Y., Ahmed, S., Alhumam, A., Singla, R., & Ijaz, M.F. (2022). Automatic license plate recognition system for vehicles using a CNN. Computers Materials & Continua, 71(1), 35–50. https://doi.org/10.32604/cmc.2022.017681
- Liu, W.Y., Shen, C.Y., Wang, X.F., Jin, B., Lu, X.J., Wang, X.L. …& He, J.F. (2021). Survey on fairness in trustworthy machine learning Ruan Jian Xue Bao. Journal of Software, 32(5), 1404–1426.
- Mehrabi, N., Morstatter, F., Saxena, N., Lerman, K., & Galstyan, A. (2021). A survey on bias and fairness in machine learning. ACM Computing Surveys (CSUR), 54(6), 1–35. https://doi.org/10.1145/3457607
- Pan, J.Z., Vetere, G., Gomez-Perez, J.M., & Wu, H. (Eds.). (2017). Exploiting linked data and knowledge graphs in large organisations. Springer.
- Pujol, D., McKenna, R., Kuppam, S., Hay, M., Machanavajjhala, A., & Miklau, G. (2020, January). Fair decision making using privacy-protected data. Proceedings of the 2020 Conference on Fairness, Accountability, and Transparency, Barcelona, Spain, (pp. 189–199).
- Robinson, J.P., Livitz, G., Henon, Y., Qin, C., Fu, Y., & Timoner, S. (2020). Face recognition: Too bias, or not too bias? Proceedings of the IEEE/CVF Conference on Computer Vision and Pattern Recognition Workshops, Glasgow, UK, August 23–28, 2020 (pp. 0–1).
- Shashirangana, J., Padmasiri, H., Meedeniya, D., & Perera, C. (2020). Automated license plate recognition: A survey on methods and techniques. IEEE Access, 9, 11203–11225. https://doi.org/10.1109/ACCESS.2020.3047929
- Shrestha, G. (2002). Radar charts: A tool to demonstrate gendered share of resources. Gender, Technology and Development, 6(2), 197–213. https://doi.org/10.1080/09718524.2002.11910044
- Verma, S., & Rubin, J. (2018, May). Fairness definitions explained. Proceedings of the international workshop on software fairness, Gothenburg Sweden (pp. 1–7).
- Wang, Q., Mao, Z., Wang, B., & Guo, L. (2017). Knowledge graph embedding: A survey of approaches and applications. IEEE Transactions on Knowledge and Data Engineering, 29(12), 2724–2743. https://doi.org/10.1109/TKDE.2017.2754499
- Weber, M., & Perona, P. (2022). Caltech cars 1999 (1.0) [data set]. CaltechDATA. https://doi.org/10.22002/D1.20084
- Xu, R., Cui, P., Kuang, K., Li, B., Zhou, L., Shen, Z., & Cui, W. (2020, August). Algorithmic decision making with conditional fairness. KDD ‘20: 26th ACM SIGKDD international conference on knowledge discovery & data mining July 6 –10, 2020 Virtual Event CA USA (pp. 2125–2135).
- Zhang, J., & Bareinboim, E. (2018, April). Fairness in decision-making—the causal explanation formula. Proceedings of the AAAI Conference on Artificial Intelligence (Vol. 32).