
 ?Mathematical formulae have been encoded as MathML and are displayed in this HTML version using MathJax in order to improve their display. Uncheck the box to turn MathJax off. This feature requires Javascript. Click on a formula to zoom.
ABSTRACT
Blockage of cross-drainage hydraulic structures is a key factor to be recursively assessed within flood management domain because of its involvement in originating flash floods. However, this issue has been least addressed in literature because of highly complex nature of blockage formulation and unavailability of relevant data to investigate the hydraulic impacts of blockage. Given the success of data-driven approaches in dealing with complex real-world problems within water resources management domain (e.g. water depth estimation, ground water prediction, water demand forecasting, drainage pipe detection, sewer fault detection), this paper proposes the idea of an Artificial Intelligence of Things (AIoT)-oriented framework for the assessment of blockage at cross-drainage hydraulic structures to facilitate the flood management agencies in better managing the blockage related issues. The proposed framework makes use of multiple AI approaches (e.g. image classification, object detection, object segmentation, regression, end-to-end deep learning) to assess visual and hydraulic blockage at a given structure using both visual and hydraulic data coming from sensors (i.e. camera, water level sensors, inlet discharge sensor, surface velocity sensor). As the output, the framework provides the information about the blockage status, estimation of percentage visual blockage and estimation of percentage hydraulic blockage. This information will be used by the flood management agencies in maintaining the hydraulic structures and to incorporate the blockage in hydraulic structures design process.
1. Introduction
Cross-drainage hydraulic structures (e.g. culvert, bridge) are susceptible to blockage by debris material (e.g. vegetation, urban material) and often play significant role in originating flash floods (French and Jones Citation2015; Iqbal et al. Citation2023; Kramer et al. Citation2015). Blockage at cross-drainage hydraulic structures often have damaging consequences including overflow, diverted flow, damage to structure, downstream scouring and failure of structure (Davis Citation2001; Rigby and Barthelmess Citation2011; Rigby et al. Citation2002; Roso et al. Citation2004). Few examples of blockage triggered floods include Newcastle, Australia floods in 2007 (French and Jones Citation2015; WBM Citation2008), Konakadungalar, India floods in 2021 (Hindu Citation2021), Pentre, United Kingdom floods in 2021 (BBC Citation2021), Barpeta, India floods in 2021 (Tribune Citation2021) and Wollongong, Australia floods in 1998 (French and Jones Citation2015; Rigby et al. Citation2002).
The phenomena of blockage at cross-drainage hydraulic structures is least studied in literature mainly because of unavailability of relevant data and highly complex nature of debris accumulation at structures. Availability of debris upstream, debris transport probability upstream, type of debris material, upstream channel slope, type of hydraulic structure, inlet discharge, floodplain characteristics and water velocities are highlighted as significant factors in context of interpreting blockage (Barthelmess and Rigby Citation2009; Iqbal et al. Citation2023; Jones, Weeks, and Babister Citation2016; Rigby and Barthelmess Citation2011; Weeks et al. Citation2013). Conventional mathematical modelling approaches did not gain much success because of the highly non-linear nature of blockage accumulation and dependence on multiple localised factors.
Blockage guidelines defined by the Wollongong City Council (WCC) under the Australian Rainfall and Runoff (ARR) project 11 are the most comprehensive exiting formal guidelines to consider blockage in the design process of hydraulic structures (Jones, Weeks, and Babister Citation2016; Weeks et al. Citation2013). However, these guidelines are based on the post-flood visual inspections and not the peak flood hydraulic observations. This has triggered a debate within the hydraulic world where one group criticised these guidelines based on the argument that post-flood inspections cannot be considered as representative of peak floods impact of blockage (French and Jones Citation2015; Kramer et al. Citation2015). This group suggests that unless the visual information have some quantifiable relation with peak floods blockage, these guidelines cannot be considered reliable. This group emphasises on investigating the hydraulic impacts of blockage during the peak flooding events. Interpretation of blockage by this group is referred to as ‘hydraulic blockage’. In this context, different studies have been performed in literature where scaled physical models are used to study the different aspects of hydraulic blockage (Blanc Citation2013; Brooks Citation2020; Iqbal et al. Citation2023; Kramer et al. Citation2015); however, these studies are limited by flume constraints and local scope.
The second group believes that visual information about blockage at a certain hydraulic structure can help in better maintaining that structure, ultimately avoiding the floods (Barthelmess and Rigby Citation2009; Iqbal et al. Citation2021; Jones, Weeks, and Babister Citation2016; Weeks et al. Citation2013). The interpretation of blockage by this group is referred to as ‘visual blockage’. Classification of blocked structures (Iqbal et al. Citation2021), quantification of percentage blockage (Iqbal et al. Citation2023) and estimation of debris type (Iqbal et al. Citation2022) and volume quantification of debris are a few potential visual interpretations that can help flood management agencies in better maintaining the hydraulic structures. For example, having known the percentage visual blockage information, maintenance operations can be prioritised for highly blocked structures. In summary, both hydraulic and visual investigations are important in different scopes; hydraulic investigations are significant in incorporating blockage into design process of hydraulic structures while visual investigations are important for maintenance of hydraulic structures.
Given the recent success achieved by the Artificial Intelligence (AI) and Internet of Things (IoT) technologies in addressing complex real-world problems within the water management domain (e.g. ground water prediction (Afzaal et al. Citation2020), water demand forecasting (Xenochristou and Kapelan Citation2020), water pipe failure prediction (Kutyłowska Citation2016), flood depth estimation (Park et al. Citation2021), drainage pipe detection (Song, Woo, and Yan Citation2021), sewer fault detection (Zhou et al. Citation2022), flood monitoring (Barthelemy et al. Citation2020)), this paper proposes an Artificial Intelligence of Things (AIoT)-oriented framework for the end-to-end assessment of blockage at cross-drainage hydraulic structures. The proposed framework makes use of information from multiple sensors (i.e. camera, water level, water surface velocity, inlet discharge) and deploys state of the art AI algorithms (i.e. classification, detection, segmentation, regression, end-to-end deep learning) to assess both hydraulic and visual blockage at cross-drainage hydraulic structures. A use case AIoT architecture design has been presented along with all the hardware and cost details to demonstrate the practicality of the proposed framework.
2. Proposed blockage assessment framework
The proposed AIoT-oriented blockage assessment framework is designed to take input data from sensors (i.e. visual and hydraulic) deployed on or across the cross-drainage hydraulic structureand process it to provide the information about the corresponding blockage at cross-drainage hydraulic structure. The framework makes use of image classification, object detection, object segmentation, regression and end-to-end deep learning based models to process the input data. The graphical representation of the proposed framework is presented in . Overall, the framework consists of two blocks; visual blockage assessment block and hydraulic blockage assessment block to facilitate the both aspects of maintaining hydraulic structures and integrating blockage into design guidelines.
Figure 1. AIoT-Oriented blockage assessment framework.
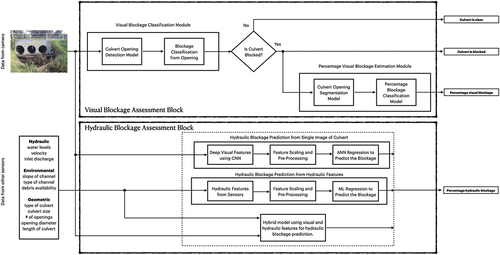
2.1. Visual blockage assessment block
The visual blockage assessment block of the framework utilises deep learning-based computer vision classification, detection and segmentation models to provide the visual blockage status at the given cross-drainage hydraulic structure and percentage visual blockage at each of its openings. This information will be useful from maintenance perspective and will help the flood management agencies to use the limited resources efficiently by prioritising highly blocked sites. The overall flow of this module includes taking the image of culvert from a camera sensor at input, detect the culvert openings, classify if the culvert is blocked or clear, if blocked, segment the visible opening from the image and estimate the percentage of visual blockage. This is achieved by using two modules described as follows.
2.1.1. Visual blockage classification module
First step in the visual blockage assessment is to determine the blockage status of the culvert given a single image. A detection-classification pipeline processes the culvert image and provides the ‘clear’ or ‘blocked’ or ‘partially blocked’ status of culvert for a given time instance. First a CNN based detection model detects the culvert opening bounding boxes and then those extracted openings are classified as a ‘blocked’, ‘partially blocked’ or ‘clear’ using CNN classification model. The labelling of images for blocked, partially blocked and clear classes is subjective in nature and may pose a challenge. A detailed description of a culvert blockage classification pipeline can be found in Iqbal et al. (Citation2021) and Barthelemy et al. (Citation2020).
2.1.2. Percentage visual blockage estimation module
Second step in the visual blockage assessment is the determination of percentage of visual blockage. From flood management perspective, it is more important to have some quantification of blockage instead of simple three-class classification. A quantified system of visual blockage will help in better utilising the resources. Once a culvert is classified as ‘blocked’ or ‘partially blocked’ by the classification module, this module extracts the visible opening masks using CNN segmentation models and classifies into one of four percentage visual blockage classes (i.e. 0–10%, 10%-50%, 50%-75%, >75%). In collaboration with flood management officials, an effective and practical solution was devised to visually classify culverts based on their appearance. The aim was to replicate the manual inspection process by utilising four percentage-based visual blockage classes as used by flood management officials. Ideally, it would have been highly advantageous to develop an algorithm that could accurately determine the absolute percentage occlusion using the visible culvert opening mask obtained from a segmentation algorithm. However, reconstructing the complete shape of a culvert based solely on a partial view presents a significant challenge that will be addressed in future stages of this project. As an alternative approach, a potential solution that will be tested involves incorporating a calibration process during the installation of the system at each culvert site. By using an image of a clear culvert, the algorithm will establish a template match to determine the absolute value for the percentage of visual blockage. A detailed description of percentage visual blockage quantification at culverts is provided by Iqbal et al. (Citation2023).
2.2. Hydraulic blockage assessment block
The hydraulic blockage assessment block of the framework uses deep learning regression and end-to-end CNN models to predict the percentage hydraulic blockage at culverts using the numerical data from the hydraulic sensors and images from the camera. The mathematical formulation proposed by the Kramer et al. (Citation2015) for hydraulic blockage has been used in developing this framework. The percentage hydraulic blockage information can be used by the flood management agencies to better design the hydraulic structures by integrating the blockage into design process. The concept of this block is to take the numerical data from hydraulic sensors and visual data from cameras, process it using regression models based pipeline and predict the percentage hydraulic blockage. This includes two blocks: prediction of hydraulic blockage from hydraulic features and prediction of hydraulic blockage from visual features. In addition, a hybrid model taking into account both hydraulic and visual information can also be used.
2.2.1. Prediction of hydraulic blockage from hydraulic features
One approach in prediction of hydraulic blockage at culverts is to take information from the hydraulic sensors (i.e. water level, inlet discharge, surface velocity) as input, pre-process that information and apply deep learning regression models to output the estimated hydraulic blockage. State of the art deep learning based regression models (i.e. ANN, 1D-CNN) are used for prediction. Initially, these models will be trained over the lab-scale simulated dataset and will fine-tune for real data over the time. Existing research (Iqbal et al. Citation2023; Kramer et al. Citation2015; Rigby and Barthelmess Citation2011) has identified several influential factors related to hydraulic blockage, including inlet discharge, upstream water level, upstream velocity, channel slope, debris supply, debris type and debris orientation. The significance of these factors was further validated by Iqbal et al (Iqbal et al. Citation2023) through their experiments using a lab-scaled physical model. However, due to the highly uncertain nature of blockage accumulation and its dependence on numerous local parameters, traditional mathematical modelling approaches have not been successful in accurately capturing the complexities involved. Nevertheless, data-driven modelling has shown promise in addressing problems where a direct relationship between variables is not readily apparent. In this particular context, the researchers collected hydraulic parameters such as upstream water level, inlet discharge, culvert type and surface velocity during their lab-scale physical model experiments, which replicated various blockage scenarios (for detailed information, refer to Iqbal et al. (Citation2023). This dataset was then utilised to train machine learning regression models aimed at predicting hydraulic blockage. Further details about the prediction of hydraulic blockage from hydraulic features can be found in Iqbal et al. (Citation2021). and Iqbal et al. (Citation2022).
2.2.2. Prediction of hydraulic blockage from visual features
Visual information can also be used for the prediction of hydraulic blockage by deploying the idea of taking images from camera, extracting visual features using CNN models and applying regression models on deep visual features to estimate the percentage hydraulic blockage. In this context, an end-to-end CNN model called Blockage_Net has been developed. This model has the ability to accurately predict the percentage of hydraulic blockage at a given hydraulic structure from a single image (see Iqbal, Barthelemy, and Perez (Citation2022). for more details). To illustrate the practical implementation of this system, consider a scenario where a camera system is strategically installed to monitor a culvert. This camera captures images of the culvert and subsequently processes them through the Blockage_Net deep learning model. By leveraging its advanced architecture, Blockage_Net effectively extracts relevant visual features from the input image and employs its acquired knowledge to predict the hydraulic blockage level depicted in the image. It is important to highlight that the Blockage_Net CNN model represents a unique and sophisticated concept; however, due to its substantial reliance on variations in background and lighting conditions, the model would greatly benefit from a larger and more diverse real-world dataset during the training phase. By incorporating a wide range of culvert images obtained from various environmental settings, the model can improve its adaptability and enhance its ability to accurately predict hydraulic blockage levels. Further details about the prediction of hydraulic blockage from deep visual features can be found in Iqbal et al (Iqbal et al. Citation2021). and Iqbal et al (Iqbal, Barthelemy, and Perez Citation2022).
2.2.3. Hybrid model
It would be an interesting aspect to explore how the hydraulic and visual information can be used together in a single hybrid model to predict the hydraulic blockage. There could potentially be many ways in which visual features can be incorporated, however, from utility perspective, one most relevant approach could be the Learning Using Privileged Information (LUPI) (Vapnik and Vashist Citation2009). Since, in field, measuring hydraulic data is expensive and difficult, therefore, approach of using the hydraulic data only during the training as a privileged information and inference the hydraulic blockage using the visual information only. A potential use-case could be to use the hydraulic data only for the training of model as a privileged information and rely only on visual data to make hydraulic blockage prediction.
3. AIoT architecture for blockage assessment
IoT is referred to as the technology that upgrades the physical objects into smart objects by using communication protocols, sensors and computing services (Li, Xu, and Zhao Citation2015; Madakam, Lake, and Lake Citation2015; Ray Citation2018). The fundamental principle of an IoT system is to collect the data from sensors, communicate the data to an IoT gateway and perform computations to demonstrate utility end trends from the data in real time. In this context, performing computations on the edge at sensor level making use of state of the art AI algorithms and communicating only relevant information rather than raw data has become essential, especially for the vision-based sensors where it is not practical to communicate large images or videos. This has led to a term called AIoT which uses the same concept of IoT with the fundamental difference of using the AI enabled edge computing hardware at the sensor level (Ghosh, Chakraborty, and Law Citation2018; González García et al. Citation2019). The proposed AIoT infrastructure for blockage assessment at culverts is shown in . It consists of three layers: a physical layer, network layer and an application layer:
Figure 2. IoT architecture of the proposed blockage assessment framework.
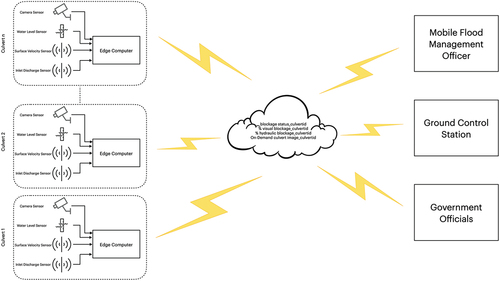
The physical layer consists of multiple type of sensors, edge computing hardware and communication mechanism. For blockage assessment utility, different sensors include water level sensor, optical sensor, surface velocity sensor and inlet discharge sensor. The data from these sensors is processed at edge using AI algorithms and communicated to IoT gateway.
The network layer functionality is to transfer the data from physical objects to the IoT gateway and then to the application layer. Some common communication protocols used as this layer include IEEE 802.15.4, 6LoPAWN and ZigBee. Scalability and security are considered two important features of this layer.
The application layer consists of the utility where this information can be used. In case of blockage assessment, mobile flood management officers, ground control station and government officials are a few potential end users who can be benefited from the real-time blockage information to better use the available resources for flood management purposes.
3.1. Components of the AIoT architecture
This section provides the details of components required to develop and deploy the proposed AI-oriented blockage assessment framework. The choice of which sensor or hardware to use will significantly depend on the budget, utility and scale. For demonstration, a specific use case is discussed here.
3.1.1. Visual and hydraulic sensors
Blockage assessment at the cross-drainage hydraulic structures is dependent on the hydraulic and visual data coming from sensors. For visual data, LOREX camera (LOREX Citation2022) module equipped with nigh vision and specifically designed for outdoor applications can be used. For water level measurements, a liquid level transmitter sensor (Store Citation2022) can be used. For water surface velocity measurement and inlet discharge measurement, OTT SVR 100 water surface velocity sensor (OTT Citation2022b) and OTT SLD discharge measurement sensors (OTT Citation2022a) are can be used, respectively. The choice of these sensors is made based on their compatibility with the edge computer and quality.
3.1.2. Edge computing hardware
There are a number of computing hardware solutions available in the market including NVIDIA, ASUS, Arduino and Pi; however, suitable hardware selection significantly depends on the required computational power and budget. Specifically, for the blockage assessment utility where multiple deep learning-based models will be deployed to handle visual and numerical data, high computational power is required. Based on this, NVIDIA GPU powered boards are suitable choice. Jetson AGX ORIN (NVIDIA Citation2023) and Jetson Xavier NX (NVIDIA Citation2022) are couple of NVIDIA edge computers which can be used for this utility.
3.1.3. Data communication
To transfer the data from the edge computer to an IoT gateway or cloud, a 5 G GSM module hardware and a network services data plan would be needed. SIM8200EA-M2 5 G module (Waveshare Citation2022) is often used with NVIDIA products and can also be used for this utility. For data connectivity, in context of Australia, Vodafone, Telstra and Optus are the common vendors. A data plan of 50GB per month is anticipated to be enough for transmitting blockage assessment data.
3.1.4. Power system
To operate the sensors and edge computing hardware at physical layer, a power system would need to be designed, if not available. Usually, most sensors and edge computers operate on + 12 volts and use of power adapters would be sufficient for the sites with line power access. For remote sites, a solar-based power system need to be designed to operate the sensors and computing hardware.
3.1.5. Cloud services
The data transmitted from the physical layer into cloud would need to be performed analytical computations prior to be presented to end-user. For computational purposes, Amazon Web Services (AWS) and Microsoft AZURE are potential cloud computing services providers, which can be used for this utility.
3.1.6. End-user interface
The real-time analytical data from the cloud needs to be hosted to end-user for visualisation. For the blockage assessment utility, a web hosted dashboard and/or a mobile application are the potential end-user interfaces from where flood management officers and government officials can visualise the real-time blockage assessment analytics.
3.2. Cost analysis
Cost breakdown to deploy the proposed AIoT-oriented blockage assessment framework for a single cross-drainage hydraulic structure is presented. Overall, the cost analyses are divided as the setup cost and the maintenance cost. Further, setup cost is divided into the hardware cost, software development cost, services cost and installation cost. The maintenance cost is divided into software maintenance cost, hardware maintenance cost and maintenance operational cost. presents the detailed tentative cost analysis for a case system described in Section 3.1. Overall, the cost may be divided into one-time setup costs and recurring costs based on the components which will require one time investment and others which will require recurring costs. show the breakdowns for the one-time setup cost and recurring costs. The one time setup cost is estimated as $44,150, while recurring costs per year are estimated as $9,900. Resulted cost is based on the R&D and may subject to reduce 3–5 times when scaled up.
Figure 3. Cost breakdown for the one-time setup of the proposed blockage assessment framework.
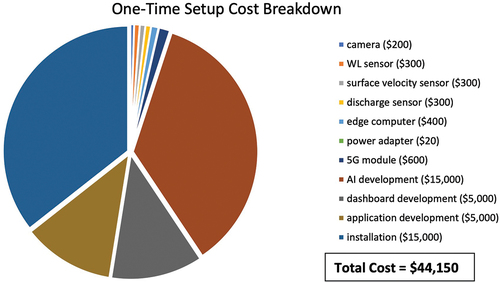
Figure 4. Recurring cost breakdown for the proposed blockage assessment framework.
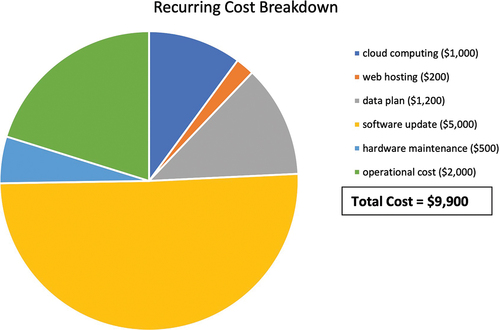
Table 1. Cost estimates for the proposed AIoT-Oriented blockage assessment framework.
Moreover, it is essential to note that the aforementioned costs encompass the development of a system from scratch. Nevertheless, once the AI and dashboards are created for one hydraulic structure, they can be utilised for all subsequent installations at a commercial level. Consequently, substantial development costs, amounting to approximately $25,000 out of the total of $44,000, can be eliminated. Furthermore, the installation and operational expenses provided are estimated based on casual hiring and an hourly workload. However, these costs could be significantly reduced if the system were implemented on a larger scale by the government, leveraging existing labour resources allocated to similar tasks.
Additionally, it should be noted that a solar-powered setup may not always be necessary for hydraulic structures located within urban areas. Consequently, a further reduction of $5,000 could be achieved for culvert sites within cities. Although the initial prices may appear high, they would eventually be reduced to hardware and service costs once the system is commercially deployed on a large scale. Nonetheless, even after commercialisation, the deployment of such systems for all hydraulic structures would still entail considerable expenses. Thus, it is recommended to identify high-risk culvert sites based on historical records and exclusively implement AIoT systems at those locations. The fact that a part of this framework has already been implemented in a practical setting (Barthelemy et al. Citation2020) confirms that the cost estimates are reasonable and fall within affordable boundaries.
4. Implications and limitations
This section presents a practical use-case scenario to illustrate the implementation of the proposed AIoT-oriented blockage assessment framework in real-world situations. It is worth noting that one component of this framework, namely the ‘visual blockage classification’, has already been implemented in the field as part of the ‘SMART Stormwater Management’ project’s StopBlock stream (Barthelemy et al. Citation2020). While most of the systems within the overall framework, including visual blockage classification (Barthelemy et al. Citation2020; Iqbal et al. Citation2021), percentage visual blockage estimation (Iqbal et al. Citation2023), hydraulic blockage prediction using hydraulic features (Iqbal et al. Citation2021, Citation2022) and hydraulic blockage prediction using visual features (Iqbal et al. Citation2021; Iqbal, Barthelemy, and Perez Citation2022), have been individually developed and studied; the complete framework combining all these systems has yet to be tested in real-world scenarios. illustrates a use-case scenario that demonstrates how the proposed framework could be deployed in the field for a single culvert site.
Figure 5. A practical use-case for the proposed AIoT blockage assessment framework implementation.
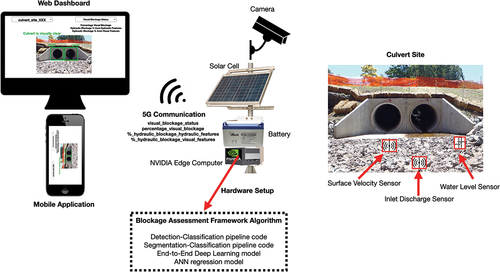
Despite showing significant potential in addressing visual and hydraulic blockage issues in cross-drainage hydraulic structures, the proposed framework has certain limitations that restrict its scope. Firstly, the framework treats blockage as an instantaneous factor and does not consider contextual information. This indicates the potential for future research to investigate blockage as a time-series problem. Secondly, the datasets used to train the deep learning and machine learning models are not extensively comprehensive, which may limit the generalisability of the model’s performance to sites that differ significantly from those included in the training datasets. To mitigate this issue, attempts have been made to incorporate simulated datasets (Iqbal, Barthelemy, and Perez Citation2023), and it is suggested that future work involves training data-intensive models using a combination of real and simulated datasets.
5. Conclusion
In conclusion, this study introduces an innovative AIoT-oriented framework for the assessment of blockage at cross-drainage hydraulic structures. The framework aims to leverage advanced data-driven models to enhance the understanding and evaluation of complex blockage phenomena. By integrating both visual and hydraulic information and employing state-of-the-art AI regression, classification, end-to-end, detection and segmentation models, the proposed framework provides a comprehensive approach to blockage assessment. Furthermore, a practical implementation of the framework is demonstrated through a detailed hardware setup using an AIoT architecture. Additionally, cost estimates for the deployment of the framework are provided, offering insights into its feasibility and practicality. It is worth noting that while the framework shows great potential, there are limitations, such as the treatment of blockage as an instantaneous factor and the need for more extensive and diverse datasets for model training. Future research directions could explore blockage as a time-series problem and incorporate a combination of real and simulated datasets for more robust model generalisability.
Disclosure statement
No potential conflict of interest was reported by the author(s).
Additional information
Notes on contributors
Umair Iqbal
Dr Umair Iqbal is an applied Artificial Intelligence (AI) scientist with a PhD in Computer Vision (CV) from the University of Wollongong, Australia. Umair’s primary focus lies in developing end-to-end edge-computing and video analytics solutions for real-world problems by seamlessly integrating AI, Machine Learning (ML), Internet of Things (IoT), and Artificial Intelligence of Things (AIoT) technologies. His research interest includes developing intelligent and automated solutions across diverse range of application domains including (but not limited to) flood management, waste management, coastal monitoring, transport safety, and environmental monitoring.
Muhammad Zain Bin Riaz
Dr Muhammad Zain Bin Riaz is a Water Resources Engineer with over a decade of experience across Asia Pacific, including Pakistan, Singapore, and Australia. He has a consistent record of providing his expertise in addressing the challenges posed by fluvial processes, river engineering, coastal protection, cross-drainage, and water resources. In 2022, he achieved a significant milestone by earning his Ph.D. from the University of Wollongong, Australia, where he has made significant contributions to the hydraulic field through his innovative work on sediment transport phenomena along shorelines, flood control, and sustainable water resource development. Dr. Riaz is also member of different societies, including ASCE, AFMS, IAHR, and ECSA.
Johan Barthelemy
Johan Barthelemy After his PhD in Applied Mathematics at the University of Namur (Belgium), Dr. Johan Barthélemy joined the SMART Infrastructure Facility of the University of Wollongong (Australia) where he was a Lecturer and the head of the Digital Living Lab researching and developing AI and AIoT solutions for smart cities and environmental monitoring. Being passionate about applied AI and how to accelerate it with GPUs, he is now a Senior Developer Relations Manager at NVIDIA, helping researchers in their journey to build the next generation of AI-based solutions.
Pascal Perez
Professor Pascal Perez is currently Director of the Australian Urban Research Infrastructure Network (AURIN), a National Research Infrastructure facility funded by NCRIS and hosted by the University of Melbourne. He is a specialist of Integrative Social Simulation, using Multi-Agent Systems technologies to explore complex infrastructure systems. He is a Fellow if the Royal Society of NSW and the Modelling and Simulation Society of Australia and New Zealand (MSSANZ). In 2002, he received an ARC-International Linkage Fellowship to develop social modelling research at the Australian National University. Professor Perez has published 200 refereed articles and book chapters. In 2006, he co-edited with his colleague David Batten the book ‘Complex Science for a Complex World’ (ANU E Press).
References
- Afzaal, H., A. A. Farooque, F. Abbas, B. Acharya, and T. Esau. 2020. “Groundwater Estimation from Major Physical Hydrology Components Using Artificial Neural Networks and Deep Learning.” Water 12 (1): 5. https://doi.org/10.3390/w12010005.
- Barthelemy, J. 2020. “Problem-Driven and Technology-Enabled Solutions for Safer Communities.” In Handbook of Smart Cities, edited by J. C. Augusto, et al., 1–28. Cham: Springer International Publishing.
- Barthelmess, A. and E. Rigby. 2009. “Quantification of Debris Potential and the Evolution of a Regional Culvert Blockage Model,” In 32nd Hydrology and Water Resources Symposium, Barton, ACT, Barton, ACT, Australia, 218–229.
- BBC. (2021). Pentre Flood: ‘Woody debris’ Blocking Culvert Was Main Cause, Report Finds. Available: https://www.bbc.com/news/uk-wales-57686085.
- Blanc, J., “An analysis of the impact of trash screen design on debris related blockage at culvert inlets,” Ph.D, School of the Built Environment, Heriot-Watt University, 2013.
- Brooks, J. A., “Culvert blockage caused by boulders in the Western Cape and the development of mitigation measures: physical model study,” Masters of Civil Engineering, Department of Civil Engineering, Stellenbosch University, Western Cape, South Africa, 2020.
- Davis, A. 2001. An Analysis of the Effects of Debris Caught at Various Points of Major Catchments During Wollongong’s August 1998 Storm Event. Wollongong, Australia: Bachelor of Engineering, University of Wollongong.
- French, R., and M. Jones. 2015. “Culvert Blockages in Two Australian Flood Events and Implications for Design.” Australasian Journal of Water Resources 19 (2): 134–142. https://doi.org/10.1080/13241583.2016.1172693.
- Ghosh, A., D. Chakraborty, and A. Law. 2018. “Artificial Intelligence in Internet of Things.” CAAI Transactions on Intelligence Technology 3 (4): 208–218. https://doi.org/10.1049/trit.2018.1008.
- González García, C., E. R. Núñez Valdéz, V. García Díaz, B. C. Pelayo García-Bustelo, and J. M. Cueva Lovelle. 2019. “A Review of Artificial Intelligence in the Internet of Things.” International Journal of Interactive Multimedia 5 (4): 9. https://doi.org/10.9781/ijimai.2018.03.004.
- Hindu, T. 2021. Blockage in Culvert Leads to Inundation. Available: https://www.thehindu.com/news/cities/Tiruchirapalli/blockage-in-culvert-leads-to-inundation/article37526114.ece.
- Iqbal, U., J. Barthelemy, W. Li, and P. Perez. 2021. “Regression on Deep Visual Features Using Artificial Neural Networks (ANNs) to Predict Hydraulic Blockage at Culverts.” arXiv preprint arXiv:2105.03233.
- Iqbal, U., J. Barthelemy, W. Li, and P. Perez. 2021. “Automating Visual Blockage Classification of Culverts with Deep Learning.” Applied Sciences 11 (16): 7561. https://doi.org/10.3390/app11167561.
- Iqbal, U., J. Barthelemy, and P. Perez. 2022. “Prediction of Hydraulic Blockage at Culverts from a Single Image Using Deep Learning.” Neural Computing and Applications 34 (23): 21101–21117. https://doi.org/10.1007/s00521-022-07593-8.
- Iqbal, U., J. Barthelemy, and P. Perez. 2023. “Visual Blockage Assessment at Culverts Using Synthetic Images to Mitigate Blockage-Originated Floods.” Journal of Hydroinformatics 25 (4): 1531–1545. https://doi.org/10.2166/hydro.2023.068.
- Iqbal, U., J. Barthelemy, P. Perez, J. Cooper, and W. Li. 2023. “A Scaled Physical Model Study of Culvert Blockage Exploring Complex Relationships Between Influential Factors.” Australasian Journal of Water Resources 27 (1): 191–204. https://doi.org/10.1080/13241583.2021.1996679.
- Iqbal, U., J. Barthelemy, P. Perez, and W. Li. 2021. “Prediction of Hydraulic Blockage at Cross Drainage Structures Using Regression Analysis.” arXiv preprint arXiv:10930.
- Iqbal, U., M. Z. Bin Riaz, J. Barthelemy, and P. Perez. 2022. “Prediction of Hydraulic Blockage at Culverts Using Lab Scale Simulated Hydraulic Data.” Urban Water Journal 19 (7): 686–699. https://doi.org/10.1080/1573062X.2022.2075770.
- Iqbal, U., M. Z. Bin Riaz, J. Barthelemy, and P. Perez. 2023. “Quantification of Visual Blockage at Culverts Using Deep Learning Based Computer Vision Models.” Urban Water Journal 20 (1): 26–38. https://doi.org/10.1080/1573062X.2022.2134041.
- Iqbal, U., M. Z. B. Riaz, J. Barthelemy, N. Hutchison, and P. Perez. 2022. “Floodborne Objects Type Recognition Using Computer Vision to Mitigate Blockage Originated Floods.” Water 14 (17): 2605. https://doi.org/10.3390/w14172605.
- Jones, R. H., W. Weeks, and M. Babister, “Review of Conduit Blockage Policy Summary Report,” WMA Water: Sydney, NSW, Australia, 2016.
- Kramer, M., W. Peirson, R. French, and G. Smith. 2015. “A Physical Model Study of Culvert Blockage by Large Urban Debris.” Australasian Journal of Water Resources 19 (2): 127–133. https://doi.org/10.1080/13241583.2015.1116184.
- Kutyłowska, M. 2016. “Prediction of Water Conduits Failure Rate–Comparison of Support Vector Machine and Neural Network.” Ecological Chemistry and Engineering A 23 (2): 147–160. https://doi.org/10.2428/ecea.2016.23(2)11.
- Li, S., L. D. Xu, and S. Zhao. 2015. “The Internet of Things: A Survey.” Information Systems Frontiers 17 (2): 243–259. https://doi.org/10.1007/s10796-014-9492-7.
- LOREX. (2022). 4K Nocturnal Motorized Varifocal Zoom Lens IP Camera. Available: https://www.lorex.com/collections/security-cameras/products/4k-nocturnal-motorized-varifocal-zoom-lens-ip-camera.
- Madakam, S., V. Lake, and V. Lake. 2015. “Internet of Things (IoT): A Literature Review.” Journal of Computer Communications 3 (5): 164.
- NVIDIA. (2022). Jetson Xavier NX Series. Available: https://www.nvidia.com/en-au/autonomous-machines/embedded-systems/jetson-xavier-nx/.
- NVIDIA. (2023). Jetson AGX ORIN. Available: https://www.nvidia.com/en-au/autonomous-machines/embedded-systems/jetson-orin/.
- OTT. (2022a). OTT SLD - Side Looking Doppler Sensor: Water Flow Meter for Longterm Data Collection of Velocity and Discharge Measurements. Available: https://www.ott.com/products/water-flow-3/ott-sld-side-looking-doppler-sensor-970/.
- OTT. (2022b). OTT SVR 100: Surface Velocity Radar for Measuring Open Channel Flow. Available: https://www.ott.com/products/water-flow-3/ott-svr-100-2406/.
- Park, S., F. Baek, J. Sohn, and H. Kim. 2021. “Computer Vision–Based Estimation of Flood Depth in Flooded-Vehicle Images.” Journal of Computing in Civil Engineering 35 (2): 04020072. https://doi.org/10.1061/(ASCE)CP.1943-5487.0000956.
- Ray, P. P. 2018. “A Survey on Internet of Things Architectures.” Journal of King Saud University-Computer Information Sciences 30 (3): 291–319. https://doi.org/10.1016/j.jksuci.2016.10.003.
- Rigby, E., and A. Barthelmess. 2011. “Culvert Blockage Mechanisms and Their Impact on Flood Behaviour: Are All Blockages Created Equal.” In Proceeding of 34th World Congress of the International Association for Hydro-Environment Research and Engineering, 380–387. Barton, ACT: Engineers Australia.
- Rigby, E., M. Boyd, S. Roso, P. Silveri, and A. Davis, “Causes and Effects of Culvert Blockage During Large Storms,” in Ninth International Conference on Urban Drainage (9ICUD), Lloyd Center Doubletree Hotel, Portland, Oregon, United States, 2002, pp. 1–16: Engineers Australia.
- Roso, S., M. Boyd, E. Rigby, and R. VanDrie. 2004. “Prediction of Increased Flooding in Urban Catchments Due to Debris Blockage and Flow Diversions,” In Proceedings of NOVATECH, Lyon, France, 8–13.
- Song, H., D. K. Woo, and Q. Yan. 2021. “Detecting Subsurface Drainage Pipes Using a Fully Convolutional Network with Optical Images.” Agricultural Water Management 249:106791. https://doi.org/10.1016/j.agwat.2021.106791.
- Store, T. I. 2022. Liquid Level Transmitter Sensor. Available: https://www.iot-store.com.au/products/liquid-level-transmitter-sensor.
- Tribune, T. A. 2021. Blockage of Culverts in Barpeta Dist Leading to Problems Galore. Available: https://www.pressreader.com/india/the-assam-tribune/20210725/281835761728931.
- Vapnik, V., and A. Vashist. 2009. “A New Learning Paradigm: Learning Using Privileged Information.” Neural Networks 22 (5–6): 544–557. https://doi.org/10.1016/j.neunet.2009.06.042.
- Waveshare. 2022. Sim8200EA-M2 5G Module Designed for Jetson Nano, 5G/4G/3G, Snapdragon X55, Multi Mode Multi Band. Available: https://www.waveshare.com/sim8200ea-m2-5g-for-jetson-nano.htm.
- WBM, B. 2008. “Newcastle Flash Flood 8 June 2007 (The Pasha Bulker Storm) Flood Data Compendium.” Prepared for Newcastle City Council, BMT WBM, Broadmeadow.
- Weeks, W., G. Witheridge, E. Rigby, A. Barthelmess, and G. O’Loughlin. 2013. Project 11: Blockage of Hydraulic Structures, P11/S2/021. Barton, ACT, Australia: Engineers Australia.
- Xenochristou, M., and Z. Kapelan. 2020. “An Ensemble Stacked Model with Bias Correction for Improved Water Demand Forecasting.” Urban Water Journal 17 (3): 212–223. https://doi.org/10.1080/1573062X.2020.1758164.
- Zhou, Q., Z. Situ, S. Teng, H. Liu, W. Chen, and G. Chen. 2022. “Automatic Sewer Defect Detection and Severity Quantification Based on Pixel-Level Semantic Segmentation.” Tunnelling and Underground Space Technology 123:104403. https://doi.org/10.1016/j.tust.2022.104403.