
 ?Mathematical formulae have been encoded as MathML and are displayed in this HTML version using MathJax in order to improve their display. Uncheck the box to turn MathJax off. This feature requires Javascript. Click on a formula to zoom.
Abstract
As renewable energy expands rapidly in installed capacity and in built-over area, constructors and researchers are shifting their sights from the lands to the seas. Offshore wind power (OWP), or offshore wind farm, is a typical source of the renewable energy constructed on the offshore islands or in the oceans. Since the installed capacity of OWP has become booming since 2000, its relevant researches also grow substantially. The objective of this paper is to quantify the research works of OWP and to analyze their focuses, main producers and high impact literature using bibliometric method, where the OWP-related core literature in recent 40 years are sorted out and a visualized analysis closely concerned terms, contributors on national/regional basis, and highly cited articles. The results show that researchers have been largely followed on the grid-connection operations, the frameworks and the ambient environment change of offshore wind power. Moreover, the UK has taken the leading position on the study of OWP at present.
1. Introduction
With the continuous development of the global economy, the global demand for energy supply is also increasing rapidly. Energy is the key factor of social and economic development, but with the traditional fossil energy’s consumption and depletion, the development and utilization of renewable energy have become an indispensable strategy for sustainable development of all countries in the world. Wind power is a typical clean energy whose power source only comes from wind, the whole electricity generation process is non-polluting (Ackermann, Citation2005; Archer & Jacobson, Citation2005). Compared with solar energy, biomass energy, tidal energy, geothermal energy and other forms of renewable energy sources, wind power technology is comparatively mature with relatively low cost (Ackermann & Soder, Citation2002). The fundamental difference between the onshore wind power and the offshore wind power is the former’s installed locations are on the continent, whereas the latter’s installation sites are in the ocean or on the offshore islands, and the installation costs of the onshore wind power are commonly lower compared with the offshore (Noori, Kucukvar, & Tatari, Citation2015). However, as the land space and the wind resources for onshore wind power are limited, especially in those coastal countries such as Demark (Ladenburg, Citation2008), offshore wind power (OWP), whose wind driven generator are mainly built in the vast ocean, has the advantages such as abundant wind energy resources and proximity to load centers (Bilgili, Yasar, & Simsek, Citation2011), so the development of offshore wind power industry is favoured by many countries with coastlines (Ladenburg, Citation2008; Esteban, Diez, López, & Negro, Citation2011). Compared with other marine energies, the utilization of offshore wind power has entered a mature commercial operation stage with proven techniques (Perveen, Kishor, & Mohanty, Citation2014). Nowadays, countries with different economic levels now take the offshore wind power as one of the ways to deal with the future energy problems. Hence, the offshore wind power deserves research and analysis.
In addition to the natural environment conducive to sustainable development, the development of offshore wind power can also bring economic benefits. The scale expansion of OWP will bring new opportunities for the upgrade of wind power equipment manufacturing industry. On the one hand, as many upstream and downstream industries are closely linked, the development of offshore wind power will play an indispensable role in leading and driving, forming a number of highly integrated industrial clusters. On the other hand, the harsh natural conditions at sea give a chance for the verifying the tough environment-adaptive equipment for wind power. By the applying and exploring in the sea, research personnel and engineers can promote the upgradation in high-end bearings, gearboxes, high-power generators and other cutting-edge technologies related to wind power. In developing countries such as China, the development of offshore wind power can rectify the past economic growth patterns which were at a cost of high carbon emissions and environmental pollutions, and also promote employment or meet the government’s commitment to limiting the carbon emissions(Yu & Qu, Citation2010).
Despite a mature scheme of its construction and operation, offshore wind power still faces many challenges. In its planning process, offshore wind power should not only be selected based on wind conditions or geographical space, but also be taking relevant affairs carefully, such as the input-output ratio, or the relationships with relevant departments, including local governments, energy departments, fisheries and shipping sectors. In the process of construction, all aspects of difficulties in the construction management are needed to be considered, including site exploration, piling, foundation installation and power-on electric tests, etc. In the operation link, the fluctuation of wind energy supply is in natural contradiction with the stability of power demand, which requires the complementary adjustment of other stable forms of energy and puts forward new requirements for power grid scheduling. In terms of maintenance, the cost of offshore wind power is much higher than that of onshore wind power due to the corrosion problems caused by being far away from the mainland, high salt fog with high humidity, and frequent severe sea climate. In addition, in many areas of the offshore wind power already in operation has not yet recovered the input costs, faced with equipment aging need to spend money to update the situation. In order to solve these problems, the academic and engineering circles have done a lot of targeted research on these problems. However, these studies also need to be counted, classified and summarized to better enable us to find the research rules and core concerns. Therefore, this paper extracted the offshore wind power literature from the authoritative literature database, processed and visualized.
2. Literature review
The concept of scientific knowledge mapping originated around 2003, and a series of knowledge visualization software was born one after another since then, including BibExcel, SCI2, VOSviewer, HistCite, and CiteSpace. CiteSpace has been widely used in academia due to its simplicity, ease of use and versatility. This Java-based software can perform visual analysis in the form of cluster diagrams of the collected literature data, including statistics of keywords, producing countries, producing institutions, co-cited journals and co-cited authors (Chen, Citation2006).
The Bibliometric study becomes widespread in various areas since 2006. In medical science, Chen C.M. et al has analyzed the emerging trends of regenerative medicine from 2000 to 2011, finding that the alternative reprogramming techniques, along with the structural and functional equivalence between induced pluripotent stem cells and human embryonic stem cells, are the two major trends in that field(Chen, Hu, Liu, & Tseng, Citation2012). In economics and finance, Zhou W. et al have conducted a bibliometric study of credit risk based on 2384 articles, finding out some useful features such as the interdisciplinary studies of credit risk are growing (Zhou, Chen, & Meng, Citation2019).
In the domain of renewable energy and environment protection, the relevant literature has been not a few. For example, Xiao, et al. had examined the Organic Photovoltaic Tech through text mining and knowledge visualization (Zhao, Wang, & Wang, Citation2018). Luo, et al. analyzed the history and present of coalbed methane (CBM) in China, unearthed its variation tendency and leading institution (Luo, Zhang, Zhang, & Huang, Citation2017). And for the research of Carbon Capture and Storage, Qiu and Liu demonstrated it by knowledge mapping, showing three main topics, carbon emissions with environment protection, R&D activities and social practical issues (Qiu & Liu, Citation2018). Furthermore, Pierpaoli and Ruello detected the focus of attention of indoor air quality during different years (Pierpaoli & Ruello, Citation2018)
Research trends of renewable energy deserve more summaries in terms of different forms of clean power supply. Hence, in this paper, literature with the theme of “Offshore Wind Power” from Clarivate Analytics’ Web of Science Core Collection were searched and gathered, then CiteSpace was used for visual bibliometric analysis to explore the development history and law, along with the high contributors in terms of country/region and institution on what we focus.
3. Data collection and analysis methods
The fundamental purpose of this paper is to select a reliable data source for the bibliometric analysis, hence we may find out the statics, the concerned topics and the trends of the offshore wind power’s studies more convincible. Meanwhile, suitable methods to process the data and to produce the knowledge map are also essential.
3.1. Data retrieval
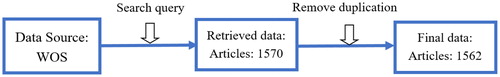
The data in this paper are all collected from Clarivate Analytics’ Web of Science Core Collection (WOS Core). The previous bibliometric analysis showed that the reason why WOS Core was selected is that it provides literature data with a longer time span than other databases (Zhao et al., Citation2018). Hence, we also chose WOS Core as the data source in this study. We used the “advanced search” function provided by WOS to search. The search query is
TS = (“offshore wind power*” OR “offshore wind farm*” OR “offshore wind power generation*” OR “offshore wind power system “)
Meanwhile, in order to ensure the data to be as intact as possible, in time range setting, we do not set the starting year of the retrieved data, but set 2018 as the ending year (As 2019 is not ending yet), and the first year when the OWP-related article appeared will be regarded as the starting year. In addition, we restrict the language to “English” and the data type to “Article”. lists the steps of data collected from WOS.
Figure 1. Steps of data retrieval.
3.2. Data statistics and aggregate analysis
According to the retrieval input in 2.1, we obtained 1562 articles. depicts the publication status of works of literature related to offshore wind power. After the first and only literature (Ossenbrugen, Pregent, & Meeker, Citation1979) was published in 1979, there was even no literature on offshore wind power in the following 16 years. Even in the period from 1996 to 2003, the number of publications per year was still scarce.
Figure 2. The annual number of published articles of OWP in WOS Core. Source: Gao et al. (2016).
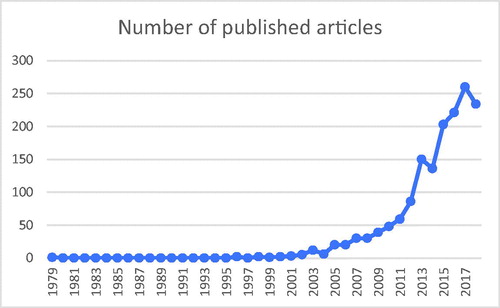
This situation lasted until 2003, when the installed capacity of global offshore wind power increased much more than ever before, by 0.3 GW. From 2004 to 2011, the number of published articles maintained steady growth, while from 2012 to 2017 the growth trend became exponential.
shows the global installed offshore wind power capacity from 2001 to 2018, which is calculated by annually new installed capacity and total capacity respectively. In order to find the relationship between the amount of annual equipment and the number of annual documents, we made a linear fitting between them, as shown in .
Figure 3. The new installations and the total installations of offshore wind power in the globe.
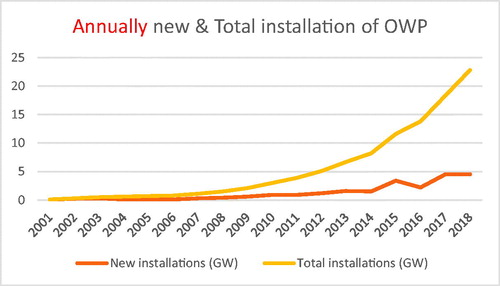
Figure 4. The Fitting curve of the annually new published articles and the annually new installation of OWP.
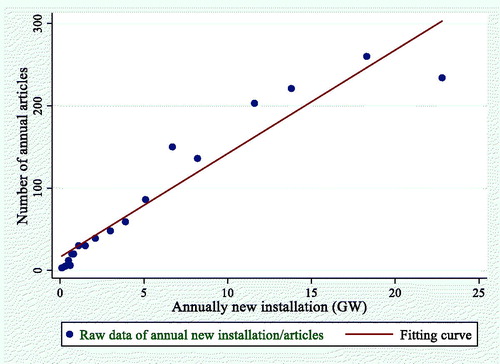
From , we can see that there is a strong correlation between the annually new installation of OWP and the number of its relevant articles. To this end, we build a simple linear regression model to confirm and analyze this correlation:
(1)
(1)
Where the explained variable, Articlet refers to number of articles published in year t; Installationt which stands for the new installed capacity of OWP (measured in Gigawatt) in year t, is the explanatory variable, β is its coefficient or the slope of the simple linear regression model; α is the constant term and εt is the error term. As both the publications and installed capacities are rare before 2000, we chose the data from 2001 to 2018 as the sample and adopted the ordinary least square (OLS) method to obtain the regression results, as shown in .
Table 1. Estimation results of the annual installation on the number of articles.
illustrates that in Eq. (1), the estimated coefficient for the installation is 12.576 and significant at 1% level, the estimated value of constant term is 16.143 (significant at 10% level); the coefficient of determination R2=0.916, indicating that the linear model has a high degree of goodness of fit (changes in Installation can explain the variation of Article to a degree of 91.6%). Therefore, we can conclude that there is a strong positive correlation between the number of articles on offshore wind power and the installation capacity of it.
3.3. Data processing and analysis
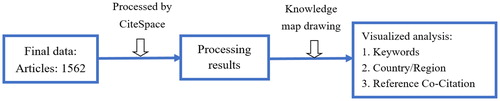
After acquiring the duplicated-removed data, we then use CiteSpace (Ver. 5.3.R9) to load them and start the visualized analysis from three aspects, including the Keywords, the Country/Region, and the Reference Co-Citation.
4. Results and discussion
According to , the results will be displayed and interpreted by three aspects, which can reveal the characteristic of offshore wind power’s research in the past 40 years and deserves discussion.
Figure 5. Steps of visualized analysis.
4.1. Keyword
In a research field, keyword is the direct reflection of researchers’ concerns. By using the function of keyword visualization in CiteSpace, the research hotspots are emerged intuitively, as shows.
Figure 6. Keyword knowledge mapping of OWP.
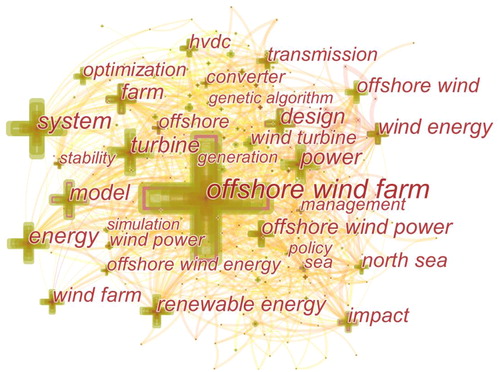
The high-frequency keywords, whose frequency of occurrence in the collected data have been set no less than 30 times, are displayed explicitly on the figure above. Each keyword is represented by a cross-shaped node with a specific size that denotes its frequency (so is its font-size), the larger a node’s size, the higher the frequency of the corresponding keyword. The links between any two keywords indicate their co-occurrence. Obviously, these intricate links in the keyword knowledge mapping prove they are correlated tightly. has listed the keywords that counted more than 100 times.
Table 2. High-frequency keywords (≥100).
Apparently, “Offshore wind farm” is the mostly emerged keyword, with 400 counts in WOS core from 1978 to 2018. This keyword also has the highest centrality, a measurement index which reflects a node’s importance by calculating its number of shortest paths in a knowledge mapping to which a given node belongs (Chen, Citation2006; Li, Porter, & Wang, Citation2017). In those articles which related to “Offshore wind farm”, a review given by Franck (Franck, Citation2011) is mostly cited (296 times till 2018), mentioned that the remote renewable energy like offshore wind power had brought HVDC (high-voltage direct current) multi-terminal systems, which had been once a research hotspot in 1980s(Billon, Taisne, Arcidiacono, & Mazzoldi, Citation1989; Morin, Bui, Casoria, & Reeve, Citation1993), to the technology of interest again, and regarded the HVDC circuit breakers as the essential determinant to a dc power grid system by ensuring its efficiency, reliability, and controllability (Bergstrom, Juhlin, Liss, & Svensson, Citation1978; Greenwood, Kanngiessner, Lesclae, Margaard, & Schultz, Citation1995, Citation1996; Kanngiesser, Ring, & Wess, Citation1991). The following article (Yang, Fletcher, & O'Reilly, Citation2012), also stated that VSC-HVDC (voltage-source converter-HVDC) had been typically embodied in OWP, and has proposed a fault location method to identify and define the major faults of VSC-HVDC, where the ground resistance and the distance to the fault location is the key to this method.
Besides, another highly used keyword, “system”, is tightly linked to OWP because it is normally a part of the electric power system when working, and its grid-connection and control have been a challenge for long which attracts numerous studies. The article related to “system” that has been the only one that had been cited more than 100 times, is created by J. Robinson, et al., they had devised a Medium Voltage dc grid system model connected the offshore wind farm to compare with an ac system, indicating that the former system saves material at a cost of slightly higher power losses (Robinson, Jovcic, & Joos, Citation2010). The next research article is contributed by Zhang et al. (Zhang, Jiang, Lu, Ge, & Peng, Citation2014) which has been cited 80 times, has investigated the resonance issues existed in an offshore wind farm using power electronic converters (Carrasco et al., Citation2006; Kjaer, Pedersen, & Blaabjerg, Citation2005) that connected to the power system through long-range HVAC (high-voltage alternating current) (Bresesti, Kling, Hendriks, & Vailati, Citation2007; Chinchilla, Arnaltes, & Burgos, Citation2006; Flourentzou, Agelidis, & Demetriades, Citation2009) undersea cable (Blaabjerg, Teodorescu, Liserre, & Timbus, Citation2006). It also proposed a method of cascaded notch-filter-based active damping to deal with the resonance. The third place is occupied by a journal article produced by Stoutenburg, Jenkins, and Jacobson (Citation2010). Based on the previous studies (Graham, Keirstead, & Millborrow, Citation2006; Lund, Citation2006; Stoutenburg, Citation2008; Stoutenburg & Jacobson, Citation2009; Fusco, Nolan, & Ringwood, Citation2010), they have found out that a combination of offshore wind farms and wave energy farms could reduce the fluctuation of the electricity output, compared with their standalone operations.
Moreover, the keyword “turbine”, which serves as the key component of wind power, has the 3rd largest frequency. A study of collision risks to the birds on the offshore wind turbines is highly cited (293 till Dec. 2018 in WOS Core) (Drewitt & Langston, Citation2006), the authors have also emphasized that relevant environmental legislation and damage evaluations are needed to mitigate the bird’s living conditions offshore. And the No.4 keyword “Energy” is mainly concerned with the power output of OWP. For instance, the most cited article (176 counts) (Morgan, Lackner, Vogel, & Baise, Citation2011) with this keyword has focused on the probability distribution of wind speed in terms of three different metric models, probability plot (R2), estimates of turbine’s average output and estimates of wind speed’s peak value.
4.2. Country/region
The installed capacity of OWP differs by countries/regions, so is its research quantity. In order to discover and compare the most productive countries/regions, we may also utilize CiteSpace to calculate out and display, as shown in .
Figure 7. Country/region knowledge mapping of OWP.
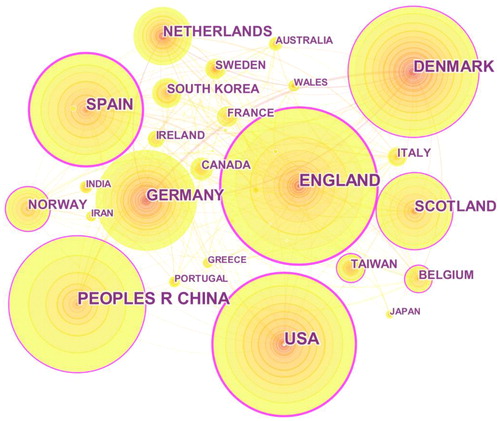
has displayed the countries/regions whose count number of offshore wind power are no less than 15. Each circle-shaped node represents a specific country/region. The size of a circle embodies the amount of the quantity of literature, and the thickness of the circle’s purple outer ring represents the centrality of the corresponding country/region (Chen, Citation2016). Apparently, England, the USA, Peoples R China (mainland China), Denmark and Spain have fairly large count number, and England, the USA and Spain have comparatively bigger centrality. To quantize this comparison, we extracted the statistics of the countries/regions relatively high count number, as shows.
Table 3. The most productive 20 countries/regions in OWP research until 2018.
As a result, the UK has held the first place in the count number of the OWP’s research, as there have been 235 articles produced in England, 117 in Scotland and 22 in Wales. The USA, mainland China, and Denmark have just followed behind in quantity. As for the centrality, which England also leads above all (0.31) and the USA has the second largest one (0.27), Spain follows behind as 0.26. Hence, the UK, the USA, mainland China, and Denmark predominate the quantity of OWP’s research. And in the meantime, England, the USA, and Spain lead the impact.
4.3. Reference Co-Citation
One key assessment criterion of academic literature is the citation frequency, which can also be measured and depicted by CiteSpace (Chen, Citation2004). In the knowledge mapping of reference co-citation, a node signifies a cited-literature, and its size denotes the number of citations as other articles’ cited reference (note that all the counted citations displaced by CiteSpace are only limited in the collected data that input into CiteSpace) or its citation frequency. The nodes are linked with different intensities, which are indicated by the thickness of the links. has depicted the view of the co-citation networks of the offshore wind power’s research, where top 50 levels (identified by CiteSpace) of most cited literature each year are displayed as the nodes.
Figure 8. Co-citation knowledge mapping of OWP.
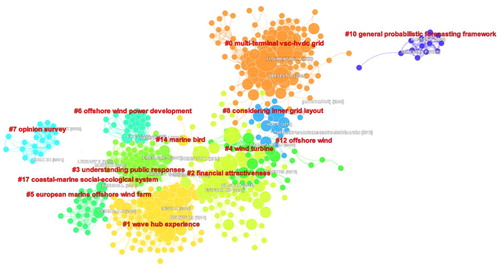
From , we can figure out that the knowledge mapping of the co-citation network, is made up of 13 co-citation clusters with different colors. Except for cluster #10 and cluster #7, the other clusters are interlinked, which indicates that the literature in these 11 clusters are closely linked as the references been cited. The largest 5 clusters are #0∼#4, which contains 130, 98, 81, 57 and 37 nodes. And in each cluster, the nodes with the same color are related much more tightly, which means the co-citations inside a cluster are much more frequent than outside. The co-citation knowledge mapping has clarified that the researches of OWP are focused on these 13 themes, as listed in .
Table 4. Clusters which reflect the 13 themes of OWP.
The 13 clusters in have grouped the research focuses on offshore wind power in 1979-2018. In the largest cluster #0, labeled with “multi-terminal VSC-HVDC grid”, the article “VSC-Based HVDC Power Transmission Systems: An Overview” (Flourentzou et al., Citation2009) has the maximum citation counts, 63, which is also the largest count among all the nodes in the co-citation knowledge mapping (note that the citation counts are only limited in the data collected). This article produced by Flourentzou., et al. gave an overview of the development of voltage-source converter (VSC) HVDC technologies using a fully controlled semiconductor had propelled the large onshore/offshore wind farms’ grid-connection. Besides, the No.2 and No.3 most-cited articles (Bresesti et al., Citation2007; Gomis-Bellmunt, Liang, Ekanayake, King, & Jenkins, Citation2011) are also ranged in cluster #0 and have both discussed the application of VSC-HVDC in offshore wind farms.
Cluster #1, labeled with “wave hub experience”, is a theme concerned with environmental influence caused by OWP especially in marine acoustics, which may do harm to marine animals. Taking the No.4 article given by Brandt, Diederichs, Betke, and Nehls (Citation2011) for example, they had investigated the porpoises’ reactions to the noises emitted by the construction of an offshore wind farm in the Danish North Sea, finding that their activities had decreased remarkably nearby, proving a negative effect on this clean energy. The rest of the clusters have been also concerned with the technologies applied to OWP and its environmental impacts.
Except for the citations in total amount, the citation bursts, which reflects the sharp increase of the citation, is another indicator to evaluate the impact of the literature. The top 20 literature as references with the strongest citation bursts are listed in .
Table 5. Top 20 references with the strongest citation bursts.
The strength of the citation bursts are measured by the duration and the amplitude of an object’s sudden acceleration, which is the citation counts here. The No.2 cited article that focused on the VSC-HVDC in offshore wind farms (Bresesti et al., Citation2007), is the strongest reference above all, with high growth from 2010 to 2013. A research of power losses in transmission of large offshore wind farms using different power electronic technologies carried by Negra, Todorovic, and Ackermann (Citation2006), ranks the second place. As for the duration only, a research conducted by Wilhelmsson and Malm (Citation2008) ranks the first. This marine ecological environment concerned paper also belongs to the cluster #1, proving that the species number and the biodiversity dropped as the marine geological conditions had changed by the installation of offshore wind power. shows the variations of the citations for these 3 works, and the duration of bursts have been depicted by wider lines.
Figure 9. Citation trends and burst duration of the mentioned 3 articles.
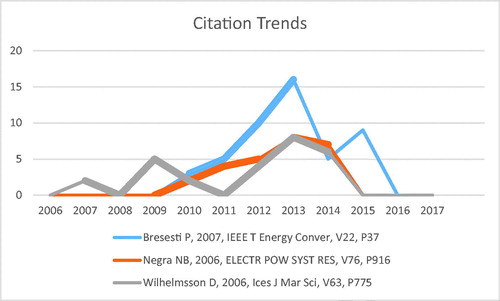
As shown in , the No.3 article has the longest duration of bursts, from 2007-2014. Early in 2007-2009, the citation counts are even zero for both of the top 2 articles, but then there were a booming for them afterward till 2015, which became the reason why they overtook the No.3. The year 2013 is notable, as all these top 3 articles reached their peak citation counts in that year, which are 16, 8 and 8.
5. Conclusions
The research of offshore wind power deserves summarization and discussion, as its installed capacity and correlational studies have experienced a swift growth since the 2010s. This paper has counted its research article from 40 years ago, confirmed the positive correlation of its installed capacity and research amount, and discovered the research trends and hotspots of the offshore wind power.
In conclusion, although the utilization of offshore wind power may cause some side effects such as the sound pollution and the change of marine soil, the expansion of this clean, sustainable energy would not cease, along with its relevant researches. The construction of offshore wind power has undergone a swift growth since the 2000s, especially after 2007, and this may also explain the rising tendency of its volume of research as their remarkably similar variation trend which is highly fitted.
The bibliometric analysis of the OWP literature enables us to know its research hotspots and the emerging trends as well as high-impact contributors and literature. By counting and analyzing the data collected from Clarivate Analytics’ Web of Science Core Collection and using knowledge mapping software, we have found out that the wind power’s grid-connection has been a key concern for the past, present, as a multitude of high-frequency keywords are associated with it, including “offshore wind farm”, “system”, “energy” and “model”. The keyword “turbine” is linked with the structures of wind turbines and their impacts such as environmental influence on animals.
Beyond that, the UK leads the research on this topic both in quantity and in centrality at present. Then the No.2 to No.4 countries/regions are close to each other, but the USA has a higher centrality among the four. Spain ranks fifth but is also high in centrality.
Lastly, similar to the high-frequency keywords, the literature with high citations may also reflect the research focus. The much-cited literature are mainly focused on the study of offshore wind power transmission in the form of high voltage and dc current, its environmental influence and the treatment of its fluctuation.
Disclosure statement
No potential conflict of interest was reported by the author(s).
Additional information
Funding
References
- Ackermann, T. (Ed.). (2005). Wind power in power systems (Vol. 140). Chichester: John Wiley.
- Ackermann, T., & Soder, L. (2002). An overview of wind energy-status 2002. Renewable and Sustainable Energy Reviews, 6(1–2), 67–128. doi:10.1016/S1364-0321(02)00008-4
- Archer, C. L., & Jacobson, M. Z. (2005). Evaluation of global wind power. Journal of Geophysical Research: Atmospheres, 110(D12). doi:10.1029/2004JD005462
- Bergstrom, L., Juhlin, L., Liss, G., & Svensson, S. (1978). Simulator study of multiterminal HVDC system performance. IEEE Transactions on Power Apparatus and Systems, PAS-97(6), 2057–2066. doi:10.1109/TPAS.1978.354709
- Bilgili, M., Yasar, A., & Simsek, E. (2011). Offshore wind power development in Europe and its comparison with onshore counterpart. Renewable and Sustainable Energy Reviews, 15(2), 905–915. doi:doi:10.1016/j.rser.2010.11.006
- Billon, V. C., Taisne, J. P., Arcidiacono, V., & Mazzoldi, F. (1989). The corsican tapping - from design to commissioning tests of the 3rd terminal of the Sardinia Corsica Italy HVDC Link. [Article]. IEEE Transactions on Power Delivery, 4(1), 794–799. doi:10.1109/61.19272
- Blaabjerg, F., Teodorescu, R., Liserre, M., & Timbus, A. V. (2006). Overview of control and grid synchronization for distributed power generation systems. IEEE Transactions on Industrial Electronics, 53(5), 1398–1409. doi:10.1109/TIE.2006.881997
- Brandt, M. J., Diederichs, A., Betke, K., & Nehls, G. (2011). Responses of harbour porpoises to pile driving at the Horns Rev II offshore wind farm in the Danish North Sea. [Article]. Marine Ecology Progress Series, 421, 205–216. doi:10.3354/meps08888
- Bresesti, P., Kling, W. L., Hendriks, R. L., & Vailati, R. (2007). HVDC connection of offshore wind farms to the transmission system. [Article]. IEEE Transactions on Energy Conversion, 22(1), 37–43. Retrieved from ≤ Go to ISI≥://WOS:000244799800005 doi:10.1109/TEC.2006.889624
- Carrasco, J. M., Franquelo, L. G., Bialasiewicz, J. T., Galvan, E., Portillo Guisado, R. C., Prats, M. A. M., … Moreno-Alfonso, N. (2006). Power-electronic systems for the grid integration of renewable energy sources: A Survey. IEEE Transactions on Industrial Electronics, 53(4), 1002–1016. doi:10.1109/TIE.2006.878356
- Chen, C. M. (2004). Searching for intellectual turning points: Progressive knowledge domain visualization. [Article]. Proceedings of the National Academy of Sciences, 101(Supplement 1), 5303–5310. doi:10.1073/pnas.0307513100
- Chen, C. M. (2006). CiteSpace II: Detecting and visualizing emerging trends and transient patterns in scientific literature. [Article]. Journal of the American Society for Information Science and Technology, 57(3), 359–377. doi:10.1002/asi.20317
- Chen, C. M. (2016). CiteSpace: A practical guide for mapping scientific literature. Hauppauge, New York: Nova Science Publishers.
- Chen, C. M., Hu, Z. G., Liu, S. B., & Tseng, H. (2012). Emerging trends in regenerative medicine: a scientometric analysis in CiteSpace. Expert Opinion on Biological Therapy, 12(5), 593–608. doi:10.1517/14712598.2012.674507
- Chinchilla, M., Arnaltes, S., & Burgos, J. C. (2006). Control of permanent-magnet generators applied to variable-speed wind-energy systems connected to the grid. IEEE Transactions on Energy Conversion, 21(1), 130–135. doi:10.1109/TEC.2005.853735
- Drewitt, A. L., & Langston, R. H. W. (2006). Assessing the impacts of wind farms on birds. Ibis, 148(s1), 29–42. doi:10.1111/j.1474-919X.2006.00516.x
- Esteban, M. D., Diez, J. J., López, J. S., & Negro, V. (2011). Why offshore wind energy? Renewable Energy., 36(2), 444–450. doi:doi:10.1016/j.renene.2010.07.009
- Flourentzou, N., Agelidis, V. G., & Demetriades, G. D. (2009). VSC-Based HVDC power transmission systems: An overview. IEEE Transactions on Power Electronics, 24(3), 592–602. doi:10.1109/TPEL.2008.2008441
- Franck, C. M. (2011). HVDC circuit breakers: A review identifying future research needs. [Article]. IEEE Transactions on Power Delivery, 26(2), 998–1007. doi:10.1109/TPWRD.2010.2095889
- Fusco, F., Nolan, G., & Ringwood, J. V. (2010). Variability reduction through optimal combination of wind/wave resources – An Irish case study. Energy, 35(1), 314–325. doi:Retrieved from http://www.sciencedirect.com/science/article/pii/S0360544209004095 doi:10.1016/j.energy.2009.09.023
- Graham, S., Keirstead, J., & Millborrow, D. (2006). Diversified renewable energy resources. Oxford: The CarbonTrust.
- Gomis-Bellmunt, O., Liang, J., Ekanayake, J., King, R., & Jenkins, N. (2011). Topologies of multiterminal HVDC-VSC transmission for large offshore wind farms. Electric Power Systems Research, 81(2), 271–281. doi:doi:10.1016/j.epsr.2010.09.006
- Greenwood, A., Kanngiessner, K., Lesclae, V., Margaard, T., & Schultz, W. (1995). Circuit breakers for meshed multiterminal HVDC systems Part I: Introduction DC side substation switching under normal and fault conditions. Electra, (163), 98–122.
- Greenwood, A., Kanngiessner, K., Lesclae, V., Margaard, T., & Schultz, W. (1996). Circuit breakers for meshed multiterminal HVDC systems. Part II: Switching of transmission lines in meshed MTDC systems. Electra, (164), 62–82.
- Kanngiesser, K. W., Ring, H., & Wess, T. (1991). Simulator study on line fault clearing by DC circuit breakers in a meshed MTDC system. International Conference on AC and DC Power Transmission.
- Kjaer, S. B., Pedersen, J. K., & Blaabjerg, F. (2005). A review of single-phase grid-connected inverters for photovoltaic modules. IEEE Transactions on Industry Applications, 41(5), 1292–1306. doi:10.1109/TIA.2005.853371
- Ladenburg, J. (2008). Attitudes towards on-land and offshore wind power development in Denmark; choice of development strategy. Renewable Energy., 33(1), 111–118. doi:doi:10.1016/j.renene.2007.01.011
- Li, M., Porter, A. L., & Wang, Z. L. (2017). Evolutionary trend analysis of nanogenerator research based on a novel perspective of phased bibliographic coupling. Nano Energy., 34, 93–102. doi:doi:10.1016/j.nanoen.2017.02.020
- Lund, H. (2006). Large-scale integration of optimal combinations of PV, wind and wave power into the electricity supply. Renewable Energy, 31(4), 503–515. doi:doi:10.1016/j.renene.2005.04.008
- Luo, X., Zhang, X., Zhang, L., & Huang, G. (2017). Visualization of Chinese CBM research: A scientometrics review. Sustainability, 9(6), 980. Retrieved from https://www.mdpi.com/2071-1050/9/6/980 doi:10.3390/su9060980
- Morgan, E. C., Lackner, M., Vogel, R. M., & Baise, L. G. (2011). Probability distributions for offshore wind speeds. Energy Conversion and Management, 52(1), 15–26. doi:doi:10.1016/j.enconman.2010.06.015
- Morin, G., Bui, L. X., Casoria, S., & Reeve, J. (1993). Modeling of the Hydro-Quebec-New England HVDC system and digital controls with EMTP. IEEE Transactions on Power Delivery, 8(2), 559–566. doi:10.1109/61.216860
- Negra, N. B., Todorovic, J., & Ackermann, T. (2006). Loss evaluation of HVAC and HVDC transmission solutions for large offshore wind farms. [Article]. Electric Power Systems Research, 76(11), 916–927. doi:10.1016/j.epsr.2005.11.004
- Noori, M., Kucukvar, M., & Tatari, O. (2015). Economic input–output based sustainability analysis of onshore and offshore wind energy systems. International Journal of Green Energy, 12(9), 939–948. doi:10.1080/15435075.2014.890103
- Ossenbrugen, P. J., Pregent, G. P., & Meeker, L. D. (1979). Offshore wind power potential. [Article]. Journal of the Energy Division-ASCE, 105(1), 81–92.
- Perveen, R., Kishor, N., & Mohanty, S. R. (2014). Off-shore wind farm development: Present status and challenges. Renewable and Sustainable Energy Reviews, 29, 780–792. doi:doi:10.1016/j.rser.2013.08.108
- Pierpaoli, M., & Ruello, M. L. (2018). Indoor air quality: A bibliometric study. [Article]. Sustainability, 10(11), 3830. doi:10.3390/su10113830
- Prasai, A., Yim, J. S., Divan, D., Bendre, A., & Sul, S. K. (2008). A new architecture for offshore wind farms. [Article]. IEEE Transactions on Power Electronics, 23(3), 1198–1204. doi:10.1109/TPEL.2008.921194
- Qiu, H. H., & Liu, L. G. (2018). A study on the evolution of carbon capture and storage technology based on knowledge mapping. [Article]. Energies, 11(5), 1103. doi:10.3390/en11051103
- Robinson, J., Jovcic, D., & Joos, G. (2010). Analysis and design of an offshore wind farm using a MV DC grid. IEEE Transactions on Power Delivery, 25(4), 2164–2173. doi:10.1109/TPWRD.2010.2053390
- Stoutenburg, E. (2008). Combining wind and wave energy in offshore power plants to reduce variability in electrical generation. American Geophysical Union Fall Meeting, Paper Presented at the San Francisco.
- Stoutenburg, E., & Jacobson, M. (2009). Quantifying the Benefits of Combining Offshore Wind and Wave Energy. American Geophysical Union Fall Meeting, Paper Presented at the San Francisco.
- Stoutenburg, E., Jenkins, N., & Jacobson, M. (2010). Power output variations of co-located offshore wind turbines and wave energy converters in California. Renewable Energy, 35(12), 2781–2791. doi:doi:10.1016/j.renene.2010.04.033
- Wilhelmsson, D., & Malm, T. (2008). Fouling assemblages on offshore wind power plants and adjacent substrata. [Article]. Estuarine Coastal and Shelf Science, 79(3), 459–466. doi:10.1016/j.ecss.2008.04.020
- Yang, J., Fletcher, J. E., & O'Reilly, J. (2012). Short-circuit and ground fault analyses and location in VSC-based DC network cables. [Article; Proceedings Paper]. IEEE Transactions on Industrial Electronics, 59(10), 3827–3837. doi:10.1109/TIE.2011.2162712
- Yu, X. A., & Qu, H. (2010). Wind power in China-Opportunity goes with challenge. [Review]. Renewable and Sustainable Energy Reviews, 14(8), 2232–2237. doi:10.1016/j.rser.2010.03.038
- Zhang, S., Jiang, S., Lu, X., Ge, B. M., & Peng, F. Z. (2014). Resonance issues and damping techniques for grid-connected inverters with long transmission cable. [Article]. IEEE Transactions on Power Electronics, 29(1), 110–120. doi:10.1109/TPEL.2013.2253127
- Zhao, X., Wang, S., & Wang, X. (2018). Characteristics and trends of research on new energy vehicle reliability based on the web of science. Sustainability, 10(10), 3560.
- Zhou, W., Chen, Q., & Meng, S. (2019). Knowledge mapping of credit risk research: scientometrics analysis using CiteSpace. Economic Research-Ekonomska Istrazivanja, 32(1), 3451–3478. doi:10.1080/1331677X.2019.1660202