
 ?Mathematical formulae have been encoded as MathML and are displayed in this HTML version using MathJax in order to improve their display. Uncheck the box to turn MathJax off. This feature requires Javascript. Click on a formula to zoom.
Abstract
This work aims to conduct an empirical study on the social benefits of cultural tourism towns featuring the tourism performance industry in the integration of cultural tourism. It combines the BP deep neural network and fuzzy comprehensive analysis method to construct a BP-fuzzy comprehensive evaluation model and applies it to the social empirical investigation of Taiyuan Cultural Tourism Town. In addition, the weights of evaluation indicators such as cultural inheritance and protection, ecological environment improvement and commodity economic development on the development of small towns are calculated. The results show that the weight values of cultural inheritance and protection, ecological environment improvement and commodity economy development on the social results are 0.522, 0.570 and 0.424, respectively. A total of 41.20% of the life benefit G1 is excellent; 39.5% of the environmental benefit of G2 is excellent; and 40.5% of the economic benefit is good. A total of 30.76% of the total social results of the cultural tourism towns are excellent, 37.69% are good, 21.48% are qualified and 10.07% are unqualified. In conclusion, the total social results of TAIYUAN’s cultural tourism town are good. Cultural inheritance and protection, ecological environment improvement and commodity economy development are the key evaluation factors of social results.
JEL CODE:
1. Introduction
As time goes by, Chinese tourists can no longer be attracted by purely scenic spots. Therefore, seeking a new tourism industry model has always been a hot spot among scholars. Industrial convergence, as a more advanced mode for the vigorous development of the industry, has become the inevitable choice to promote the industry (Durán-Díaz et al., Citation2020). Tourism performing arts is one of the typical forms of business in the integrated development of culture and tourism in recent years and is an important carrier of cultural heritage, with both the charm of tourism and culture (Manzoor et al., Citation2019). In recent years, with the deepening of cultural tourism convergence, the tourism performing arts have been full of new vitality. According to relevant data from 2013 to 2017, the domestic number of channels for tourism performing art programs increased from 187 to 268, up by 43%. The number of shows of tourism performing arts increased from 53,336 to 85,753, representing an increase of 61%. The audience of tourism performing arts increased from 27.89 to 68.21 million, up by 145%. The box-office revenue of tourism performing arts increased from 2.26 to 5.15 billion Yuan, an increase of 128%. Especially in the past two years, with the maturity of the market, tourism performing arts projects have grown more rapidly. The characteristic cultural tourism town is a new urbanisation tourism mode that emerges at the historic moment in the cultural tourism convergence (Cao et al., Citation2022; Deng et al., Citation2022). As one of the cultural tourism towns in Hunan Province, the transportation infrastructure in Taiyuan has experienced vigorous progression in recent years, which further highlights its regional advantages (Wu et al., Citation2020). In addition, many cultural tourism projects of Taiyuan characteristics have been constructed, such as Tianyi Muguo (a resort characterised by things made of wood), the tea-horse ancient road, the tea-scented flower sea (a place characterised by all kinds of flowers) and Anhua Meishan Cultural Ecological Park, making Taiyuan more popular among tourists. Therefore, the Taiyuan small town in the Taiyuan region is explored in this study.
Fuzzy comprehensive evaluation can make use of some concepts of fuzzy mathematics (fuzzy linguistics, fuzzy logic and fuzzy topology) to provide actual comprehensive evaluation; that is, based on fuzzy mathematics, fuzzy comprehensive evaluation applies the fuzzy relationship synthesis principle to quantify some factors with unclear boundaries or difficult to quantify and then conducts comprehensive evaluation (Chen et al., Citation2021; Hidalgo & Maene, Citation2017; Ma et al., Citation2021). This method is mainly applicable to evaluation objectives with multiple variables and fuzziness. By constructing a reasonable evaluation system, the evaluation factors of expert scoring are effectively assigned, and then reliable results are obtained through analysis (Zhou et al., Citation2022). Artificial neural networks (ANNs) abstract the human brain neutron network from the perspective of information processing to build a simple model. Different networks are formed according to different connection modes, which have successfully solved many practical problems that are difficult to solve by modern computers in the fields of pattern recognition, intelligent robots, automatic control, biology, medicine, economy and so on. In essence, ANN is a complex network with a large number of simple components connected with each other (Yao et al., Citation2022). It is highly nonlinear and can carry out complex logic operations and realise nonlinear relations. In addition, it can simultaneously process quantitative and qualitative knowledge and has obvious distribution characteristics, which can be used to determine the index weight value in the comprehensive evaluation. Therefore, this study combines ANN with the fuzzy comprehensive evaluation method to carry out relevant research.
In summary, the construction of characteristic cultural tourism towns is conducive to the development of the regional economy, and related research has also attracted the attention of many scholars, but the combined application of deep learning and fuzzy comprehensive analysis methods is relatively rare. Therefore, this work first combines the BP deep neural network and fuzzy comprehensive analysis method to construct the BP-fuzzy comprehensive evaluation model and applies it to the social empirical survey of Taiyuan Cultural Tourism Town. The research significance of this work is to provide help for the establishment and development of cultural tourism towns with Chinese characteristics by discussing the influence weight of cultural heritage protection, ecological environment improvement, commodity economy development and other factors on the occurrence of the cultural tourism industry.
In Section 2, we arrange a literature review to elucidate the research progress on cultural tourism characteristic towns in recent years. In Section 3, we arrange the research method, expound the basic situation of Taiyuan cultural tourism town in the Taiyuan area selected in this article, the construction process of BP-fuzzy comprehensive evaluation model, and the establishment of social achievement evaluation index and system of cultural tourism town. In Section 4, we present the research results and list the calculation results of the weight values of the W-G judgment matrix and the G-H judgment matrix, as well as the membership degrees of various life indicators. In Section 5, we arrange a discussion based on the above data results and introduce previous research progress for comparative analysis. In Section 6, we arrange the conclusions based on the results and discussion to draw corresponding arguments and contributing implications.
2. Literature review
At present, there are many studies on the cultural tourism industry, mostly focusing on the qualitative analysis of specific scenic spots (Sgroi, Citation2020; Tepsing & Boonprakarn, Citation2017; Zheng et al., Citation2021a, Citation2021b). Thanh (Citation2018) studied traditional markets in the Mekong Delta, and the occurrence of traditional markets is one of the most interesting features of cultural tourism. There are many aspects of the cultural life of traditional markets in the region that have not been thoroughly exploited by tourism. Finally, some solutions for planning the traditional market and management plans for the formation of tourism experience are proposed to provide suggestions for the diverse cultural tourism activities in the region. Kong et al. (Citation2018), with the ancient town of Phoenix as the research subject, used Zaltman’s metaphor-inspired technology to qualitatively analyse the photos of the ancient town. They proposed that the typical image elements of the ancient town of Phoenix can incorporate active elements and that for the cultural tourism industry, it is important to determine its cultural theme to maintain the stability and continuity of its tourism image elements. Chen and Che (Citation2018) studied the cultural tourism industry in Shaxi Town, Jianchuan County, Dali, and found that the cultural tourism industry here is characterised by cultural creativity and supplemented by modern agricultural plateau characteristics, realising a multilevel industry that combines tourism, cultural innovation, agriculture and other forms of entertainment. Carbone et al. (Citation2020) defined the quality evaluation standard of the management of cultural tourist attractions, factoring into the ability to protect cultural assets, the ability to effectively communicate their importance, the commercialisation quality of tourists, and the ability to promote cross-cultural communication. The quality perception of cultural tourism entrepreneurs is divided into four types: reactionary, silent, pragmatic and enthusiastic. In addition, some documents apply deep learning or fuzzy comprehensive analysis to the study of the cultural tourism industry. Yang and Wang (Citation2020) took low-carbon tourist attractions in Zhejiang Province as an example, converted the pairwise comparison matrix based on linguistic terms into intuitionistic fuzzy preference relations, and proposed a global weight to obtain the lowest-level subcriteria. They then put forward a method for determining the comprehensive score of the scheme based on intuitionistic fuzzy value and showed how to construct the performance evaluation index system of low-carbon tourist attractions. Ma et al. (Citation2016) used the analytic hierarchy process and fuzzy comprehensive evaluation method to construct a new model for the comprehensive evaluation of tourism resources and applied it to the evaluation of a tourist city in Qionghai, Hainan. It was found that the model had relatively good performance in qualitative and quantitative analyses of tourist attractions. From the perspective of inbound tourism demand, Shi (Citation2020) used a BP neural network to extract seven influencing factors to construct an inbound tourism feature vector, and the number of inbound tourists in Yangjiang from 2018 to 2019 was predicted. The square error was 0.011695, and the R2 coefficient was 0.94744, which was acceptable. Based on a deep learning BP neural network, Li (Citation2020) constructed an artificial intelligence prediction model for the temporal and spatial distribution of tourists and collected spatial and temporal distribution data from five aspects: the probability distribution of tourist destinations, the transfer probability between tourist attractions, the scenic spot time distribution, the moving time between scenic spots, and the scenic spot area. It is found that this artificial intelligence model had high prediction accuracy and is suggested in the temporal and spatial distribution prediction of tourists. Wu et al. (Citation2020) proposed a Domby Heronian average operator with interval intuitionistic fuzzy numbers based on fuzzy mathematics theory and then constructed a new multiattribute decision-making method, which was applied to the ecological value evaluation of forest eco-tourism demonstration areas. It was found that the method had application value. Guo et al. (Citation2021) introduced a digital interactive system based on hybrid augmented reality (AR) and visual reality technology (VR) for historical town tour scenes. The system combined AR, VR and mobile Internet technologies to enable online digital interaction to improve the user experience while using unmanned aerial photography methods. It could capture detailed panoramas of various scenic spots in historic towns and present 3D models in the form of augmented reality and online viewing, which can provide users with novel and rich experiences.
It is rare to use deep learning technology and fuzzy comprehensive evaluation methods to evaluate the social results of the tourism industry. They are always used alone. Therefore, in this study, the ANN neural network and fuzzy comprehensive evaluation are combined to construct a new artificial intelligence evaluation model of cultural tourism town social results, which is expected to provide a basis for the development of cultural tourism towns.
3. Materials and methods
3.1. Selection of research subjects
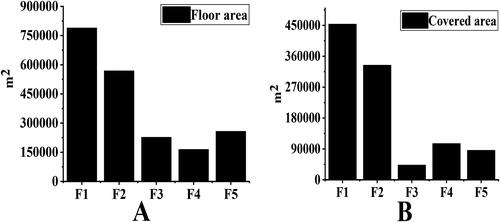
In this study, the Taiyuan cultural tourism town in the Taiyuan region is selected as the research subject. The featured functional areas of this town include the health care community (F1), agricultural sightseeing and leisure zone (F2), outdoor ecological experience zone (F3), waterfront leisure zone (F4) and folk performing arts culture experience zone (F5). As shown in , the healthcare community covers a floor space of 789,167 square meters and a building area of 453,717 square meters. It is mainly set for the elderly to endow them with a better recuperation environment and rich spiritual and cultural enjoyment, away from the hustle and bustle of the city. The agricultural sightseeing and leisure zone covers a floor space of 568,807 square meters and a building area of 334,107 square meters, respectively. It is a form of tourism that combines leisure and sightseeing tourism with agriculture. The development and utilisation of pastoral landscapes, natural ecology and environmental resources, combined with agriculture, forestry, animal husbandry and fishery activities, provides tourists with a good agricultural and rural experience. The outdoor ecological experience zone covers 227,362 and 43,189 square meters. It takes nature education, sightseeing and leisure as its core and provides a platform for tourists to get close to nature and embrace nature. The waterfront leisure area covers a floor space of 164,911 square meters and a building area of 105,726 square meters. It is mainly a fish-shaped lake scenic area, including fish-shaped lake squares and fish-shaped lake reservoirs. The floor space and building area of the folk performing arts cultural experience area are 257,737 square meters and 86,081 square meters, respectively. It focuses on ethnic cultural ecology and promotes the convergence of ethnic craft and creative industries by creating ethnic cultural themes and at the same time provides a platform for tourists to communicate with ethnic cultures.
Figure 1. The floor space and building area of functional areas in the TAIYUAN cultural tourism town. Note: A refers to the floor space; B is the building area.
Source: authors’ work.
3.2. Definition of relevant concepts
3.2.1. Cultural tourism town
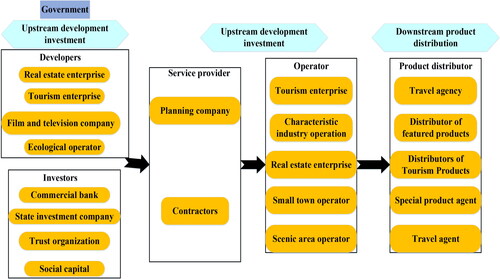
A cultural tourism town refers to a space with clear industrial orientation, cultural characteristics, tourism characteristics and certain community functions, which is different from an administrative town. It can turn the idle resources of rural areas, such as green mountains and clear waters, pastoral interests, lifestyle and traditional culture, into economic advantages, which is a favorable way to promote the integration of urban and rural areas. It can also drive urban capital to the countryside and improve rural infrastructure, public services and environmental health, which is also an effective form of local employment and urbanisation for farmers. In general, the cultural and tourism characteristic town is a tourism town with culture as the entry point to develop local natural and cultural facilities with marketing value, which combines various elements such as food, clothing, housing and transportation. Currently, China’s cultural tourism towns have also formed a preliminary industrial chain, as shown in , including three stages of upstream development and investment, midstream planning and operation and downstream product distribution. The upstream development investment includes investors and developers, the midstream planning and operation includes service providers and operators, the downstream product distribution includes product distributors and distribution channels, and at the end are the users.
Figure 2. The industry chain diagram of China’s characteristic cultural tourism towns.
Source: authors’ work.
3.2.2. Social results of cultural tourism towns
Social results refer to the maximum use of limited resources to meet the growing material and cultural needs of people in society. Specifically, it is the sum of the contributions of a certain project to social employment, residents’ living standards and social welfare, which is the benefit from the macro perspective of the whole society. For the social results of the cultural tourism town, its development and construction can benefit local residents’ local employment, living standards and systems (Chen, Citation2019). The coordination and cooperation between government supervision and the market economy are formed through the operation of social capital in the development of the town.
3.3. Evaluation index and system construction of social results of cultural tourism towns
At present, although an increasing number of experts and scholars have analysed the benefits of cultural tourism towns and established some relevant indicator systems, there are few studies on the social results of cultural tourism towns. Most of the literature focuses on the economic benefit of cultural tourism towns (Andraz & Rodrigues, Citation2016; Lin et al., Citation2022; Lozano-Oyola et al., Citation2019; Qiao et al., Citation2022; Sun & Higham, Citation2021; Yousif, Citation2018). Therefore, in this study, the literature on sustainable tourism, tourism management and cultural tourism published by predecessors is summarised. Based on national conditions and policies, a set of evaluation indexes is finally identified for the social results of cultural tourism towns. The results are shown in . According to these selected social results evaluation indexes, the social results evaluation index system of the cultural tourism town is constructed, as shown in .
Figure 3. The evaluation index system of the social results of cultural tourism towns.
Source: authors’ work.
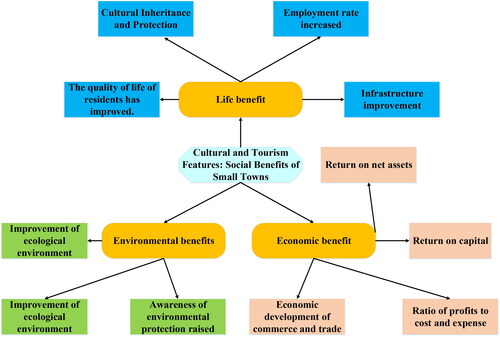
Table 1. Evaluation index of the social results of cultural tourism towns.
3.4. Expert scoring data
Twenty tourism-related experts are invited to score the importance of each index relative to the higher-level index to which it belongs. 1, 3, 5, 7 and 9 indicate that index a and index b are equally important, index a is slightly more important than index b, index a is relatively more important than index b, index a is more important than index b, index a is absolutely more important than index b, and 2, 4, 6, 8 represent the median of the abovementioned adjacent results ().
Table 2. Expert scoring table.
Table 3. Calculation of the weight value of the W-G judgment matrix.
3.5. Construction of the BP-fuzzy comprehensive evaluation model for the social results of cultural tourism towns
Fuzzy processing on each index is carried out. Then, the fuzzy factors are quantitatively processed to determine the output expected value of the BP neural network, and the model is created through sample training and learning. The specific thought process is as follows.
Step 1: Establishment of a set of evaluation indicators. After the evaluation indicators are selected, they are all put into a factor set U, which can be expressed as follows.
(1)
(1)
In the equation, is the evaluation index factor, and
represents the number of evaluation factors at the same level.
Step 2: Establishment of the comment set. According to the evaluation results of the evaluation system, evaluation set V can be expressed as follows.
(2)
(2)
In the equation, represents the evaluation result of the jth type, and m represents the number of evaluation grades.
Step 3: Establishment of the weight coefficient of the evaluation index. The analytic hierarchy process is used to classify the evaluation indicators (Gkoumas, Citation2019). The first layer is the evaluation target layer, and the second layer is the criterion layer, which can be expressed as follows.
(3)
(3)
The third layer is the quantification of evaluation indicators.
(4)
(4)
Then, the index weight of each layer is obtained by building a judgment matrix and normalisation. In this study, the weight of the second layer is set as W, which can be expressed as follows.
(5)
(5)
The weight of the indicator of the third layer is set as follows.
(6)
(6)
In the equation,
and
Step 4: First-level fuzzy comprehensive evaluation. In this study, the single-level evaluation method is used to obtain the membership matrix of each evaluation index, which can be expressed as follows.
(7)
(7)
In the equation, m represents the number of evaluation criteria, and n represents the number of evaluation factors. By combining the weight coefficient of each evaluation index with the membership degree matrix, the evaluation result vector of the index factor can be expressed as follows.
(8)
(8)
Step 5: Second-level fuzzy comprehensive evaluation. Based on the first-level fuzzy comprehensive evaluation results, there is also a corresponding relationship between each evaluation index, so the evaluation results of each index are integrated using fuzzy mathematics calculations. Then, the final evaluation result (proportional representation) vector obtained is as follows.
(9)
(9)
A BP neural network is then used in this study to determine the weight value of the comprehensive evaluation index (social results). As shown in , the BP neural network is divided into the input layer, the hidden layer and the output layer.
Figure 4. Three-layer BP neural network structure.
Source: authors’ work.
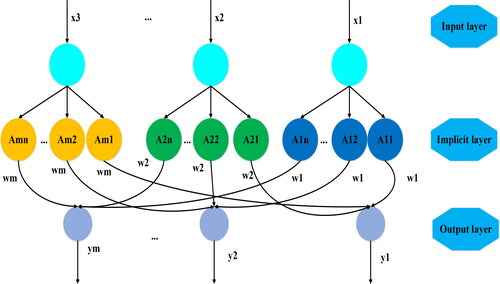
Step 6: The input layer. The input element is the value of each evaluation index. There are m neurons in the input layer, and the input and output of the neurons can be expressed as follows.
(10)
(10)
(11)
(11)
In the equations,
represents the input, and
is the output.
Step 7: the hidden layer. In the constructed BP network, there are n comment levels and a total of neurons. In this study, trigonometric functions are introduced to express membership functions, which can be expressed as
Therefore, n = 4; then, the evaluation index membership function is calculated as follows.
When the corresponding membership function parameters are
and
(12)
(12)
In the equation, represents a membership function. When
the corresponding membership function parameters are
and
(13)
(13)
When the corresponding membership function parameters are
and
(14)
(14)
According to the above calculation method, the output of the hidden layer can be obtained as follows.
(15)
(15)
In the equation, represents the numerical membership function of the jth comment level, and
represents the membership value of each level.
Step 8: The output layer. The output layer mainly evaluates each input vector and obtains the corresponding evaluation vector according to the value of the evaluation level. The output can be expressed as follows.
(16)
(16)
In the equation,
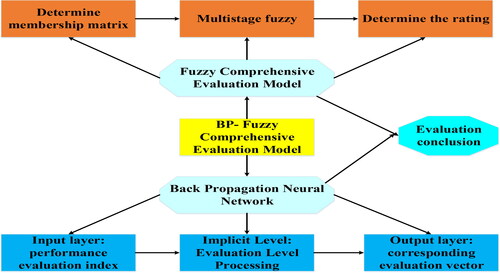
In summary, the structure of the BP-fuzzy comprehensive evaluation model for the social results of cultural tourism towns in this study is shown in .
Figure 5. Schematic diagram of the construction of the BP-fuzzy comprehensive evaluation model for the social results of cultural tourism towns.
Source: authors’ work.
4. Results
4.1. The calculation of each index weight
4.1.1. Calculation of the weight value of the W-G judgment matrix
According to the model constructed in this study, the index system is first divided into three levels: I. Target layer: social results of the cultural tourism town, recorded as W; II. Criterion layer: living benefit G1, environmental benefit G2, economic benefit G3; III. index layers: cultural inheritance and protection H1, increase the rate of employment H2, promotion of the quality of life of residents H3, infrastructure improvements H4, the improvement of the ecological environment H5, green vegetation protection H6, the improvement of residents’ environmental awareness H7, the commodity economy development H8, ROE H9, RPCE H10, ROC H11.
Then, the judgment matrix between the layers of W-G can be calculated as shown in . After calculation, w1 = 8.333, w2 = 6 and w3 = 1.643. After normalisation, the eigenvector can be obtained as follows According to the consistency test, CI = 0.074 and CR = 0.052, which are both less than 0.1. The relative index weights of the criterion layer factors (G1, G2 and G3) to the target layer W are 0.522, 0.376 and 0.103, respectively.
4.1.2. G-H Judgment matrix weight value calculation
The judgment matrix between g1-h layers is shown in . After calculation, w4 = 16, w5 = 1.676, w6 = 9.333 and w7 = 4.533. After normalisation, the eigenvector can be obtained as follows According to the consistency test, CI = 0.050 and CR = 0.039, which are both less than 0.1. Then, the relative index weights of the index layer factors (H1, H2, H3 and H4) to G1 in the criterion layer are 0.507, 0.053, 0.296 and 0.144, respectively.
Table 4. Calculation of the weight value of the G1-H judgment matrix.
The judgment matrix between the G2-H layers is shown in . After calculation, w8 = 9, w9 = 1.450 and w10 = 5.333. After normalisation, the eigenvector can be obtained as follows According to the consistency test, CI = 0.047 and CR = 0.062, which are both less than 0.1. Then, the relative index weights of the index layer factors (H5, H6 and H7) to the criterion layer G2 are 0.570, 0.092 and 0.338, respectively.
Table 5. Calculation of the weight value of the G2-H judgment matrix.
The judgment matrix between the layers of G3-H is shown in . After calculation, w8 = 11, w9 = 4.45, w10 = 5.666 and w11 = 4.833. After normalisation, the eigenvector can be obtained as follows According to the consistency test, CI = 0.081 and CR = 0.056, which are both less than 0.1. Then, the relative index weights of the index layer factors (H8, H9, H10 and H11) to the G3 of the criterion layer are shown in , which are 0.424, 0.175, 0.218 and 0.186, respectively.
Figure 6. Relative weight of index layer factors (H8, H9, H10 and H11) on G1 of criterion layer.
Source: authors’ work.
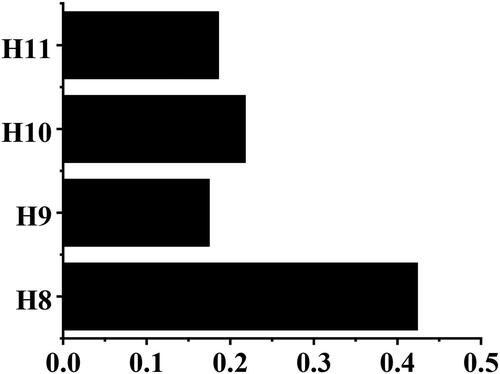
Table 6. Calculation of the weight value of the G3-H judgment matrix.
4.1.3. The weight value of the W-H index
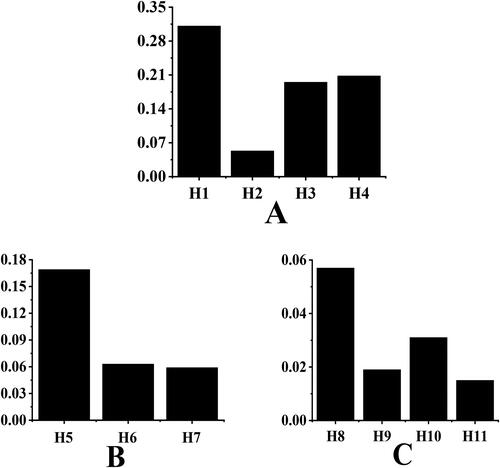
The weight values of the W-G and G-H judgment matrices obtained from 3.1.1 and 3.1.2 can be used to calculate the weight values of each factor of the index layer to the target layer W, as shown in . In terms of life benefit G1, the weight value of the H1 index to target layer W is the largest (0.311), followed by the H4 index (0.208). In terms of environmental benefit G2, the weight value of the H5 index to target layer W is the largest (0.169). In terms of economic benefit G3, the weight value of the H8 index to target layer W is the largest (0.057), followed by the H10 index (0.031).
Figure 7. The weight value of each factor of the index layer to the target layer W. (a) the index of life benefit; (b) the index of environmental benefit; (c) the economic benefit index.
Source: authors’ work.
4.2. The membership degree of each index
4.2.1. The membership matrix of each index of life benefit
As shown in , the membership degree of H1 in the four indexes of life benefit to the comment set is Among them, 48.1% are excellent, 36.2% are good and 15.7% are qualified. The membership degree of H2 to the comment set is
A total of 27.4% are excellent, 40.5% are good and 32.1% are qualified. The membership degree of H3 on the comment set is
A total of 28.8% are excellent, 52.6% are good and 18.6% are qualified. The membership degree of H4 to the comment set is
A total of 43.3% are excellent, 37.1% are good and 19.6% are qualified.
Table 7. The membership matrix of each index of life benefit.
4.2.2. Membership matrix of each index of environmental benefit
As shown in , the membership degree of H5 in the three indexes of life benefit to the comment set is A total of 24.7% are excellent, 43.1% are good and 24% are qualified. The membership degree of H6 to the comment set is
A total of 31.8% are excellent, 37.7% are good and 30.5% are qualified. The membership degree of H7 to the comment set is
A total of 49.7% are excellent, 31.1% are good, 17.6% are qualified and 1.6% are unqualified.
Table 8. Membership matrix of each index of environmental benefit.
4.2.3. Membership matrix of each index of economic benefit
As shown in , the membership degree of H8 in the four indexes of economic benefit to the comment set is A total of 26.6% are excellent, 60.8% are good and 12.6% are qualified. The membership degree of H9 on the comment set is
A total of 19.8% are excellent, 67.7% are good and 12.8% are qualified. The membership degree of H10 to the comment set is
A total of 5.3% are excellent, 81.1% are good and 13.6% are qualified. The membership degree of H10 to the comment set is
A total of 3.8% are excellent, 79.3% are good and 16.9% are qualified.
Table 9. Membership matrix of each index of economic benefit.
4.3. Multilevel fuzzy comprehensive evaluation results
4.3.1. The results of the first-level fuzzy comprehensive evaluation
As shown in , according to the first-level fuzzy operation equation, 41.20% of the G1 life benefit is excellent, 35.80% is good and 23% is qualified, all of which are qualified. For environmental benefit G2, 39.5% is excellent, 34.7% is good, 15.1% is qualified and 10.7% is unqualified. A total of 22.7% of the economic benefits are excellent, 40.5% are good, 35.5% are qualified and 1.3% are unqualified.
Table 10. Calculation of the weight value of the G3-H judgment matrix.
4.3.2. The results of the second-level fuzzy comprehensive evaluation
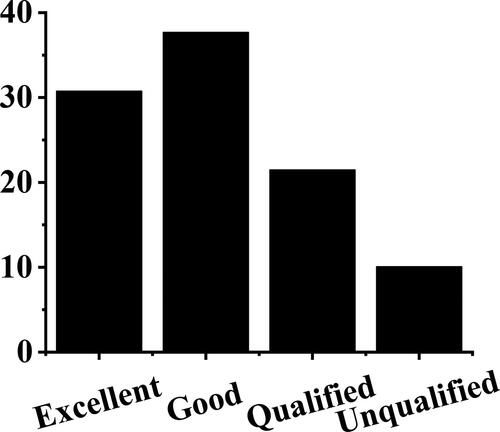
As shown in , according to the relative weight values of each factor of the criterion layer to the target layer, the evaluation level of the cultural tourism town can be obtained through fuzzy calculation. A total of 30.76% of the social results of the cultural tourism towns are excellent, 37.69% are good, 21.48% are qualified and 10.07% are unqualified.
Figure 8. The results of the second-level fuzzy comprehensive evaluation.
Source: authors’ work.
5. Discussion
In recent years, with the rise of mass tourism and the vigorous promotion of region-wide tourism, people’s demand for tourism quality has been increasing. Traditional sightseeing tourism, which mainly displays natural resources, is far from meeting people’s growing demand for tourism. As the characteristic product of the tourism performing arts industry in the current cultural tourism convergence, the cultural tourism town has become a new direction of tourism development in the new era (Zerihun, Citation2017). Based on the BP neural network and fuzzy comprehensive analysis method, the BP-fuzzy comprehensive evaluation model of the social results of cultural tourism towns is constructed and analysed in this study. The relative index weights of the criterion layer factors (G1, G2 and G3) to the target layer W are 0.522, 0.376 and 0.103, respectively, which is similar to the research results of Vieira et al. (Citation2016), indicating that the weighted value of life benefit is the largest, and it is an important factor in the evaluation of the social results of cultural tourism towns. The relative index weights of H1, H2, H3 and H4 to G1 in the criterion layer are 0.507, 0.053, 0.296 and 0.144, respectively, indicating that in the life benefit, the weight value of cultural inheritance and protection is the largest, and it has the greatest influence on the evaluation results of the life benefit of cultural tourism towns (Krajnović & Gortan-Carlin, Citation2017). The relative index weights of the index layer factors (H5, H6 and H7) on criterion layer G2 are 0.570, 0.092 and 0.338, respectively, which is consistent with the research results of Hongbo (Citation2016), indicating that the weight value of ecological environment improvement is the largest among the environmental benefits, and it has the greatest influence on the evaluation results of the environmental benefits of cultural tourism towns. The relative index weights of the index layer factors (H8, H9, H10 and H11) on criterion layer G3 are 0.424, 0.175, 0.218 and 0.186, respectively, indicating that the development weight value of the commodity economy is the largest in the economic benefit, and it has the greatest influence on the evaluation results of the economic benefit of cultural tourism towns (Jie & Tongyun, Citation2017). According to the above analysis, cultural inheritance and protection, ecological environment improvement, and commodity economy development are the key factors in evaluating the social results of cultural tourism towns.
In addition, according to the first-level fuzzy comprehensive evaluation, 41.20% of the life benefit G1 is excellent, and 35.80% is good. In the environmental benefit G2, 39.5% is excellent and 34.7% is good. A total of 22.7% of the economic benefit is excellent and 40.5% is good, which is different from the research results of Aydın et al. (Citation2017). The reason may be that different regions have distinct priorities in tourism industry development, indicating that the life benefits and environmental benefits of the town are excellent, while the economic benefits are good. Cultural inheritance and protection have the highest weight on the social results of the target layer, and the construction of the tourism characteristic town is more conducive to carrying forward and spreading the traditional culture and to the harmonious development of society (Fangmei & Yingjie, Citation2017; Yoshihara & Inoue, Citation2018). The evaluation grade of environmental benefit is excellent, which indicates that the construction of the whole characteristic town causes little damage to the local environment. Having a good ecological environment is a prerequisite for cultural tourism towns to meet tourists’ viewing and behavioral psychological activities, and ecological services are instrumental in improving tourism quality. This illustrates that the construction of the cultural tourism town causes less damage to the local environment, which is in line with the psychological appeal of tourists (Ranasinghe & Cheng, Citation2018). According to the second-level fuzzy evaluation results, 30.76% of the total social results of the cultural tourism town are excellent, 37.69% are good, 21.48% are qualified and 10.07% are unqualified, which is similar to the research results of Cheng et al. (Citation2017). The social results evaluation grade of the characteristic town is good, which indicates that the development and construction of the characteristic town are of great significance.
6. Conclusions
Based on a BP neural network and fuzzy comprehensive analysis method, a BP-fuzzy comprehensive evaluation model is constructed for the social results of cultural tourism towns, and an empirical study on the social results of cultural tourism towns is performed. The results show that the evaluation level of life benefits and environmental benefits in Taiyuan cultural tourism town is excellent, the evaluation level of economic benefits is good, and the total social results level is good. Cultural inheritance and protection, ecological environment improvement and commodity economy development are the key factors in evaluating the social results of cultural tourism towns. However, there are still some shortcomings in this study. Compared with existing studies, there are still some shortcomings in the method design of this work. The selection of social outcome factors for cultural tourism towns is subjective, and the verification of the deep learning evaluation model is not sufficient. Therefore, in the following research, the selection method of each index will be adjusted by referring to previous literature, and the evaluation performance experiment of the deep learning model will be carried out separately. Overall, the research results of this work provide a theoretical reference for the development and construction of characteristic cultural tourism towns in China and promote the application feasibility of deep learning technology.
Ethics statement
All subjects gave their informed consent for inclusion before they participated in the study. The study was conducted in accordance with the Declaration of Helsinki, and the protocol was approved by the Ethics Committee of Taiyuan University of Technology.
Disclosure Statement
The authors declare no conflict of interest.
Additional information
Funding
References
- Andraz, J. M., & Rodrigues, P. M. M. (2016). Monitoring tourism flows and destination management: Empirical evidence for Portugal. Tourism Management, 56, 1–7. https://doi.org/10.1016/j.tourman.2016.03.019
- Aydın, F., Çepni, O., & Turgut, T. (2017). Investigation of Alternative Tourism Types and Sights via Geographic Information Systems: The Exaple of Safranbolu. ISPRS Annals of the Photogrammetry, Remote Sensing and Spatial Information Sciences, IV-4/W4, 97–100. https://doi.org/10.5194/isprs-annals-IV-4-W4-97-2017
- Cao, B., Zhao, J., Liu, X., Arabas, J., Tanveer, M., Singh, A. K., & Lv, Z. (2022). Multiobjective evolution of the explainable fuzzy rough neural network with gene expression programming. IEEE Transactions on Fuzzy Systems, 30(10), 4190–4200. https://doi.org/10.1109/TFUZZ.2022.3141761
- Carbone, F., Oosterbeek, L., Costa, C., & Ferreira, A. M. (2020). Extending and adapting the concept of quality management for museums and cultural heritage attractions: A comparative study of southern European cultural heritage managers’ perceptions. Tourism Management Perspectives, 35, 100698. https://doi.org/10.1016/j.tmp.2020.100698
- Chen, H. S. (2019). Establishment and application of an evaluation model for Orchid island sustainable tourism development. International Journal of Environmental Research and Public Health, 16(5), 755. https://doi.org/10.3390/ijerph16050755
- Chen, Q., & Che, Z. (2018). The regional development characteristics of smaller towns in Yunnan Province: A study orientated by cultural tourism industries. Journal of Kunming University of Science and Technology (Social Science), 4(13), 85–91.
- Cheng, C., Zhenbin, Z., & Yan, H. (2017). Social landscape sensitivity analysis of western tourism community: A case study of Langmusi town in Gannan. Geographical Research, 36(5), 899–912.
- Chen, H., Miao, F., Chen, Y., Xiong, Y., & Chen, T. (2021). A hyperspectral image classification method using multifeature vectors and optimized KELM. IEEE Journal of Selected Topics in Applied Earth Observations and Remote Sensing, 14, 2781–2795. https://doi.org/10.1109/JSTARS.2021.3059451
- Deng, W., Ni, H., Liu, Y., Chen, H., & Zhao, H. (2022). An adaptive differential evolution algorithm based on belief space and generalized opposition-based learning for resource allocation. Applied Soft Computing, 127, 109419. https://doi.org/10.1016/j.asoc.2022.109419
- Durán-Díaz, P., Armenta-Ramírez, A., Kurjenoja, A. K., & Schumacher, M. (2020). Community development through the empowerment of indigenous women in Cuetzalan Del Progreso. Land, 9(5), 163. https://doi.org/10.3390/land9050163
- Fangmei, W., & Yingjie, W. (2017). The research of development of ancient village tourism from the perspective of cultural gene theory——Take Longtan Ancient Village in Guizhou as an Example. Cultural Industry Research, 34(2), 21.
- Gkoumas, A. (2019). Evaluating a standard for sustainable tourism through the lenses of local industry. Heliyon, 145(11), e02707. https://doi.org/10.1016/j.heliyon.2019.e02707
- Guo, J., Liu, M., & Guo, Y. (2021). An AR/VR-hybrid interaction system for historical town tour scenes incorporating mobile internet[C]//2021 International. Conference on Digital Society and Intelligent Systems (DSInS) (vol. 3, pp. 21–24). IEEE.
- Hidalgo, C., & Maene, O. (2017). The nature of Spain’s International Cultural Tourism throughout the Economic Crisis (2008–2016): A macroeconomic analysis of tourist arrivals and spending. Economies, 5(3), 32. https://doi.org/10.3390/economies5030032
- Hongbo, Z. H. O. U. (2016). Cultural creative integration development under the perspective of ancient town tourism project development——Anhui Tongyang Town as an example. Journal of Huzhou University, 4, 20.
- Jie, Z., & Tongyun, D. (2017). Programs for suburban leisure tourism development in line with conditions of Linpan in Western Sichuan: A case study of Huayuan Town in Xinjin County. Journal of Landscape Research, 9(6), 114–118.
- Kong, L., Wu, J., Wei, L., Cao, F., & Zhou, N. (2018). Typical tourism image elements of Fenghuang Ancient Town analyzed from the tourist gaze perspective: Based on the Zaltman metaphor elicitation technique. Tourism Tribune, 33(1), 42–52.
- Krajnović, A., & Gortan-Carlin, I. P. (2017). Strategic management in cultural tourism with emphasis on event management: The case study of Croatia. Ekonomska Misao i Praksa, 45(2), 791–812.
- Li, X. (2020). Space-time distribution model of visitor flow in tourism culture construction via back propagation neural network model. Personal and Ubiquitous Computing, 24(2), 223–235. https://doi.org/10.1007/s00779-019-01342-w
- Lin, H. H., Hsu, I. C., Lin, T. Y., Tung, L. M., & Ling, Y. (2022). After the epidemic, is the smart traffic management system a key factor in creating a green leisure and tourism environment in the move towards sustainable urban development? Sustainability, 14(7), 3762. https://doi.org/10.3390/su14073762
- Lozano-Oyola, M., Blancas, F. J., González, M., & Caballero, R. (2019). Sustainable tourism tags to reward destination management. Journal of Environmental Management, 250, 109458. https://doi.org/10.1016/j.jenvman.2019.109458
- Manzoor, F., Wei, L., Asif, M., Haq, M. Z. u., & Rehman, H. u (2019). The contribution of sustainable tourism to economic growth and employment in Pakistan. International Journal of Environmental Research and Public Health, 16(19), 3785. https://doi.org/10.3390/ijerph16193785
- Ma, J., Sun, G., Shi, X., Li, D., & Ma, S. (2016). Modeling, application of a new tourism resources assessment: based on analytic hierarchy process and fuzzy comprehensive evaluation method. Journal of Residuals Science & Technology, 13(8), 493–500.
- Ma, Z., Zheng, W., Chen, X., & Yin, L. (2021). Joint embedding VQA model based on dynamic word vector. PeerJ. Computer Science, 7, e353.
- Qiao, G., Xu, J., Ding, L., & Chen, Q. (2022). The impact of volunteer interaction on the tourism experience of people with visual impairment based on a mixed approach. Current Issues in Tourism, 36, 1–18. https://doi.org/10.1080/13683500.2022.2098093
- Ranasinghe, R., & Cheng, L. (2018). Tourism-induced mobilities and transformation of indigenous cultures: where is the Vedda community in Sri Lanka heading to? Journal of Tourism and Cultural Change, 16(5), 521–538. https://doi.org/10.1080/14766825.2017.1393081
- Sgroi, F. (2020). Forest resources and sustainable tourism, a combination for the resilience of the landscape and development of mountain areas. The Science of the Total Environment, 736, 139539. https://doi.org/10.1016/j.scitotenv.2020.139539
- Shi, X. (2020). Tourism culture and demand forecasting based on BP neural network mining algorithms. Personal and Ubiquitous Computing, 24(2), 299–308. https://doi.org/10.1007/s00779-019-01325-x
- Sun, Y. Y., & Higham, J. (2021). Overcoming information asymmetry in tourism carbon management: The application of a new reporting architecture to Aotearoa New Zealand. Tourism Management, 83, 104231. https://doi.org/10.1016/j.tourman.2020.104231
- Tepsing, P., & Boonprakarn, K. (2017). Cultural tourism management: A case study of the Chao Mae Tomo festival, Su-ngai Kolok town, Narathiwat province. Kasetsart Journal of Social Sciences, 38(1), 493–505.
- Thanh, N. T. (2018). Solutions to thoroughly exploit traditional cultural values of markets in tourism activities: A case study of the Mekong River Delta of Vietnam. International Journal of Culture and Tourism Research, 11(1), 34–40.
- Vieira, I., Rodrigues, A., Fernandes, D., & Pires, C. (2016). The role of local government management of tourism in fostering residents’ support to sustainable tourism development: Evidence from a Portuguese historic town. International Journal of Tourism Policy, 6(2), 109–135. https://doi.org/10.1504/IJTP.2016.077967
- Wu, L., Wei, G., Wu, J., & Wei, C. (2020). Some interval-valued intuitionistic fuzzy Dombi Heronian mean operators and their application for evaluating the ecological value of forest ecological tourism demonstration areas. International Journal of Environmental Research and Public Health, 17(3), 829. https://doi.org/10.3390/ijerph17030829
- Yang, X., & Wang, Z. J. (2020). Intuitionistic fuzzy hierarchical multi-criteria decision making for evaluating performances of low-carbon tourism scenic spots. International Journal of Environmental Research and Public Health, 17(17), 6259. https://doi.org/10.3390/ijerph17176259
- Yao, R., Guo, C., Deng, W., & Zhao, H. (2022). A novel mathematical morphology spectrum entropy based on scale-adaptive techniques. ISA Transactions, 126, 691–702. https://doi.org/10.1016/j.isatra.2021.07.017
- Yoshihara, H., & Inoue, N. (2018). The sacred landscape of ainu culture and its cultural landscapes: Case study on the conservation strategy in Biratori City, Hokkaido. Almatourism-Journal of Tourism, Culture and Territorial Development, 9(8), 107–128.
- Yousif, A. (2018). Culture-nature journey knowledge cafe. The double-edged sword of cultural tourism and the conservation of natural and cultural assets: Case studies from the Eastern Adriatic. Historic Environment, 30(3), 34.
- Zerihun, M. E. (2017). Web based GIS for tourism development using effective free and open source software case study: Gondor town and its surrounding area, Ethiopia. Journal of Geographic Information System, 09(01), 47–58. https://doi.org/10.4236/jgis.2017.91004
- Zheng, W., Liu, X., Ni, X., Yin, L., & Yang, B. (2021a). Improving visual reasoning through semantic representation. IEEE Access. 9, 91476–91486. https://doi.org/10.1109/ACCESS.2021.3074937
- Zheng, W., Yin, L., Chen, X., Ma, Z., Liu, S., & Yang, B. (2021b). Knowledge base graph embedding module design for Visual question answering model. Pattern Recognition, 120, 108153. https://doi.org/10.1016/j.patcog.2021.108153
- Zhou, X., Ma, H., Gu, J., Chen, H., & Deng, W. (2022). Parameter adaptation-based ant colony optimization with dynamic hybrid mechanism. Engineering Applications of Artificial Intelligence, 114, 105139. https://doi.org/10.1016/j.engappai.2022.105139