
 ?Mathematical formulae have been encoded as MathML and are displayed in this HTML version using MathJax in order to improve their display. Uncheck the box to turn MathJax off. This feature requires Javascript. Click on a formula to zoom.
Abstract
Outsourcing to Contract Research Organisations (CROs) has become a widespread practice by bio-pharmaceutical firms seeking to reduce the costs associated with the development of new products. This study empirically analyses the efficiency of the CROs industry by looking at a sample of firms operating internationally over 2012–2020. We compute Data Envelopment Analysis (DEA) efficiency scores for each firm and year. The average bootstrap efficiency in the sample is 0.665, robust across specifications and increasing over 2012–2020. The best performing firms are PPD Australia, Centre Recherches Biologiques and Oy Medfiles. Our results suggest that very large and very small companies outperform the rest in terms of efficiency, which points to the co-existence of increasing returns to scale and niche competitive advantages in the industry.
1. Introduction
Research and Development (R&D) is a key factor in the bio-pharmaceutical industry. The median R&D investment cost to introduce a new drug is 985.3 million dollars, while the mean amounts to 1,335.9 million dollars (Wouters et al., Citation2020). The cost of developing a drug is substantial and has escalated in the last decades. Clinical trials, which are an important component of drug development, are getting increasingly complex, long and expensive (Scannell et al., Citation2012).
At the same time, competition and fiscal authorities exert downward pressures on drug prices. In such circumstances, the pharmaceutical sector must adopt new R&D strategies to compete successfully and survive.
One of such strategies is the outsourcing of key stages of the value chain, such as clinical trials, to CROs. CROs emerged in the 1980s as service companies supporting the bio-pharmaceutical industry in the development of new drugs (Mirowski & Van Horn, Citation2005). Prior to their existence, pharmaceutical companies had to internally undertake both the development of new products and the enlargement of therapeutic indications for the existing drugs. This constraint was especially limiting for small or medium size firms with no internal R&D capabilities.
Initially CROs focused on pre-clinical investigation and clinical trials, but gradually their portfolio of services expanded to cover all stages of drug development. The number of CROs has grown steadily in recent decades. Although the market is undergoing consolidation, it is still quite fragmented. There are two main categories of players in the market: very large companies (top 10% CROs account for approximately 50% of the market) and small niche companies. The sector also encompasses medium size firms.
R&D outsourcing increases flexibility for drug developers and enables the completion of drug research projects faster and cheaper than if they were undertaken internally (Masri et al., Citation2012). Furthermore, an appropriate R&D outsourcing strategy allows firms to specialise in core knowledge-intensive tasks, bringing about a more efficient allocation of resources (Hassanzadeh et al., Citation2014). R&D outsourcing also assists in reaching a global coverage as well as dealing with regional regulatory differences. Small and medium size bio-pharmaceutical companies usually lack expertise on foreign relations; hence they benefit from CROs coordinating clinical research across national boundaries and providing cross-cultural expertise (Mirowski & Van Horn, Citation2005).
Ultimately, CROs provide services to the bio-pharmaceutical industry, partly oriented to reduce costs (Huang, Citation2019). The CROs manage complex networks encompassed by drug manufacturers (sponsors), health authorities, ethics committees, investigational sites, doctors, patients and patient associations. As a result, their competitive advantage is closely connected to their capacity to coordinate, manage and act efficiently as a hub while they integrate all product development stages into a single solution for the drug manufacturers.
The issue of efficiency is therefore at the core of the business model of CROs. Despite its importance, however, we lack empirical evidence on this topic; to date, the CRO industry has been analysed in the literature from the perspective of its interaction with bio-pharmaceutical firms or through qualitative, partial approximations, using mostly survey data. This study intends to contribute to fill this gap in the literature through the exploration of economic and financial micro-data from a sample of CROs.
In particular, the goals of this study are the following: first, to estimate efficiency scores for a sample of CROs over 2012–2020 by means of DEA, in order to characterise the behaviour of the industry and identify the best performers. Second, since we compute efficiency scores for each company and year over 2012–2020, the study aims to look at the recent dynamics of the sector over time and the association between company size and efficiency. Third, this article intends to explore the robustness of the results to alternative variables and estimation techniques (baseline DEA versus bootstrap estimation). We lack other comparable empirical analyses of CRO efficiency which could be used as a benchmark. Hence we want to show that our results are relatively robust and that they carry over under changes in the specifications.
Our main results show that the average efficiency of CROs over 2012–2020 is 0.665, increasing over time. This figure is remarkably robust to different models and computation procedures. Our findings further suggest that efficiency is high in very big firms (in relation to turnover), pointing to the existence of increasing returns to scale, and in very small companies, suggesting niche advantages.
To the best of our knowledge, there are no published articles providing quantitative studies about the efficiency in the CRO industry yet. Therefore, one of the contributions of this article is to provide a first systematic analysis of the performance of efficiency for CROs over 2012–2020. Second, we explore the robustness of these results by comparing outcomes obtained with alternative techniques and models, concluding that the results carry over under different specifications and tools. In particular, our efficiency estimations seem to be consistent. Third, the study contributes to the scarce literature on the economic and managerial features of CROs, providing interesting insights which shed some light over the recent performance of the industry and suggest further consolidation of the sector for the future.
The results discussed here may be of interest for CRO managers, customers, investors, analysts, academics and policymakers, as well as other stakeholders. They can assist CRO managers to understand the position of their firms in the industry, have deeper knowledge of their rivals and make better decisions concerning investment and disinvestment strategies, which are especially crucial in a scenario of industry consolidation. This study’s findings may assist bio-pharmaceutical firms as well in their choice of the most appropriate CRO for their drug development projects, the preferred formal vehicle for their association (contractual versus alliance) and the supervision of the joint work between the sponsor and the CRO, as advised by Piachaud (Citation2005).
Investors and analysts may employ our results as useful information in the assessment of CRO share prices and in the detection of opportunities in the primary and secondary markets of financial assets in the industry. This article may additionally be of service for academics and policymakers since a deeper understanding of CROs enhances the analysis, forecasting and regulatory work in the bio-pharmaceutical industry and other sectors with comparable dynamics.
The structure of this article is as follows: Section 2 discusses the related literature; Section 3 comments on our data and methodology; Section 4 summarises our main results and Section 5 concludes.
2. Literature review
This section provides the theoretical framework and context for this study by discussing the related literature. To clarify our exposition we classify the literature in three categories.
R&D outsourcing and the origins of the CRO industry
First, there are articles referring to CROs which approach the topic from the point of view of their interactions with bio-pharmaceuticals. This is the case of a strand of the literature analysing the recent difficulties of the pharmaceutical industry and the related process of R&D outsourcing, phenomena which are now relatively well understood. These contributions do not carry out a systematic exploration of CROs, but nonetheless provide valuable insights about the purpose, origin and early trends of the CRO industry.
According to this literature, the birth of the CROs in the 1980s is associated to demand and supply factors. In other words, the CROs emerged because of an increase in the demand for clinical trials which these organisations were able to cover effectively.
The decline in productivity of pharmaceutical research from the last part of the 20th century helps explain this growth (Lee, Citation1998; Masri et al., Citation2012; Scannell et al., Citation2012).Footnote1 The drop in productivity, together with the increased competition and consolidation of the pharmaceutical industry, eroded profit margins and induced the companies to cut costs, downsize and focus on core competences in order to survive, outsourcing part of the research process and in particular clinical trials (Masri et al., Citation2012; Mirowski & Van Horn, Citation2005).
Another factor stimulating the demand of clinical trials was the population ageing and the high prevalence of chronic diseases, which made patients more prone to clinical trials as a way to access promising drugs (Masri et al., Citation2012). The molecular biology revolution, which made it increasingly difficult to master new advancements, especially for mid-size and small pharmaceuticals, contributed as well to this phenomenon (Wu & He, Citation2020).Footnote2
The literature on the supply-side aspects of the emergence of CROs is sparser. An exception is Mirowsky & Van Horn (2005). According to these authors CROs enjoyed competitive advantages which facilitated their engaging with clinical trials. For example, the early adoption of technological, computing and information improvements enhanced their management of massive screening of patients.
Another competitive advantage for CROs was their international scope. The U.S. authorities accepted data on clinical trials performed outside the United States, typically cheaper and less controlled. The international reach was easier for CROs than for many bio-pharmaceutical firms with only moderate levels of activity abroad.
At the beginning, CROs offered only some services, as bio-statistics or supervision of investigational sites. CROs were thus regarded as commodity providers, offering reduced value added and a scarcely differentiated service. In the mid-1990s, some CROs diversified beyond clinical monitoring and data analysis and took on new services (Lee, Citation1998). In the 2000s a group of CROs evolved towards full-service and globalization, while others specialised in certain therapies and diseases and became niche organisations (Masri et al., Citation2012).
The CROs industry: partial analysis
There is a second group of papers dealing with specific aspects of CRO activity, segmented by country, therapeutic specialty or function. They provide scattered information about partial aspects of CROs. They are mostly descriptive and do not carry out a systematic analysis of economic and financial variables. The information they employ is usually qualitative and obtained from surveys to industry employees.
For example, the CRO activity in two important emerging markets, China and India, has been addressed in this framework. Shi et al. (Citation2014) provide an overview of the CRO industry in China and describe how CROs in this country have successfully assisted local pharmaceutical firms comply with government regulations and understand pricing rules, thus acting as catalysts for their modernisation. Xia and Gautam (Citation2015) present a list of CROs operating in China and discuss their main clusters and partnership models.
Drabu et al. (Citation2010) describe the industry in India, a country attractive for global CRO because of its genetically diverse population, sound IT technology and government support. However, Sariola et al. (Citation2015) express concern about the degree of protection of patient rights in clinical trials performed in the country by global CROs.
Chase et al. (Citation2001) discuss the results of an independent audit of German CROs, which attests to the high quality of the firms assessed, with companies complying with the standards of the association. Koch et al. (Citation2000) deal with the largest CRO in Austria, ARCS. They design a model to measure intangible assets and intellectual capital and propose indicators for different categories; they do not, however, define a common set of variables allowing for a benchmarking between CROs.
Gummerus et al. (Citation2016) observe the outsourcing of regulatory affairs through the analysis of a questionnaire provided to pharmaceuticals from five European countries. The main reasons for outsourcing are heavy workloads, expected financial benefits and needs of country-specific expertise. Lamberti et al. (Citation2018) assess the process from site identification to site activation, which usually takes 5 to 6 months. They find that CROs are 6–11 weeks faster than pharmaceuticals in all site related activities.
Hassanzadeh et al. (Citation2014) design a mathematical model to help CROs optimise their project portfolio. The decision about which projects should be undertaken or abandoned is not trivial as a result of the high levels of uncertainty of R&D activities. This study presents a theoretical tool which can help CRO become more efficient; it is, however, silent about the current levels of efficiency in the industry.
Interaction between pharmaceutical firms and CROs: New trends
Finally, there is a rapidly growing body of literature exploring new trends shaping the relationship between pharmaceutical firms and CROs and their strategic alliances. Again, they deal with the joint relationship between the partners, rather than with CROs in isolation.
According to DeCorte (Citation2020), the traditional model which is tactical, short-term oriented and with a closed price is being gradually replaced by a more strategic, collaborative pattern, which is long-term oriented and has broader objectives; in these circumstances, pharmaceuticals outsource an entire programme or a part of the product portfolio, usually under preferential price arrangements. In these new models CROs evolve from commodity service providers to key strategic partners offering integrated solutions along the whole drug discovery process (Steadman, Citation2018). The management of such alliances requires time, expertise and dedication from the sponsor’s side (Piachaud, Citation2005).
Getz and Vogel (Citation2009) analyse data surveyed from 392 pharmaceutical employees and confirm that the propensity to alliances is increasing. They document that mid-size pharmaceuticals are very keen on these arrangements while small firms still prefer transactional operations and are more reluctant to alliances (more difficult to control and hence riskier). Getz et al. (Citation2014) discuss the findings of an exploration of 43 Phase II and Phase III clinical studies from nine major pharmaceuticals and bio-technological firms. They find that sponsors employ different outsourcing models simultaneously, without any discernible pattern to assist them in their choice.
Other CROs decide to integrate upstream, undertake drug discovery activities and turn into competitors of pharmaceutical firms (Lowman et al., Citation2012).
This literature discussion suggests that there is a research gap regarding empirical analyses of samples of CROs using financial and economic data. In particular, to the best of our knowledge there are no contributions exploring the efficiency of CROs, although they could be very valuable for bio-pharmaceutical firms in their decision-making process concerning R&D strategies and for other stakeholders. First, pharmaceuticals need quantitative information to choose the ideal CRO partner in terms of efficiency. They must simultaneously determine the best partnership model to undertake, and this is especially pressing in the present scenario of growth in alliances and broad collaborations. For example, if a particular CRO is convenient for a project in terms of its therapeutic expertise but displays only moderate levels of efficiency, a transactional approach may be preferable to an alliance because the transactional model (as detailed in a contract) implies tighter supervision and control from the sponsor upon the CRO than an alliance (Piachaud, Citation2002, Citation2005; Lowman et al., Citation2012). If the CRO has a record of high efficiency, instead, an alliance may be feasible. In addition, the information about the efficiency levels of CROs assists the sponsor in managing the relationship adequately over its time horizon, something which is relevant and should not be overlooked (Piachaud, Citation2005).
Empirical assessments of efficiency are valuable as well for CROs themselves. They can be used as a managerial tool to improve their own levels of productivity; the information about the efficiency of rivals can also help in the design of investment strategies, mergers and acquisitions.
In our view, these considerations suggest that an empirical analysis of CRO efficiency may be interesting and useful and therefore motivates our investigation.
3. Methodology and data
3.1. Model
DEA works with microeconomic data on inputs and outputs from a set of decision-making units (DMUs), which are typically firms.
DEA designs and solves an optimisation problem subject to a number of constraints by means of linear programming. This optimisation problem is the search for the maximum output attainable given a fixed quantity of inputs (output orientation) or, alternatively, the search for the minimum amount of inputs necessary to produce a particular level of output (input orientation).
In practice, DEA searches for the most efficient DMUs in a set, which register an efficiency of 1 by definition. Next it computes the distance of the rest of DMUs to the most efficient units and translates this information to efficiency scores.
More formally, suppose there are N DMUs indexed by j, (j = 1, …, N), and a technology, T, which transforms inputs into outputs:
where xj is a vector of m inputs and yj is a vector of s outputs for DMU j,
The feasible set in this problem can be defined as the production possibility frontier P(x) or, alternatively, the input requirement set L(y):
For the more general technology:
where
corresponds to the constant returns of scale case, whereas
represents variable returns to scale.
For the input-oriented DEA, the goal is to find
where q is the efficiency score for the DMU j.
3.2. Data
We work with detailed micro-data for global CROs from 2012 to 2020. The data have been gathered from the Orbis database (Van Dijk, Citation2022), which has rich economic and financial information disaggregated at the firm level, organised and standardised to allow for clear comparisons among firms across borders. The ultimate sources for this information are the balance sheets and income statements officially disclosed by companies to comply with legal and tax regulations; the database can therefore be regarded as reliable. Gascón et al. (Citation2017) and Rahman et al. (Citation2020) employ analogous databases.
The bulk of the companies in our sample belongs to the NACE codes 7112 (Engineering activities and related technical consultancy), 7120 (Technical testing and analysis), 7211 (R&D in biotechnology) and 7219 (Other research and experimental development in natural sciences and engineering).
Global CROs usually establish affiliates per country. We include the holding and the consolidated company in the sample when both are available. If not, we consider the affiliate company alone.
In accord with other contributions, we proxy outputs with turnover and net income for each company and year in dollars.Footnote3 Turnover equals operational revenue (sales/income). Net income is profit (loss) after tax. The proxy for the input capital is total assets (current assets plus fixed assets) in dollars. The input labour can be measured in units (number of employees) or in monetary value (total cost of employees); we employ both measures and therefore capture labour with number of employees and total cost of employees in dollars. The data for this last variable, though, is available for a smaller subset of companies.
We have chosen to work with these variables to ensure the homogeneity and comparability of data from firms operating in different countries, as it is the case in our sample. An alternative could have been the employ of more specific indicators for CROs, related, for example, to R&D activity (along the lines of the proposal of Koch et al., Citation2000). This kind of information, though, may be very difficult to gather. Even if the information is available in websites, it is not always straightforward to determine if it corresponds to an entire company or to one of its units or divisions, thus compromising its comparability. In the trade-off between homogeneity and specificity, we have chosen homogeneity for the investigation discussed in this article, in the understanding that it is a preliminary exploration and that further analysis may employ more sophisticated variables.
In any event, in our view the variables employed accurately capture the nature of the production process as the allocation of an accumulable (capital) and a non-accumulable factor (labour) to elaborate and sell a good or service; in the absence of other variables, they may be regarded as a reasonable approximation to the production function of CROs.
Data limitations restrict our analysis only to the economic aspects of sustainability and prevent the consideration of other, important facets, as the social and ecological dimensions. Examples of key social aspects in this industry are the protection of patient rights, ethical and safety standards in clinical trials and regulatory compliance. Instances of specific ecological issues are the use of eco-friendly materials and packages as well as the sound management of residuals, wastage or pollution (Ding, Citation2018; Kümmerer, Citation2010).
One way to circumvent this shortcoming concerning sustainability dimensions is to define variables capturing the aforementioned facets and to include them (either as desirable or undesirable outputs, depending on the metric) in the DEA estimation, along the lines of Korhonen and Luptacik (Citation2004).Footnote4 The result may be a more global measure of efficiency, encompassing as well social and ecological dimensions. Another possibility inspired in Sueyoshi and Goto (Citation2012) is to distinguish between economic and sustainable efficiency (where the latter corresponds to a broader concept of efficiency which takes into account social and environmental aspects) and compute both indicators, paying special attention to the sign of the correlation.Footnote5
and display summary statistics and trends over time for selected variables. The variables have been deflated with the Consumer Index Price for G20 to ease comparisons (OECD, Citation2022). Average figures increase over time, pointing to an expansion of the activity in the industry, but the performance of the variables is not uniform. Average real turnover increases by 76% between 2012 and 2020. The number of employees increases by 114% over the period. The figures for real assets and real income are 159% and 186%, respectively. All magnitudes have grown over time; the growth of the inputs has been faster than the growth in real turnover. Notwithstanding this asymmetry, real income has increased substantially, pointing to a dynamic performance of the industry.
Figure 1. Evolution of selected variables over time (2012–2020).
Notes: Averages across DMUs. Average real turnover, assets and income in thousand dollars, deflated with the Consumer Index Price for G20. Source: own elaboration.
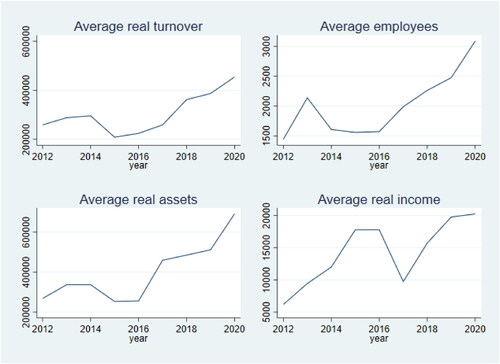
Table 1. Summary statistics, selected variables (2012–2020).
4. Results
4.1. Average efficiency: levels and trends
The basic DEA framework does not explicitly consider the potential presence of measurement errors or sample bias in the data. Typically, this approach regards as unknown the efficient frontier and the underlying data generating process (DGP) of efficiency scores. In a series of influential studies, Simar and Wilson (Citation1998, Citation2000, Citation2007) and Daraio and Simar (Citation2007) develop a strategy to handle these issues. They design several bootstrapping tools which, by means of many repetitions, provide approximations to the unknown distribution of efficiency and enable the computation of the bias-corrected efficiency scores. In addition, their methodology provides standard errors and confidence intervals of the efficiency scores at a specific significance level 1-α.
We employ both the basic DEA framework with no bootstrapping and the Simar–Wilson bootstrap approach to compute and compare radial efficiency scores for the firms in our sample. This comparison can be used as a first approximation to the robustness of the results. We plan to explore the stability of the efficiency score with other techniques, such as the sensitivity analysis discussed in Boljunčić (Citation2006), in further research.
We obtain efficiency scores for each firm and year in our sample over 2012–2020. We work in a variable returns to scale, input orientation framework. The assumption of variable returns to scale is more flexible than the alternative, constant return to scale. Furthermore, since the CRO industry has an important technological component, the hypothesis of variable returns to scale seems appropriate. The input orientation approach is, in our view, closer to the firms’ reality than output orientation.Footnote6 The number of bootstraps replications in the general case is 200. α is 0.05.
As a further check of the stability of the results, we design and estimate five models under alternative specifications (). In Model 1, the baseline, the output is turnover and the inputs are number of employees and total assets, proxying for labour and capital, respectively. Model 2 works with the same inputs and adds an additional output, net income, to total revenue. Model 3 replaces the units (number of employees) measure for labour with the monetary measure. As a result, Model 3 considers total cost of employees and fixed assets as inputs and turnover as output. Model 4 encompasses total employee costs and total assets as inputs and turnover and net income as outputs. Finally, Model 5 reproduces Model 4 with 1,000 bootstrap replications.
Table 2. Computation of efficiency, inputs and outputs.
We are constrained by the availability of the data in the design of these models. For example, it would have been interesting to capture the company R&D, as discussed above, but we have not found data on the usual proxies of the R&D, patents or R&D expenditure, for CROs.
Model 1 and 3 consider one input, whereas Model 2, Model 4 and Model 5 consider two outputs each. Furthermore, Models 3–5 are estimated with less observations than models 1 and 2. The question about the validity of the estimators in this context and in particular their consistency arises.
It is well known that the consistency of the DEA estimators is not warranted when the number of inputs and/or outputs increases. Traditionally, researchers have suggested different alternatives to determine sample sizes in the multi-input/multi-output cases, but more as ad-hoc rules of thumb rather than compelling theoretical reasons (Wilson, Citation2018).
Kneip et al. (Citation1998) characterise the consistency of the DEA estimator in the general multi-input/multi-output cases. Working on these results, Wilson (Citation2018) proposes a diagnostic test to explore the adequacy of sample sizes in multi-dimensional settings. Falavigna and Ippoliti (Citation2021) apply the tool in their DEA analysis of the Italian judicial system. The gist of the test is to obtain an approximation to this issue by computing the effective parametric sample size of a particular problem. This effective sample size is the sample size that would be equivalent in a well-known parametric model as OLS.
Let n be sample size, p number of inputs and q number of outputs; the effective parametric sample size m in the DEA case is
Where
And is the integer closest to
details the effective parametric sample size for each model. For Model 2 the effective parametric sample size is 81, meaning that Model 2 yields a non-parametric estimator with the same accuracy as a parametric OLS with 81 observations. Model 4 and 5, in turn, are tantamount to parametric OLS with 64 observations. Since OLS estimators computed with these sample sizes are consistent, it follows that the sample sizes employed are big enough for the number of inputs and outputs of each model and that it appears reasonable to consider the DEA estimators as consistent.
We compute four estimators of efficiency for each model: the basic estimator without bootstrapping, the bootstrap estimator
and the upper and lower bounds of its 95% confidence Interval,
and
respectively. Therefore we get a total number of 20 estimators of efficiency.
summarises some descriptive statistics of the efficiency estimators from Models 1–5. The average bootstrap efficiency for all firms over 2012–2020 in the baseline Model 1 is 0.665. This means that a better reallocation of resources would enable firms to produce the same amount of output with 33.5% less inputs, on average. In other words, firms should reduce their input consumption of 33.5% on average to reach the efficient frontier and mimic the production conditions of the best performers in the sample. The median of the efficiency estimator is slightly higher than the mean, 0.732.
Table 3. Efficiency scores, descriptive statistics.
The mean of the basic DEA model, 0.783, is larger than the mean of the bootstrap estimator. This is consistent with the claim that the basic DEA model introduces some upward bias in the efficiency scores (Simar & Wilson, Citation1998). The standard deviation of the bootstrap estimator is below the standard deviation of the basic DEA estimator, which is reasonable since the bootstrap technique smooths the data through repeated sampling and gives more weight to the non-extreme values.
The means for the lower and higher confidence intervals are 0.568 and 0.771 respectively. The sixth column of informs about the maximum values reached by the efficiency scores in the sample. The basic DEA model assigns an efficiency score of 1 to the DMUs on the frontier, this is why the maximum for this estimator is 1. This is not the case for the bootstrap estimator, though. In the bootstrap efficiency framework some DMUs may theoretically approach an efficiency score of 1, but this occurs with 0 probability; it is no surprise, then, that the highest level of bootstrap efficiency is 0.887.
The second panel of displays the descriptive statistics for Model 2, which encompasses two outputs, turnover and net income. The inputs are the same as in Model 1, number of employees and total assets. The mean bootstrap efficiency is 0.686, which is slightly above but very close to that of Model 1. Now the best performer attains an efficiency score of 0.907. Model 3 (third panel) replaces the number of employees with total labour cost to proxy for labour; the proxy for capital is the same as in Models 1–2, total assets. Only one output, turnover, is now considered. The mean bootstrap efficiency score decreases somehow to 0.624.
Model 4 (fourth panel) includes total labour cost and total assets as inputs and turnover and net income as outputs. The mean bootstrap efficiency is 0.637 for this model. Model 5 is the same as Model 4, but with 1,000 bootstrap replications. When comparing Models 4 and 5 we see that the descriptive statistics are almost identical in both cases, only varying by the third decimal occasionally. Therefore, the gain from performing 1,000 bootstrap replications instead of 200 is almost inexistent for this sample, while the cost in computer time is non-negligible.
displays the correlation coefficients between and within estimators. Panel A shows the correlation coefficients between the mean bootstrap efficiencies in the five models. The correlation between the estimators from Models 1 and 2 (the baseline model and the specification with turnover and net income as output) is almost 0.9. However, the correlation between Models 1 and 3 (the baseline and the specification with total employee costs proxying for labour) is smaller, 0.726. The correlation for Models 1 and 4 is 0.709. Models 4 and 5, where the only difference is the number of repetitions, exhibit a correlation of 0.999.
Table 4. Efficiency estimators, correlations.
Table
Panel B in details the correlations between the four types of efficiency estimators computed for Model 1 (correlations for Models 2–5 are available upon request). The correlations within Model 1 estimators are quite high, larger than 0.94 in all cases. The correlation between the efficiency scores obtained with and without the bootstrap is at least 0.98 in all cases, slightly above this figure for the upper bound confidence interval (0.999) and slightly below for the lower bound (0.94–0.95). This suggests that the bias induced by the basic DEA estimator is moderate.
In summary, our findings suggest that the bootstrap efficiency in the sample is 0.665 when averaged over the firms and over time. It is slightly lower if labour is proxied by employee cost, and slightly higher if net income is added as an output. According to our estimates, better reallocation could potentially reduce the inputs for the companies in our sample between 31.4% and 35.8%. Since the main messages from the baseline Model 1 carry over to the rest, the results are rather robust to alternative specifications of inputs and outputs.
These results are not very far from those obtained in a similar exercise for a sample of CROs operating in Europe (Díaz & Sanchez-Robles, Citation2021). The average efficiency in that case in the basic DEA model under the Model 1 specification was 0.716. Now it is 0.783. This is reasonable since the sample in this article includes CROs from the U.S., whose efficiency is slightly above that of the European firms. The medians, anyhow, are quite close: 0.738 for the European firms and 0.732 for the more general sample.
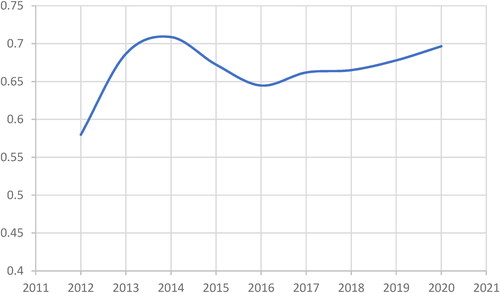
displays the evolution over time of the average (over firms) bootstrap efficiency computed according to Model 1. Mean efficiency exhibits an increasing profile and grows by 20% between the beginning and end of the period. It peaks in 2014 and decreases until 2016, when it recovers and rises again.
Figure 2. Average bootstrap efficiency over time, Model 1 (2012–2020).
Source: own elaboration.
4.2. Best performers
This empirical exercise allows us to characterise the best performers in terms of efficiency. shows the descriptive statistics of the bootstrap efficiency scores of the best performing companies according to Model 1. The rankings according to Models 2–5 are very similar. The best performers are defined as those with average bootstrap efficiency equal to or larger than 0.75. The Appendix shows descriptive statistics for the efficiency scores of all DMUs in the sample.
Table 5. Average efficiency scores of best performers, Model 1 (2012–2020).
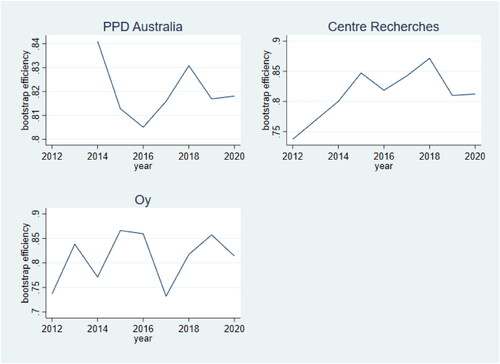
The Top 3 performing firms are PPD Australia, Centre Recherches Biologiques and Oy Medfiles, with average bootstrap efficiencies of 0.82, 0.817 and 0.81, respectively. represents the evolution over time of the bootstrap efficiency for the three companies. The three companies, and in particular PPD Australia, display remarkable stability in terms of efficiency, as shown by their small standard deviation over the period, and register very high efficiency scores in every year. The efficiency of Centre Recherches Biologiques and Oy grows over the period.
Figure 3. Efficiency over time of the best performers.
Note: bootstrap efficiency, computed according to Model 1. Source: own elaboration.
Efficiency displays a remarkable degree of persistence over time, as indicates. The correlation between efficiency in t and efficiency in t-1 is 0.69, significant at 99%.
Figure 4. Persistence of efficiency.
Note: Efficiency computed according to Model 1. Source: own elaboration.
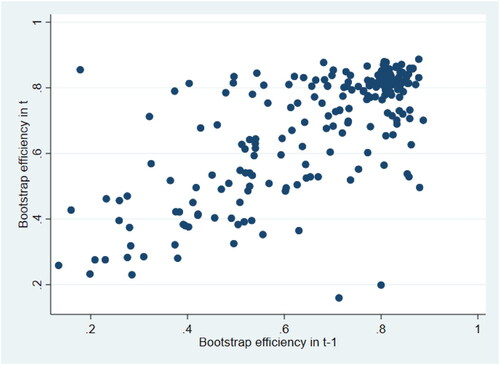
This fact suggests that efficiency may be associated to structural or fundamental features of CROs, such as size. In order to test this hypothesis, we have divided the sample in four categories of size, very big, big, small and very small, according to their level of turnover. The thresholds for these categories are determined by the 75th, 50th and 25th percentiles of turnover. summarises the distribution of the bootstrap efficiency (Model 1) by size category. The last column provides information about the Krishnamoorthy and Yu (Citation2004) test of equality of means for each category and the rest of the sample, where the null hypothesis is the equality of means between the two groups.
Table 6. Mean efficiency by size.
The average efficiency for very big and very small firms is above the global mean. The difference is almost six points for very small firms, and the means test rejects the null hypothesis of equality of means for these companies. The gap between the very big firms and the rest is smaller, though, and in this case the hypothesis of equality of means cannot be rejected at conventional levels. The big and small firms, instead, exhibit efficiency levels below the global mean, and in both cases the means test is significant. As suggests, small and very small firms belong to more homogeneous categories, according to their smaller standard deviation of efficiency, than very big and big companies.
While this evidence is still tentative and preliminary, and will be explored in further research, conveys some interesting information. The good performance in terms of efficiency of the very big firms suggests the existence of increasing return to scale in a particular domain of the production function. These increasing returns may be related to two main reasons. First, size allows large companies to optimise their investments in technology and other state-of-the-art infrastructure (for data gathering and data management, for example) since they can distribute the associated costs among a higher number of projects, which reduces the average costs.
Second, it is a common practice for drug developers to establish long term relationships with one or several large CROs (Gummerus et al., Citation2016). This reduces the transaction and search costs for both partners and facilitates accommodation to each other. In particular, it significantly reduces the marketing and commercial costs for CROs, which improves their performance and efficiency. These agreements are usually more common in very big CROs because of their reputation and solvency considerations. The medium size companies, however, do not profit from these advantages.
also suggests the potential existence of competitive advantages associated to specific niches of activity and high levels of specialisation exploited by the very small firms.
5. Concluding remarks
This article provides some preliminary research about efficiency in the CRO industry. By means of DEA, this study empirically explores the level, time profile and basic features of efficiency in a sample consisting of CROs over 2012–2020. We summarise our main findings as follows:
The CRO industry features an average bootstrap efficiency of 0.665, robust to different specifications. The best performing firms in the sample are PPD Australia, Centre Recherches Biologiques and Oy Medfiles, with average efficiencies of 0.82, 0.817 and 0.81 respectively. Almost one quarter of the companies in the sample register consistent high levels of efficiency, above 0.75. This implies that there is a relevant group of CROs that are very close to the frontier of best practices.
Efficiency displays an increasing trend over 2012–2020.
The efficiency scores for the firms in our sample display persistence over time, as shown by a high level of correlation between efficiency in t and in t + 1. This suggests that efficiency is related to structural factors of the company as opposed to transitory aspects.
Our investigation offers preliminary evidence suggesting an association between efficiency and size of the firm. Very large firms exhibit average levels of efficiency above the sample mean, which suggests the presence of increasing return to scale in the industry, probably associated to the superior capacity of larger firms to adopt state-of-the-art technology in the field of information gathering and analysis, as well as to engage in long term commercial associations with partners. In turn, the presence of scale economies suggests that more mergers and acquisitions are feasible in the future, as companies try to profit from the increasing returns to scale in production. Very small firms also outperform the rest in terms of efficiency, suggesting the existence of competitive advantages linked to niches.
These results are, in our view, novel and relevant as there are no previous articles providing empirical estimations of efficiency for a sample of CROs, to the better of our knowledge.
Our findings are in accord with the insights and qualitative evidence provided by the literature on the bio-pharmaceutical industry, which depicts the CRO industry as innovative, expanding and capable of adapting to new scenarios and challenges.
Our results have useful implications for CRO managers and stakeholders. The analysis of the efficiency scores discussed in this article may help CRO managers improve their input allocations along the value chain, know their rivals more thoroughly, make more informed decisions about their investment and disinvestment strategies and evaluate opportunities of mergers and acquisitions with more quantitative data.
The pharmaceutical companies may employ our findings to help choose the more convenient CRO for their projects and articulate the relationship through the appropriate agreement (contract or alliance). In particular, transactional approaches are preferable to broad collaborations if the CRO does not exhibit a consistent record of high efficiency. Moreover, data about efficiency may be useful as well for monitoring and supervising joint projects with CROs (Piachaud, Citation2005).
In our view, the results of this article may also be informative for academics and policymakers, not only because they enhance our understanding of key players in the bio-pharmaceutical industry, but also because they may be related to other industries in the economy which display resembling patterns (in particular those with long and complex processes of R&D).
Although the results under different models tend to converge in our analysis, in future research we shall carry out a sensitivity analysis along the lines of Boljunčić (Citation2006), exploring the region of the efficiency of the best performers.
The main limitations of this article are related to the relatively reduced number of inputs and outputs employed, which can affect the reliability and usefulness of results. In particular, we only consider in this article the economic pillar of sustainability but do not work with variables related to its environmental and social dimensions, as a result of the lack of data on these issues. Further research may tackle this shortcoming by considering aspects like the protection of patients’ rights, compliance with ethical and safety standards and eco-friendly practices. Another possible avenue for future research is the inclusion of R&D indicators in the estimation of efficiency.
Disclosure statement
No conflict of interest has been reported by the authors.
Notes
1 Several factors explain this dip. First, the presence in the market of many high-quality drugs hindered the design of new, superior, remedies. Moreover, regulatory agencies became more and more demanding and required increasing amounts of trials and documentation for drug approval (Scannell et al., Citation2012).
2 Examples are combinatorial chemistry, computational drug design or DNA sequencing.
3 DEA estimates efficiency scores relative to units in the frontier, i.e., as ratios or proportions. Therefore it is not necessary to deflate nominal variables.
4 For example, protection of patient rights can be considered a desirable output while a measure of residuals produced in a year is an undesirable output.
5 A positive sign indicates that both types of efficiency enhance each other, while a negative association implies the existence of a trade-off. See Sanchez-Robles et al. (Citation2022) for a discussion.
6 According to our experience, strategies intending to increase efficiency in firms usually explore ways to reduce costs, rather than to expand output.
References
- Boljunčić, V. (2006). Sensitivity analysis of an efficient DMU in DEA model with variable returns to scale (VRS). Journal of Productivity Analysis, 25(1–2), 173–192. https://doi.org/10.1007/s11123-006-7139-5
- Chase, D., Gierend, M., Letzel, H., & Ludwig, S. (2001). System audit of contract research organizations in Germany. International Journal of Pharmaceutical Medicine, 15(4), 191–193.
- Daraio, C., & Simar, L. (2007). Conditional nonparametric frontier models for convex and nonconvex technologies: A unifying approach. Journal of Productivity Analysis, 28(1–2), 13–32. https://doi.org/10.1007/s11123-007-0049-3
- DeCorte, B. L. (2020). Evolving outsourcing landscape in pharma R&D: Different collaborative models and factors to consider when choosing a contract research organization: Mini perspective. Journal of Medicinal Chemistry, 63(20), 11362–11367. https://doi.org/10.1021/acs.jmedchem.0c00176
- Ding, B. (2018). Pharma Industry 4.0: Literature review and research opportunities in sustainable pharmaceutical supply chains. Process Safety and Environmental Protection, 119, 115–130. https://doi.org/10.1016/j.psep.2018.06.031
- Drabu, S., Gupta, A., & Bhadauria, A. (2010). Emerging trends in contract research industry in India. Contemporary Clinical Trials, 31(5), 419–422. https://doi.org/10.1016/j.cct.2010.06.008
- Díaz, R. F., & Sanchez-Robles, B. (2021). Efficiency in the CRO industry, 2010–2019. Available at SSRN: https://ssrn.com/abstract=3839735
- Falavigna, G., & Ippoliti, R. (2021). Reform policy to increase the judicial efficiency in Italy: The opportunity offered by EU post-COVID funds. Journal of Policy Modeling, 43(5), 923–943. https://doi.org/10.1016/j.jpolmod.2021.06.001
- Gascón, F., Lozano, J., Ponte, B., & de la Fuente, D. (2017). Measuring the efficiency of large pharmaceutical companies: An industry analysis. The European Journal of Health Economics: HEPAC: Health Economics in Prevention and Care, 18(5), 587–608. https://doi.org/10.1007/s10198-016-0812-3
- Getz, K. A., & Vogel, J. R. (2009). Successful outsourcing: Tracking global CRO usage. Applied Clinical Trials, 18(6), 42.
- Getz, K. A., Lamberti, M. J., & Kaitin, K. I. (2014). Taking the pulse of strategic outsourcing relationships. Clinical Therapeutics, 36(10), 1349–1355. https://doi.org/10.1016/j.clinthera.2014.09.008
- Gummerus, A., Airaksinen, M., Bengtström, M., & Juppo, A. (2016). Outsourcing of regulatory affairs tasks in pharmaceutical companies—Why and what? Journal of Pharmaceutical Innovation, 11(1), 46–52. https://doi.org/10.1007/s12247-015-9235-4
- Hassanzadeh, F., Modarres, M., Nemati, H. R., & Amoako-Gyampah, K. (2014). A robust R&D project portfolio optimization model for pharmaceutical contract research organizations. International Journal of Production Economics, 158, 18–27. https://doi.org/10.1016/j.ijpe.2014.07.001
- Huang, J. (2019). Contract research organizations are seeking transformation in the pharmaceutical value chain. ACS Medicinal Chemistry Letters, 10(5), 684–686. https://doi.org/10.1021/acsmedchemlett.9b00046
- Kneip, A., Park, B. U., & Simar, L. (1998). A note on the convergence of nonparametric DEA estimators for production efficiency scores. Econometric Theory, 14(6), 783–793. https://doi.org/10.1017/S0266466698146042
- Koch, G., Leitner, K. H., & Bornemann, M. (2000, October). Measuring and reporting intangible assets and results in a European Contract Research Organization. In Joint German-OECD Conference Benchmarking Industry-Science Relationships, pp 16–17.
- Korhonen, P. J., & Luptacik, M. (2004). Eco-efficiency analysis of power plants: An extension of data envelopment analysis. European Journal of Operational Research, 154(2), 437–446. https://doi.org/10.1016/S0377-2217(03)00180-2
- Krishnamoorthy, K., & Yu, J. (2004). Modified Nel and Van der Merwe test for the multivariate Behrens–Fisher problem. Statistics & Probability Letters, 66(2), 161–169. https://doi.org/10.1016/j.spl.2003.10.012
- Kümmerer, K. (2010). Pharmaceuticals in the environment. Annual Review of Environment and Resources, 35(1), 57–75. https://doi.org/10.1146/annurev-environ-052809-161223
- Lamberti, M. J., Wilkinson, M., Harper, B., Morgan, C., & Getz, K. (2018). Assessing study start-up practices, performance, and perceptions among sponsors and contract research organizations. Therapeutic Innovation & Regulatory Science, 52(5), 572–578. https://doi.org/10.1177/2168479017751403
- Lee, T. Y. (1998). Contract research organizations. Drug Information Journal, 32(1_suppl), 1259S–1263S. https://doi.org/10.1177/00928615980320S117
- Lowman, M., Trott, P., Hoecht, A., & Sellam, Z. (2012). Innovation risks of outsourcing in pharmaceutical new product development. Technovation, 32(2), 99–109. https://doi.org/10.1016/j.technovation.2011.11.004
- Masri, M. D., Ramirez, B., Popescu, C., & Reggie, E. M. (2012). Contract research organizations: An industry analysis. International Journal of Pharmaceutical and Healthcare Marketing, 6(4), 336–350. https://doi.org/10.1108/17506121211283226
- Mirowski, P., & Van Horn, R. (2005). The contract research organization and the commercialization of scientific research. Social Studies of Science, 35(4), 503–548. https://doi.org/10.1177/0306312705052103
- Piachaud, B. S. (2002). Outsourcing in the pharmaceutical manufacturing process: An examination of the CRO experience. Technovation, 22(2), 81–90. https://doi.org/10.1016/S0166-4972(01)00081-5
- Piachaud, B. (2005). Outsourcing technology. Research-Technology Management, 48(3), 40–46. https://doi.org/10.1080/08956308.2005.11657314
- OECD. (2022). https://stats.oecd.org/Index.aspx?DataSetCode=G20_PRICES.
- Rahman, M., Rodríguez-Serrano, M. Á., & Lambkin, M. (2020). Advertising efficiency and profitability: Evidence from the pharmaceutical industry. Industrial Marketing Management, 89, 619–629. https://doi.org/10.1016/j.indmarman.2019.02.001
- Sanchez-Robles, B., Herrador-Alcaide, T., & Hernández-Solís, M. (2022). Efficiency of European oil companies: An empirical analysis. Energy Efficiency, 15(8), 63. https://doi.org/10.1007/s12053-022-10069-2
- Sariola, S., Ravindran, D., Kumar, A., & Jeffery, R. (2015). Big-pharmaceuticalisation: Clinical trials and contract research organisations in India. Social Science & Medicine (1982), 131, 239–246. https://doi.org/10.1016/j.socscimed.2014.11.052
- Scannell, J. W., Blanckley, A., Boldon, H., & Warrington, B. (2012). Diagnosing the decline in pharmaceutical R&D efficiency. Nature Reviews Drug Discovery, 11(3), 191–200. https://doi.org/10.1038/nrd3681
- Simar, L., & Wilson, P. W. (1998). Sensitivity analysis of efficiency scores: How to bootstrap in nonparametric frontier models. Management Science, 44(1), 49–61. https://doi.org/10.1287/mnsc.44.1.49
- Simar, L., & Wilson, P. W. (2000). A general methodology for bootstrapping in non-parametric frontier models. Journal of Applied Statistics, 27(6), 779–802. https://doi.org/10.1080/02664760050081951
- Simar, L., & Wilson, P. W. (2007). Estimation and inference in two-stage, semi-parametric models of production processes. Journal of Econometrics, 136(1), 31–64. https://doi.org/10.1016/j.jeconom.2005.07.009
- Shi, Y. Z., Hu, H., & Wang, C. (2014). Contract Research Organizations (CROs) in China: Integrating Chinese research and development capabilities for global drug innovation. Globalization and Health, 10(1), 1–6. https://doi.org/10.1186/s12992-014-0078-4
- Steadman, V. A. (2018). Drug discovery: Collaborations between contract research organizations and the pharmaceutical industry. ACS Medicinal Chemistry Letters, 9(7), 581–583. https://doi.org/10.1021/acsmedchemlett.8b00236
- Sueyoshi, T., & Goto, M. (2012). Returns to scale and damages to scale under natural and managerial disposability: Strategy, efficiency and competitiveness of petroleum firms. Energy Economics, 34(3), 645–662. https://doi.org/10.1016/j.eneco.2011.07.003
- Van Dijk, B. (2022). Orbis database. Bureau van Dijk Electronic Publishing. https://www.bvdinfo.com/en-gb/.
- Wilson, P. W. (2018). Dimension reduction in nonparametric models of production. European Journal of Operational Research, 267(1), 349–367. https://doi.org/10.1016/j.ejor.2017.11.020
- Wouters, O. J., McKee, M., & Luyten, J. (2020). Estimated research and development investment needed to bring a new medicine to market, 2009–2018. JAMA, 323(9), 844–853. https://doi.org/10.1001/jama.2020.1166
- Wu, Q., & He, Q. (2020). DIY Laboratories and business innovation ecosystems: The case of pharmaceutical industry. Technological Forecasting and Social Change, 161, 120336.
- Xia, C., & Gautam, A. (2015). Biopharma CRO industry in China: Landscape and opportunities. Drug Discovery Today, 20(7), 794–798. https://doi.org/10.1016/j.drudis.2015.02.007