
 ?Mathematical formulae have been encoded as MathML and are displayed in this HTML version using MathJax in order to improve their display. Uncheck the box to turn MathJax off. This feature requires Javascript. Click on a formula to zoom.
Abstract
This study investigates the impact of fintech development on corporate investment efficiency from the dual perspectives of financial constraints and agency conflicts, based on data from Chinese A-share listed corporations and 293 cities’ fintech development levels from 2011 to 2020. The results of the study show that fintech makes corporate investments more efficient and that this beneficial impact is long-term; as fintech develops, it plays a greater role in increasing corporate investment efficiency. Based on heterogeneity research, the effect of fintech in boosting corporate investment efficiency is more pronounced in non-states, growth periods, and corporations with weaker internal and external governance. From both aspects of inefficient investment, fintech alleviates under-investment and inhibits over-investment, with a higher inhibitory effect on over-investment. Through a mechanism analysis, we found that fintech has a stronger mitigating effect on under-investment in corporations with higher financing constraints and a stronger inhibiting effect on over-investment in corporations with larger agency conflicts. The conclusions of this study provide critical information for promoting fintech adaptation to corporate needs and high-quality economic development.
1. Introduction
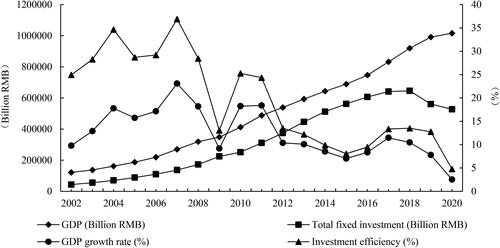
Investment is a major driver of the economy and an important method to produce value. It plays a significant role in global economic development, structural optimisation, and livelihood improvement. As shown in , investments have historically been a significant contributor to China’s economic growth. However, in recent years, China’s Gross Domestic Product (GDP) growth has slowed down and investment efficiency (newly added GDP/fixed asset investment) has been moving downward, even going below 5% in 2020. Improving the quality and effectiveness of investments has become the key to China’s economic growth in the next stage. Corporates, as micro components of the macro economy, are the driving force behind the revitalisation of the real economy. Maximising their investment efficiency with limited resources and allocating their capital to high-return initiatives are critical to their intrinsic value and overall economic and social development.
Figure 1. China’s economic growth and investment efficiency (2002–2020).
Note: The data were obtained from the China Statistical Yearbook.
Source: Authors.
The investment efficiency of corporates is expressed as the relative difference between actual and optimal investment levels. Under-investment occurs when the corporate’s actual investment spending is less than the optimal investment level; over-investment occurs when the corporate’s actual investment expenditure exceeds the optimal investment level (Jensen, Citation1986). Neither of these phenomena can help the corporate attain optimal operational efficiency, resulting in inefficient investment (Jorgenson, Citation1963; Abel, Citation1983). According to the perfect market hypothesis, corporates’ investment behaviour is solely motivated by investment opportunities and there is no inefficient investment (Modigliani & Miller, Citation1958). However, there is no ideal market and corporate investment is influenced by a mix of external financing environments (financing constraints) and internal investment behaviours (agency conflicts) (Guariglia & Yang, Citation2016). There is an academic consensus about the significant impact of finance on the efficiency of corporate investment, but there is still controversy over whether financial development can enhance the efficiency of corporate investment. On the one hand, financial development has solved financing constraints and agency conflicts while increasing corporate investment efficiency (Khan et al., Citation2017; Khan et al., Citation2018). On the other hand, while financial development has alleviated corporate under-investment, it has also increased corporate over-investment and generated efficiency losses (Naeem & Li, Citation2019).
With the widespread application of artificial intelligence, blockchain, cloud computing, big data (ABCD), and other technologies in the financial sector, fintech has developed rapidly. According to iResearch (a Chinese internet data information aggregator), China’s financial institutions were expected to invest 198.16 billion RMB in technology funding and 41.37 billion RMB in fintech funding in 2020, of which banks were expected to account for up to 70%. Some scholars have confirmed the positive influence of fintech in promoting the efficiency of corporate investment (Huang, Citation2022; Lv & Xiong, Citation2022; Zhu, Citation2019). However, whether fintech development has a positive impact on both aspects of inefficient corporate investment remains unclear. Therefore, we propose the following questions: As an innovative tool for financial development, can fintech make corporate investments more efficient? Is this a short-term boost, or is it effective in the long run? Is there heterogeneity in the impact on corporates with different attributes? Moreover, does it have a positive impact on under-investment and over-investment? What are the impact mechanisms?
During the critical period, when the global economy is facing downside risks, clarifying the relationship between fintech development and corporate investment efficiency is of great significance in boosting finance to better serve the real economy and promote economic development.
The contributions of this study are threefold. First, based on the external financing environment and internal investment behaviour of corporates, this study reveals the long-term dynamic effects of fintech on corporate investment efficiency from the dual perspectives of financing constraints and agency conflicts. It also clarifies fintech’s role in promoting corporate investment efficiency, thereby contributing to research fintech development and corporate investment efficiency. Second, this study uses Python software to construct an annual fintech development level index for 293 cities in China, which provides a useful reference for future academic studies measuring fintech development indices. Third, this study finds that the promotion effect of fintech on corporate investment efficiency varies between corporations based on their own nature and internal and external governance features, providing a policy reference for guiding the adaptation of fintech to corporate demands.
The remainder of this paper is organised as follows: Section 2 presents the research hypothesis. Section 3 presents the study’s data, methodology, and variables. Section 4 presents and discusses the results. Section 5 discusses the impact mechanism analysis. Section 6 presents conclusions, recommendations, and future research.
2. Research hypothesis
The efficiency of corporate investment is determined by both the availability of sufficient funds and efficient utilisation of funds. Corporates generally rely on external financial backing for investment due to limited internal resources. However, under traditional financial services, the information asymmetry between banks and corporations is significant, and corporates often face high financing constraints. In this case, even if good investment possibilities emerge, corporates will be forced to abandon them because of a shortage of finances, resulting in an actual investment lower than the optimal one (i.e. under-investment) (Naeem & Li, Citation2019; Wurgler, Citation2000). Most academics agree that financial constraints negatively impact corporate investment efficiency (D'Espallier et al., Citation2009; Harhoff, Citation2000; Khan et al., Citation2018; Martinez-Cillero et al., Citation2020).
According to the agency theory, agency conflict between managers (agents) and shareholders (principals) is the main cause of corporate over-investment (Mauer & Sarkar, Citation2005; Morellec & Smith, Citation2007; Pellicani & Kalatzis, Citation2019). Owing to information asymmetry, traditional financial institutions struggle to adequately identify corporate managers’ improper motives for pursuing private gains. When the private advantages from the infringement outweigh the cost of the infringement, managers are more likely to engage in relevant opportunistic behaviours for private gain, continuing to invest in projects with negative net present value after the corporation has reached the optimal investment level (i.e. over-investment) (Jensen & Meckling, Citation1976; Jensen, Citation1986; Malmendier & Tate, Citation2005; Richardson, Citation2006).
In recent years, the rapid development of fintech has provided new opportunities to alleviate corporate financing constraints and agency conflicts. Fintech has changed traditional finance’s service model (Allen et al., Citation2021; Goldstein et al., Citation2019; Lee & Shin, Citation2018; Puschmann, Citation2017) and optimised corporates’ external financing environment. Specifically, through reliance on core technologies such as ‘ABCD’, traditional financial institutions are empowered with the ability to deposit and search data. This improves the speed of loan approval (Rosavina et al., Citation2019) and reduces the cost of information search and risk identification in the loan approval process (Gomber et al., Citation2018). This is critical in addressing the information asymmetry between traditional financial institutions and corporations (Lee et al., Citation2019; Sánchez, Citation2018) and relieving corporate financing constraints (Bollaert et al., Citation2021; Sheng, Citation2021).
However, the distinctive benefits of fintech in information screening and risk management have improved traditional financial institutions’ external monitoring capabilities (Frost et al., Citation2019). In information screening, massive amounts of data can be quickly delivered and processed using technologies such as big data and cloud computing (Carlin et al., Citation2017), increasing the possibility of hidden corporate information being discovered and helping avoid the moral risk of managers chasing private interests (Zhu, Citation2019). In risk management, traditional financial institutions can build a dynamic risk warning and management system based on technologies such as blockchain and artificial intelligence to track and monitor managers’ investment behaviour in real time, which, to a certain extent, increases the cost required for managers to pursue private interests. Hence, these technologies contribute to reducing the potential motives of managers seeking private interests and agency conflicts within the corporation.
Based on the above analysis, there is reason to believe that fintech can help alleviate financing pressure on corporations (especially those with high financing constraints) and may have somewhat mitigated the under-investment caused by the financing constraints. Simultaneously, fintech may also have a governance effect on corporations (especially those with high agency conflicts) through external oversight, which may help restrain excessive corporate investment behaviour. Consequently, this study anticipates that fintech development will have a positive impact on corporate investment efficiency. Based on this, the hypotheses of this study are as follows:
Hypothesis 1: The higher the level of fintech development, the higher the efficiency of corporate investment.
Hypothesis 2: Fintech alleviates corporate under-investment and inhibits corporate over-investment.
Hypothesis 3: When financing constraints are high, the mitigating effect of fintech on corporate under-investment is more pronounced.
Hypothesis 4: When agency conflicts are high, the inhibiting effect of fintech on corporate over-investment is more pronounced.
3. Data, methodology and variables
3.1. Data
In this study, we consider companies listed in Shanghai and Shenzhen A-shares in China as the research target and match the data of listed corporations with the fintech development level index from 2011 to 2020 in 293 cities. After eliminating financial, ST (Special Treatment), PT (Particular Transfer), and related data missing from listed companies and tailing all continuous variables by less than 1% and more than 99%, the final sample of 11977 ‘corporate-year’ observations is obtained. Among these samples, the data on the fintech development levels are obtained from the number of results in the title of the web page of Baidu Advanced Search, while the rest of the data of the listed corporates and city-level data are obtained from the China Stock Market & Accounting Research and Wind databases.
3.2. Methodology
In this study, we analyse the relationship between fintech development and corporate investment efficiency, and the model set is as follows:
(1)
(1)
where
represents the investment efficiency of corporate
in year
represents the level of fintech development in year t in region m;
represents a series of control variables;
represents the year × industry fixed effects; and
represents the random error term. This study focuses on the coefficient
of
and predicts that fintech development will improve corporate investment efficiency. The reasons are as follows: First, fintech development helps lessen corporate financial pressure, which may alleviate some under-investment; second, fintech development increases the likelihood of detection of managers pursuing private interests, which may inhibit corporates’ over-investment behaviour. If
is significantly negative, fintech improves corporate investment efficiency, supporting Hypothesis 1. Here, we start with an ordinary least squares regression model. Furthermore, the instrumental variables technique is used in this study to address potential issues in the endogeneity discussion.
3.3. Variable
3.3.1. Investment efficiency
This study refers to Richardson (Citation2006) to calculate the efficiency of corporate investment, and the specific model is set as follows:
(2)
(2)
In Model (2), represents the corporate’s new investment in the current period, which is equal to ‘expenditure on the purchase and construction of fixed assets, intangible assets and other long-term assets
net cash recovered from the disposal of fixed assets, intangible assets and other long-term assets
net cash paid for the acquisition of subsidiaries and other business units
depreciation of fixed assets, depreciation of oil and gas assets, depreciation of productive biological assets’, and normalised by total assets at the beginning of the year. Here,
represents the growth rate of operating revenue in the previous period;
represents the corporate size in the previous period;
represents the gearing ratio in the previous period;
represents the cash holding level in the previous period;
represents the corporate’s age in the previous period;
represents the annual stock return in the previous period;
represents the investment level in the previous period;
represents the industry dummy variable; and
represents the annual dummy variable. By regressing Model (2), the absolute value of the obtained residuals is used to measure corporate investment efficiency (Inveff_R). The greater the value, the lower the corporate investment efficiency. In addition, the sample corporates are divided into two groups based on the magnitude of the residuals, with residuals less than 0 being the under-investment group (Underinv_R) and residuals greater than 0 being the over-investment group (Overinv_R).
3.3.2. Fintech
Based on the design idea of Cheng and Qu (Citation2020), this study constructs an index of the level of fintech development at 293 cities from 2011 to 2020 using the Baidu search engine (currently the largest search engine in China). First, based on relevant policies, reports, conferences, and literature, among other resources, we selected 26 keywords highly relevant to fintech (e.g. artificial intelligence) from four major perspectives: concept, technology, function, and service (as shown in ) and matched these keywords with 293 cities in China. Second, on the advanced search page of the Baidu search engine, we selected ‘city name year
keywords’ and only retained the results of websites with the above keywords in the title to reduce noise and avoid matching coincidental characters. Third, because of the volatility of the number of crawled results, each keyword was crawled three times, and the average value was obtained. Fourth, the average number of results for the same city, all keywords, and each year was summed to obtain the total city-level fintech search volume from 2011 to 2020. Fifth, the total search volume was added by 1 to take the logarithm. Finally, the fintech development level (Fintech) was obtained.
Table 1. Keywords related to the level of fintech.
3.3.3. Moderating variables
(1) Financing constraints. Retained earnings are the main source of financing for corporates (Asgari et al., Citation2015); the larger the retained earnings, the more dependent the corporate is on endogenous financing. Simultaneously, the financing constraints faced by corporates are closely related to their financing costs (Ryan et al., Citation2014). Therefore, this study selects the retained earnings ratio (FC1) and the ratio of interest expenses to the average value of long- and short-term liabilities (FC2) to measure corporate financing constraints, with larger values indicating higher financing constraints.
(2) Agency conflicts. The management expense ratio reflects the expenses that managers can arbitrarily decide. The higher the management expense ratio, the higher the agency cost between managers and shareholders, which indicates a greater agency conflict. Meanwhile, the total asset turnover ratio reflects the overall agency efficiency of managers; a higher total asset turnover ratio indicates higher agency efficiency, which implies less agency conflict. Therefore, this study draws on Ang et al. (Citation2000) and Singh and Davidson (Citation2003) to use corporate agency conflicts measured by the management expense ratio (AC1) and the total asset turnover ratio (AC2).
3.3.4. Control variables
This study controls for several corporate-level characteristics: corporate size (Size), expressed as the natural logarithm of the book value of the corporate’s total assets at the year-end; corporate age (Age), expressed as the natural logarithm of the year of observation minus the year of listing plus one; corporate nature (State), which takes the value of 1 if the listed corporate is a state-owned corporate and 0 otherwise; cash holdings level (Cash), expressed as the ratio of a corporate’s year-end money funds and short-term investments to total assets at the start of the year; equity balance (Top10), expressed as the percentage of shares held by the top ten shareholders at the end of the year; board size (Bsize), expressed as the natural logarithm of the total number of board members at the end of the year; and board independence (Indep), expressed as the percentage of independent directors at the end of the year. Simultaneously, since the level of fintech development is also closely related to the economic development and financial development of its region, this study controls for city-level characteristics: economic development (Gdp), expressed as the regional GDP growth rate, and financial development (Finance), expressed as the ratio of the year-end loan balances of regional financial institutions to gross domestic product.
3.4. Descriptive statistical analysis
displays the descriptive statistics of the study variables. The mean (0.0533), standard deviation (0.0882), minimum (0.0000), and maximum (1.9582) of the investment efficiencies of the sample corporates show that investment efficiency varies widely among corporates. The number of over-investment observations (4312) is lower than that of under-investment observations (7665), indicating that under-investment is more common than over-investment in the sample corporates. The mean of the over-investment sample (0.0738) is higher than the mean value of the under-investment sample (0.0418), indicating that the problem of over-investment is more serious among the sample corporates. As a result, the issue of over-investment should be the main focus; however, under-investment is also significant and needs to be addressed. Moreover, the mean value of corporate nature is 0.4088, indicating that the proportion of non-state-owned corporates among the sample corporates is higher than that of state-owned corporates.
Table 2. Descriptive statistics of variables.
4. Results
4.1. Baseline regression
reports the results of the stepwise regression of fintech and corporate investment efficiency. The coefficients of Fintech in column (1) have the same sign as expected but are insignificant, probably due to the omission of variables. Column (2) controls for year- and industry-level fixed effects based on column (1); column (3) adds the relevant control variables based on column (2); and column (4) replaces year- and industry-fixed effects with interaction terms, controlling for year- and industry-fixed effects on the basis of column (3). The coefficients of Fintech are all significantly negative at the 1% level. A significant negative link exists between fintech and corporate investment efficiency; the greater the level of fintech development, the higher the corporate investment efficiency. This validates Hypothesis 1 of this paper.
Table 3. Baseline regression results.
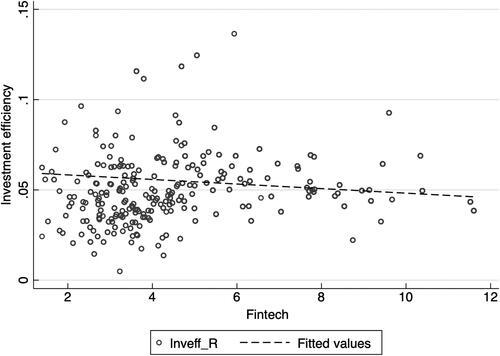
To reveal the relationship between fintech development and corporate investment efficiency more intuitively, after rigorous empirical analysis, this study further provides a scatter plot describing the relationship between the two. As can be seen in , the slope of the fitted line between fintech development and corporate investment efficiency is negative, indicating that as the level of fintech development increases, the inefficient investment of corporations subsequently decreases, that is, the investment efficiency subsequently increases, again verifying Hypothesis 1.
Figure 2. The relationship between of fintech and investment efficiency: graphical analysis.
Note: Fintech and investment efficiency in the figure are the city means of the sample corporates.
Source: Authors.
4.2. More evidence: dynamic effects
Further testing of whether fintech is only a short-term promotion effect or a long-term, sustainable, and effective means of improving corporate investment efficiency is necessary. Therefore, this paper examines whether a long-term impact of fintech exists while on improving corporate investment efficiency from the perspective of dynamic effect. In , we can see that the coefficients of the lagged 1 period Fintech (L. Fintech) to the Lagged 4 period Fintech (L4. Fintech) are all significantly negative at the 1% level, indicating that fintech can play a role in improving corporate investment efficiency over a longer period. As fintech develops, it plays a greater role in increasing corporate investment efficiency (|−0.0033| > |−0.0025| > |−0.0021| > |−0.0016|).
Table 4. Dynamic effects test.
4.3. Heterogeneity analysis
Corporations with varying characteristics confront highly variable investment conditions; thus, the effect of fintech on corporate investment efficiency may vary. Therefore, this study further discusses the positive effects of fintech on corporate investment efficiency mainly in which corporates perform better. To answer the above question, this study analyses four perspectives of property rights: nature, life cycle, internal governance, and external governance.
4.3.1. Corporate nature
In this study, the sample corporates are split into state-owned and non-state-owned corporates based on the nature of property rights, and grouped regressions are performed. As can be seen from columns (1) and (2) of , the coefficients of Fintech are negative but insignificant in the state-owned sample and significantly negative in the non-state-owned sample, indicating that the promotion effect of fintech on corporate investment efficiency is stronger in non-state-owned corporates. This could be due to Chinese state-owned corporates having a distinct edge in the credit market. In contrast, non-state-owned corporates may experience ‘size discrimination’ and ‘ownership discrimination’ throughout the financing process. More serious agency conflicts coupled with poor internal control in non-state-owned corporates may exist.
Table 5. Heterogeneity analysis.
4.3.2. Corporate life cycle
Following Dickinson (Citation2011), this study employs the cash flow approach to categorise the corporate life cycle. Given that the sample for this study is made up of public corporates, most have already passed the growth period. As a result, the start-up and growth periods are uniformly designated as growth periods, whereas the rest are non-growth periods. As shown in columns (3) and (4) of , the Fintech coefficient is significantly negative only for corporates in the growth period, indicating that fintech is more beneficial in improving the investment efficiency of corporates in the growth period. Corporates in the growth period have a higher demand for financial resources, yet they may confront more severe financial exclusion and noticeable financing constraints. However, growth-period corporates confront a multitude of potential growth opportunities; hence, the managers of such corporates and may invest impulsively in their quest to succeed. In addition, because growth period corporations are founded for a shorter time, the quality of internal control is low, and investment decisions may stray from the optimal objectives.
4.3.3. Internal corporate governance
Corporate governance is an important internal governance mechanism. Following Shleifer and Vishny (Citation1997), this study examines three aspects of internal corporate governance: shareholding structure, board characteristics, and management incentives. When a corporation is non-state and the percentage of independent directors and executive shareholdings is greater than the industry’s yearly median, it has better internal governance. Otherwise, it has weaker internal governance. As shown in columns (5) and (6) of , the Fintech coefficient is significantly negative only for corporates with weaker internal governance, showing that fintech is more beneficial in enhancing the investment efficiency of corporates with weaker internal governance. Compared to corporates with better internal governance, corporates with weaker internal governance have fewer financing capabilities, inefficient capital allocation, and more severe agency conflicts, and they may not capture investment opportunities.
4.3.4. External corporate governance
Industry competition is a critical external governance mechanism in corporates. According to Nickell (Citation1996), the higher a corporate’s ‘monopoly rent’, the more monopolistic the product market. To some extent, the profitability of the core corporate can be viewed as the ‘monopoly rent’. Therefore, we measure industry competition using the standard deviation of the industry’s main operating profit margin, with larger values suggesting a lower level of industry competition. It is then regrouped into dummy variables according to the median, and grouped into regressions. As shown in columns (7) and (8) of , the Fintech coefficient is significantly negative only in the sample with lower industry competition, showing that the promotion effect of fintech on corporate investment efficiency is larger when industry competition is lower. In a competitive industry, the risk of insolvency due to predation by other competitors is higher; therefore, corporates are under more pressure and may be more cautious in their investment decisions. Simultaneously, they may decide to improve the quality and level of information disclosure in order to obtain financing at a reduced cost.
4.4. Robustness test
4.4.1. Replacement of investment efficiency measurement indicators
To avoid bias in measuring investment efficiency, this paper also draws on Biddle et al. (Citation2009) and Chen et al. (Citation2011) to calculate investment efficiency and sets up Models (3) and (4) to calculate the investment efficiency of corporates.
(3)
(3)
(4)
(4)
The definitions of in Models (3) and (4) are the same as those in Model (1), where
is a dummy variable that takes the value of 1 when the growth rate of operating income is less than 0; otherwise, it takes 0. After excluding samples with less than 20 observations per industry per year, Models (3) and (4) are regressed by year and industry, and the absolute value of the residuals is used as a measure of corporate investment efficiency (Inveff_B, Inveff_C). Then, we regress Model (1) again, and the results are shown in columns (1) and (2) of .
Table 6. Replacement investment efficiency, fintech and remove special samples.
4.4.2. Replacement of fintech measurement indicators
Considering the possibility of measurement errors in the construction of fintech indicators, this study refers to Sheng (Citation2021) and uses the index_aggregate (FintechI) and usage_depth (FintechU) of the China Digital Inclusive Finance Index, compiled by the Institute of Digital Finance at Peking University, to measure the level of fintech development. We then regress Model (1) again, and the results are shown in columns (3) and (4) of .
4.4.3. Removal of special samples
Due to the rapid development of fintech in municipalities directly under the Central Government, there are greater economic peculiarities. Therefore, such samples are removed from the study, and Model (1) is regressed again. Furthermore, the ‘stock market crash’ in 2015, a financial event shock that may affect the investment behaviour of corporates, is considered. Therefore, this study removes the sample of corporates in 2015 and regresses Model (1) again. The regression results are shown in columns (5) and (6) of .
After a series of robustness tests, the coefficient of Fintech is still significantly negative, indicating that the conclusions of this paper still hold.
4.5. Endogenous discussion
To solve the endogeneity issue caused by reverse causality, this study adopts the instrumental variables approach for the estimation. Based on the ideas of Chong et al. (Citation2013), this study selects the level of fintech development in three additional cities in the province where the corporation is located with the GDP closest to its place of incorporation as an instrumental variable for Fintech. On the one hand, the financial sector structure of cities in provinces with similar GDP is relatively similar, as is the level of fintech development, satisfying the correlation. On the other hand, the level of fintech development in cities with similar GDP within the province can hardly directly influence the investment behaviour of corporates within the target city, which satisfies exogeneity. Since the municipality directly under the Central Government does not belong to any province, the instrumental variable of Fintech of the municipality directly under the Central Government is its fintech development level, and the sample of the municipality directly under the Central Government is also excluded from this study. The regression results are shown in columns (1) and (2) of , which verify the robustness of the study findings. It is important to note that the Kleibergen-Paap rk LM statistic p-values are all 0.0000, rejecting the null hypotheses of non-identifiability. The Kleibergen-Paap rk Wald F statistic is significantly larger than the Stock-Yogo weak ID test critical values (10% maximal IV size), indicating that there is no weak instrumental variable problem. Furthermore, the p-values of the Hansen J statistic are all greater than 0.1, indicating that all instrumental variables are exogenous. In conclusion, the instrumental variables selected in this study are reasonable.
Table 7. Instrumental variable method.
5. Further and mechanism analysis
5.1. Further analysis
According to the previous theoretical analysis, corporations’ investment efficiency is influenced by both under-investment and over-investment. We divide the sample corporations into two groups to further explore the impact of fintech on under-investment and over-investment; the regression results are shown in . In the under-investment sample, the coefficient of Fintech is significantly negative at the 5% level, and in the over-investment sample, the coefficient of Fintech is significantly negative at the 1% level, indicating that fintech both alleviates under-investment and inhibits over-investment, which verifies Hypothesis 2. According to the coefficient difference test, the difference between the predicted coefficients of the two by fintech is significant (p = 0.0044), indicating that fintech is more favourable for inhibiting over-investment.
Table 8. Regression results of under-investment and over-investment.
5.2. Mechanism analysis
To find the intrinsic mechanisms by which fintech affects corporate investment efficiency, this study analyses both financing constraints and agency conflict. As there are essential differences in the causes of corporate under-investment and over-investment, the full and under-investment samples are specifically analysed under financing constraints, and the full and over-investment samples are specifically analysed under agency conflicts.
5.2.1. Fintech, financing constraints, and corporate under-investment
Corporate under-investment is mainly due to financing constraints. In this study, financing constraints are reorganised into dummy variables (FC1_D, FC2_D) by median size, and the group with higher financing constraints takes the value of 1; the other groups take a value of 0. In Model (1), Fintech × FC_D and FC_D are further added to test the effect of fintech on the full sample of corporate investment efficiency and the under-investment sample. As columns (1) and (3) of show, although the coefficients of Fintech are both significantly negative, the coefficients of the interaction term (Fintech × FC1_D, Fintech × FC2_D) are insignificant. This may be due to the inclusion of the over-investment sample in the full sample of investment efficiency, which affects the results of the interaction term. As can be seen from columns (2) and (4) of , the coefficients of Fintech are significantly negative, indicating that fintech effectively mitigates corporate under-investment, while the coefficients of FC1_D and FC2_D are all significantly positive, indicating that higher financing constraints exacerbate corporate under-investment. The coefficients of the interaction terms are all significantly negative, indicating that the mitigating effect of fintech on corporate under-investment is more pronounced when financing constraints are higher, validating Hypothesis 3.
Table 9. Fintech, financing constraints and corporate under-investment.
5.2.2. Fintech, agency conflict, and corporate over-investment
Corporate over-investment is mainly due to agency conflicts. In this study, agent conflicts are regrouped into dummy variables (AC1_D, AC2_D) by median size, and the group with larger agent conflicts takes the value of 1; the other groups take a value of 0. In Model (1), Fintech × AC_D and AC_D are further added to test the effect of fintech on the full sample of corporate investment efficiency and the sample of over-investment. As columns (1) and (3) of show, although the coefficients of Fintech are both significantly negative, the coefficients of the interaction terms (Fintech × AC1_D, Fintech × AC2_D) are insignificant. This may be because the full sample of investment efficiency includes a sample of under-investment, which affects the results of the interaction term. As can be seen from columns (2) and (4) of , the coefficients of Fintech are significantly negative, indicating that fintech effectively inhibits corporate over-investment, and the coefficients of AC1_D and AC2_D are all significantly positive, indicating that larger agency conflicts exacerbate corporate over-investment. The coefficients of the interaction terms are all significantly negative, indicating that the inhibitory effect of fintech on corporate over-investment is more pronounced when agency conflicts are larger, verifying Hypothesis 4.
Table 10. Fintech, agency conflict, and corporate over-investment.
6. Conclusions, recommendations, and future research
6.1. Conclusions
This study constructs a fintech development index at the 293 cities in China based on the Baidu search engine using Python software, matches it with data based on Chinese A-share listed corporates from 2011 to 2020, and examines the impact of fintech on corporate investment efficiency from the dual perspective of financing constraints and agency conflicts. First, this study reveals that fintech contributes greatly to the efficiency of corporate investment. Second, fintech can have long-term effects, and this technology will be more effective as it develops in depth. As per the heterogeneity research, the effect of fintech in boosting corporate investment efficiency is more pronounced in non-state growth-period corporates, and corporates with weaker internal and external governance. The findings of this study still hold after a series of tests such as changing variable measures, excluding specific samples, and instrumental variable methods. In terms of both aspects of inefficient investment, fintech alleviates under-investment and inhibits over-investment, with a higher inhibitory effect on over-investment. According to the mechanism analysis, financing constraint is an important influence mechanism of corporate under-investment, and the mitigating effect of fintech on corporate under-investment is more pronounced when financing constraints are strong. Meanwhile, agency conflict is an important influencing mechanism of corporate over-investment, and the inhibitory effect of fintech on corporate over-investment is more pronounced when agency conflict is high.
6.2. Policy recommendations
Based on the above findings, the following policy recommendations are proposed. First, the government should strengthen the enabling infrastructure for fintech to create a favourable environment for traditional financial institutions’ digital transformation and external financing for corporates. Considering the different mechanisms of the development of fintech for corporates with different attributes, government departments should design customised policies for corporate characteristics to adapt fintech development to corporates needs. Second, traditional financial institutions should fully understand fintech’s significance, foster digital transformation, and actively invent financial products to fulfil the diverse financial demands of corporates. Third, corporates should seize the current, new wave of technology innovation, reshaping their management models, organisational structures, and business strategies in all aspects, and improving the efficiency of their own capital allocation.
6.3. Limitations and future research prospects
This study has three limitations. First, this study’s sample only comprises Chinese corporates, and whether the conclusions obtained apply to other nations needs to be investigated further. Second, this study only considers financing restrictions and agency conflicts as perspectives; additional viewpoints can be explored in the future to supplement the inherent mechanism of fintech development influencing corporate investment efficiency. Third, changes in the external macroenvironment, particularly the COVID-19 pandemic, may impact fintech’s positive influence on corporate investment efficiency. The influence of pandemic shocks should be considered to enrich the research findings.
Disclosure statement
The authors declare no conflict of interest.
Additional information
Funding
References
- Abel, A. B. (1983). Optimal investment under uncertainty. The American Economic Review, 73(1), 228–233. https://www.jstor.org/stable/1803942
- Allen, F., Gu, X., & Jagtiani, J. (2021). A survey of fintech research and policy discussion. Review of Corporate Finance, 1, 259–339. https://doi.org/10.21799/frbp.wp.2020.21
- Ang, J. S., Cole, R. A., & Lin, J. W. (2000). Agency costs and ownership structure. The Journal of Finance, 55(1), 81–106. https://doi.org/10.1111/0022-1082.00201
- Asgari, M. R., Pour, A. A. S., Zadeh, R. A., & Pahlavan, S. (2015). The relationship between firm’s growth opportunities and firm size on changes ratio in retained earnings of listed companies in Tehran Stock Exchange. International Journal of Innovation and Applied Studies, 10(3), 923. http://www.ijias.issr-journals.org/
- Biddle, G. C., Hilary, G., & Verdi, R. S. (2009). How does financial reporting quality relate to investment efficiency? Journal of Accounting and Economics, 48(2–3), 112–131. https://doi.org/10.1016/j.jacceco.2009.09.001
- Bollaert, H., Lopez-de-Silanes, F., & Schwienbacher, A. (2021). Fintech and access to finance. Journal of Corporate Finance, 68, 101941. https://doi.org/10.1016/j.jcorpfin.2021.101941
- Carlin, B., Olafsson, A., & Pagel, M. (2017). Fintech adoption across generations: Financial fitness in the information age. National Bureau of Economic Research. Working Paper No. 23798. https://doi.org/10.3386/w23798
- Chen, F., Hope, O. K., Li, Q., & Wang, X. (2011). Financial reporting quality and investment efficiency of private firms in emerging markets. The Accounting Review, 86(4), 1255–1288. https://doi.org/10.2308/accr-10040
- Cheng, M., & Qu, Y. (2020). Does bank FinTech reduce credit risk? Evidence from China. Pacific-Basin Finance Journal, 63, 101398. https://doi.org/10.1016/j.pacfin.2020.101398
- Chong, T. T. L., Lu, L., & Ongena, S. (2013). Does banking competition alleviate or worsen credit constraints faced by small-and medium-sized enterprises? Evidence from China. Journal of Banking & Finance, 37(9), 3412–3424. https://doi.org/10.1016/j.jbankfin.2013.05.006
- D'Espallier, B., Vandemaele, S., & Peeters, L. (2009). Corporate investment and financing constraints: Analyzing firm-varying investment-cash flow sensitivities. Review of Business and Economics, 54(4), 461–488. https://ssrn.com/abstract=1373702
- Dickinson, V. (2011). Cash flow patterns as a proxy for firm life cycle. The Accounting Review, 86(6), 1969–1994. https://doi.org/10.2308/accr-10130
- Frost, J., Gambacorta, L., Huang, Y., Shin, H. S., & Zbinden, P. (2019). BigTech and the changing structure of financial intermediation. Economic Policy, 34(100), 761–799. https://doi.org/10.1093/epolic/eiaa003
- Goldstein, I., Jiang, W., & Karolyi, G. A. (2019). To FinTech and beyond. The Review of Financial Studies, 32(5), 1647–1661. https://doi.org/10.1093/rfs/hhz025
- Gomber, P., Kauffman, R. J., Parker, C., & Weber, B. W. (2018). On the fintech revolution: Interpreting the forces of innovation, disruption, and transformation in financial services. Journal of Management Information Systems, 35(1), 220–265. https://doi.org/10.1080/07421222.2018.1440766
- Guariglia, A., & Yang, J. (2016). A balancing act: Managing financial constraints and agency costs to minimize investment inefficiency in the Chinese market. Journal of Corporate Finance, 36, 111–130. https://doi.org/10.1016/j.jcorpfin.2015.10.006
- Harhoff, D. (2000). Are there financing constraints for R&D and investment in German manufacturing firms?. The economics and econometrics of innovation (pp. 399–434). Springer. https://doi.org/10.1007/978-1-4757-3194-1_16
- Huang, S. (2022). Does FinTech improve the investment efficiency of enterprises? Evidence from China’s small and medium-sized enterprises. Economic Analysis and Policy, 74, 571–586. https://doi.org/10.1016/j.eap.2022.03.014
- Jensen, M., & Meckling, W. (1976). Theory of the firm: Managerial behavior, agency costs and ownership structure. Journal of Financial Economics, 3(4), 305–360. https://doi.org/10.1016/0304-405X(76)90026-X
- Jensen, M. C. (1986). Agency costs of free cash flow, corporate finance, and takeovers. The American Economic Review, 76(2), 323–329. https://www.jstor.org/stable/1818789
- Jorgenson, D. (1963). Capital theory and investment behavior. The American Economic Review, 53(2), 247–259. https://www.jstor.org/stable/1823868
- Khan, M. K., He, Y., Akram, U., & Sarwar, S. (2017). Financing and monitoring in an emerging economy: Can investment efficiency be increased? China Economic Review, 45, 62–77. https://doi.org/10.1016/j.chieco.2017.05.012
- Khan, M. K., He, Y., Kaleem, A., Akram, U., & Hussain, Z. (2018). Remedial role of financial development in corporate investment amid financing constraints and agency costs. Journal of Business Economics and Management, 19(1), 176–191. https://doi.org/10.3846/16111699.2017.1422797
- Lee, I., & Shin, Y. J. (2018). Fintech: Ecosystem, business models, investment decisions, and challenges. Business Horizons, 61(1), 35–46. https://doi.org/10.1016/j.bushor.2017.09.003
- Lee, J., Ryu, M. H., & Lee, D. (2019). A study on the reciprocal relationship between user perception and retailer perception on platform-based mobile payment service. Journal of Retailing and Consumer Services, 48, 7–15. https://doi.org/10.1016/j.jretconser.2019.01.007
- Lv, P., & Xiong, H. (2022). Can FinTech improve corporate investment efficiency? Evidence from China. Research in International Business and Finance, 60, 101571. https://doi.org/10.1016/j.ribaf.2021.101571
- Malmendier, U., & Tate, G. (2005). CEO overconfidence and corporate investment. The Journal of Finance, 60(6), 2661–2700. https://doi.org/10.1111/j.1540-6261.2005.00813.x
- Martinez-Cillero, M., Lawless, M., O’Toole, C., & Slaymaker, R. (2020). Financial frictions and the SME investment gap: New survey evidence for Ireland. Venture Capital, 22(3), 239–259. https://doi.org/10.1080/13691066.2020.1771826
- Mauer, D. C., & Sarkar, S. (2005). Real options, agency conflicts, and optimal capital structure. Journal of Banking & Finance, 29(6), 1405–1428. https://doi.org/10.1016/j.jbankfin.2004.05.036
- Modigliani, F., & Miller, M. H. (1958). The cost of capital, corporation finance and the theory of investment. The American Economic Review, 48(3), 261–297. https://www.jstor.org/stable/1809766
- Morellec, E., & Smith, C. W. Jr (2007). Agency conflicts and risk management. Review of Finance, 11(1), 1–23. https://doi.org/10.1093/rof/rfm001
- Naeem, K., & Li, M. C. (2019). Corporate investment efficiency: The role of financial development in firms with financing constraints and agency issues in OECD non-financial firms. International Review of Financial Analysis, 62, 53–68. https://doi.org/10.1016/j.irfa.2019.01.003
- Nickell, S. J. (1996). Competition and corporate performance. Journal of Political Economy, 104(4), 724–746. https://doi.org/10.1086/262040
- Pellicani, A. D., & Kalatzis, A. E. G. (2019). Ownership structure, overinvestment and underinvestment: Evidence from Brazil. Research in International Business and Finance, 48, 475–482. https://doi.org/10.1016/j.ribaf.2018.10.007
- Puschmann, T. (2017). Fintech. Business & Information Systems Engineering, 59(1), 69–76. https://doi.org/10.1007/s12599-017-0464-6
- Richardson, S. (2006). Over-investment of free cash flow. Review of Accounting Studies, 11(2), 159–189. https://doi.org/10.1007/s11142-006-9012-1
- Rosavina, M., Rahadi, R. A., Kitri, M. L., Nuraeni, S., & Mayangsari, L. (2019). P2P lending adoption by SMEs in Indonesia. Qualitative Research in Financial Markets, 11(2), 260–279. https://doi.org/10.1108/QRFM-09-2018-0103
- Ryan, R. M., O’Toole, C. M., & McCann, F. (2014). Does bank market power affect SME financing constraints? Journal of Banking & Finance, 49, 495–505. https://doi.org/10.1016/j.jbankfin.2013.12.024
- Sánchez, J. M. (2018). The information technology revolution and the unsecured credit market. Economic Inquiry, 56(2), 914–930. https://doi.org/10.1111/ecin.12519
- Sheng, T. (2021). The effect of fintech on banks’ credit provision to SMEs: Evidence from China. Finance Research Letters, 39, 101558. https://doi.org/10.1016/j.frl.2020.101558
- Shleifer, A., & Vishny, R. W. (1997). A survey of corporate governance. The Journal of Finance, 52(2), 737–783. https://doi.org/10.1111/j.1540-6261.1997.tb04820.x
- Singh, M., & Davidson, I. (2003). Agency costs, ownership structure and corporate governance mechanisms. Journal of Banking & Finance, 27(5), 793–816. https://doi.org/10.1016/S0378-4266(01)00260-6
- Wurgler, J. (2000). Financial markets and the allocation of capital. Journal of Financial Economics, 58(1–2), 187–214. https://doi.org/10.1016/S0304-405X(00)00070-2
- Zhu, C. (2019). Big data as a governance mechanism. The Review of Financial Studies, 32(5), 2021–2061. https://doi.org/10.1093/rfs/hhy081