?Mathematical formulae have been encoded as MathML and are displayed in this HTML version using MathJax in order to improve their display. Uncheck the box to turn MathJax off. This feature requires Javascript. Click on a formula to zoom.
Abstract
In this paper, we investigate the possible contagion effects of the COVID-19 pandemic on twenty-four emerging Islamic equity markets. To test for contagion, we use statistical tests based on changes in correlation and higher-order comoments. We also split the full sample into three sub-periods while identifying two phases of the COVID-19 crisis. Our main empirical findings indicate significant evidence of contagion during the two COVID-19 phases, especially through the coskewness, cokurtosis, and covolatility channels. Interestingly, we find that most emerging Islamic equity markets are not immune from the contagious effects of the COVID-19 pandemic. Furthermore, we draw on six behavioural indicators and construct a new index entitled ‘Feverish sentiment’ to examine the causal relationships between investor sentiment and emerging Islamic equity index returns during the COVID-19 pandemic. Using both traditional and frequency-domain Granger causality tests, we find significant causal linkages between investor sentiment and some emerging Islamic equity markets in low, medium, and high frequencies. In particular, the results highlight an increase in the predictive power of investor sentiment during the second phase of the COVID-19 pandemic.
JEL CLASSIFICATION:
1. Introduction
The COVID-19 pandemic has been a nightmare for global stock markets. All over the world, these markets have suffered historic and unprecedented losses. The rapid and unexpected spread of this epidemic has created uncertainty about its severity and its long duration. As a result, the COVID-19 crisis represented a real threat to the stability of the global financial system. Some researchers confirmed that this pandemic was the result of an exogenous shock that led to negative effects and significant economic risks on the real economy of countries (Ashraf et al., Citation2022; Batrancea, Citation2021b; Roy & Kemme, Citation2020; Salisu & Shaik, Citation2022). Thus, the significant decline that occurred in the global financial stock markets due to this pandemic forced many investors to search for safe havens in order to hedge during the period of the COVID-19 crisis.
Some scholars considered that the solution lies in Islamic stocks because they are usually used as a safe haven for hedging during crises (Salisu & Shaik, Citation2022; Shahzad & Naifar, Citation2022). But the question that arises is whether these Islamic stocks are really immune from the risks of contagion that can be transmitted to them from the traditional stock markets. These conventional stocks have received major shocks during the epidemic period through the sharp drop in their market values and the high implied volatility. The economic impact of the spread of the COVID-19 crisis has also increased investors’ unwillingness to take on market risks in ways unfamiliar since the global financial crisis (GFC) of 2008.
Our attractiveness to Islamic stock markets is highlighted by some of the distinctive characteristics it has, compared to its conventional counterparts. Generally, traditional financial markets are very volatile and detached from real activity, and are also characterised by uncertainty, which represents an obstacle to investment. However, Islamic finance contributes to eliminating the fluctuations of financial markets and the imbalance of returns with the real growth of the economy and the net profit rate (Salisu & Shaik, Citation2022). This type of financing is mainly about risk and its sharing, which is closely related to real economic activities. Moreover, equity returns truly reflect the net rate of profit and are not influenced by speculation. Additionally, bankruptcy is not an option due to the lack of interest-based financing (Salisu & Shaik, Citation2022).
For reference, the Islamic financial assets have witnessed steady growth during the last decades. Their total values were estimated at $2.88 trillion at the end of 2019 and about $3.69 trillion at the end of 2024 (ICD-REFINITIV Islamic Finance Development Report, Citation2020).Footnote1 It should be stressed that Islamic financial instruments are generally compatible with Islamic law (Shariah) and are based on the principle of profit/risk-sharing and the concept of screening, which gives a set of ethical and financial constraints (Dewandaru et al., Citation2014; K. Hassan et al., Citation2023; Salisu & Shaik, Citation2022). Therefore, Islamic financial products are expected to be more resilient in crisis times owing to the prohibition of interest and the absence of risk transfer mechanisms (K. Hassan et al., Citation2023; Shahzad & Naifar, Citation2022). Otherwise, Islamic equity markets operate according to different mechanisms compared to their traditional counterparts (Rahman et al., Citation2021; Shahzad & Naifar, Citation2022). Under Islamic law, Islamic equity portfolios are subject to qualitative and quantitative screening. The qualitative screening eliminates shares of companies whose main business is unsuited to Islamic principles, such as businesses related to interest-bearing transactions, entertainment, gambling, alcohol, pork, weapons, tobacco, and excessive risk-taking. However, the quantitative screening excludes shares of companies whose primary business activity complies with Islamic principles, but which generate a significant portion of their revenue from non-permissible business activities. Therefore, the presence of screening criteria theoretically makes Islamic stocks less vulnerable to any shock because they have a lower leverage effect (Dewandaru et al., Citation2014).
The conservative nature of investing in Islamic equities has led to the common belief that it can protect against the excessive risk and volatility arising from conventional equity markets. Nevertheless, the recent COVID-19 pandemic caused an unprecedented effect on both global conventional and Islamic equity markets (Athari et al., Citation2023; Shahzad & Naifar, Citation2022; among others). The spread of this pandemic around the world led to extensive and severe impacts on the real economy. It also increased the global equity markets’ comovements and caused the spread of equity market disturbances. This big health crisis triggered a new cycle of uncertainty worldwide and fears of potential contagion risks on Islamic equity markets. Therefore, the following first research question guides our inquiry: Are emerging Islamic equity markets immune from contagion effects during the COVID-19 crisis?
Two facts have motivated us to examine the contagion effects originating from the conventional equity markets and transmitting to their Islamic counterparts. The first fact concerns unprecedented volatility in equities during the COVID-19 crisis periods, especially with the announcement of COVID-19 as a global pandemic on 11 March 2020, by the World Health Organization (WHO). The second fact relates to previous empirical studies’ conflicting findings on the comovement/dependence between conventional and Islamic equity markets in crisis times. Some empirical studies concluded that Islamic equities can be used as a cushion during crisis periods and support the decoupling hypothesis (Abu-Alkheil et al., Citation2017; Ahmad et al., Citation2018; Al-Yahyaee et al., Citation2020; Hkiri et al., Citation2017; Kenourgios et al., Citation2016; Muteba Mwamba et al., Citation2017; Rahman et al., Citation2021; Rizvi et al., Citation2015; Shahzad & Naifar, Citation2022). However, other empirical studies concluded that Islamic equities do not provide a cushion during crisis periods (Ajmi et al., Citation2014; Dewandaru et al., Citation2014; Hammoudeh et al., Citation2014; K. Hassan et al., Citation2023; Nazlioglu et al., Citation2015; Sensoy, Citation2016; Shahzad et al., Citation2017).
On the other hand, the conservative behaviour towards strict Sharia-compliant screening processes has shown differences in returns and volatility of Islamic stock prices in terms of risk factors, market conditions, and investor sentiment (Asif Khan et al., Citation2019; Hammoudeh et al., Citation2014; among others).Footnote2 Islamic equities have a further risk factor that is negatively linked to returns (Merdad et al., Citation2015). Hence, investor sentiment/attention has a more separate impact on returns and volatility of Islamic equities than on their conventional counterparts (Aloui et al., Citation2016; Narayan & Bannigidadmath, Citation2017). The feverish sentiment index is a new proxy for investor’s attention that helps us understand which countries are sending or receiving sentiment shocks (Huynh et al., Citation2021). This index is based on several sentiment indices regarding the COVID-19 crisis and has been used as a predictor of conventional stock prices (return and volatility). Using this proxy, Huynh et al. (Citation2021) have shown that investor sentiment negatively (positively) predicts the return (volatility) of conventional equities. Therefore, we attempt to answer the following second research question: What is the predictive ability of feverish sentiment index on emerging Islamic stock index returns?
This study covers the following three objectives. First, we empirically test the degree of immunity of Islamic stock markets from the contagion effects of the Corona virus crisis. Second, we construct a new measure of investor attention (known as feverish sentiment index) that can better predict emerging Islamic stock market returns and volatility. Third, we examine the causal relationships between investor sentiment and emerging Islamic equity index returns during the COVID-19 pandemic.
The first novelty of our empirical study fills the gap in the literature regarding the contagious effects of the COVID-19 pandemic on Islamic stock markets. The previous literature has shown extensive empirical studies on the contagion impacts of the GFC of 2008 and the Eurozone sovereign debt crisis (ESDC) of 2010 on Islamic equity markets. However, the literature about the more recent COVID-19 pandemic and its contagious effects on Islamic equity markets is almost understudied. We split the whole crisis period into two phases contrary to previous studies that have focused on a single crisis period. Phase 1 began with the recognition of the first case of COVID-19 in China on 31 December 2019, while Phase 2 started with the declaration of COVID-19 as a global pandemic on 11 March 2020. Therefore, we examine the international contagion effects on individual emerging Islamic equity markets during each phase of the COVID-19 pandemic, which to the best of our knowledge, has not been done before. We assume that the COVID-19 pandemic caused shifts in investors’ global appetite for risk. This assumption enables us to test the decoupling hypothesis, suggesting that Islamic markets are immune to the COVID-19 pandemic. Given that China was the first origin of COVID-19, its conventional equity market index can be considered a potential source of contagion for Islamic equity markets in phase 1. In phase 2, COVID-19 became a global pandemic. Accordingly, the conventional U.S. equity market index is selected as a second source of contagion for Islamic equity markets. For robustness checks, we also consider the conventional World equity Index as an alternative source of contagion in phase 2. Our second novelty comes from filling the gap in the literature of investor sentiment by examining the predictive ability of the new feverish sentiment index for emerging Islamic stocks during the COVID-19 pandemic.
We contribute to the existing empirical literature in two important ways. First, we use specific statistical tests to investigate the contagion effects of the COVID-19 pandemic on emerging Islamic equity markets. Basically, we apply the correlation-based tests proposed by Forbes and Rigobon (Citation2002) and extended by Fry et al. (Citation2010), the asymmetric dependence tests suggested by Fry et al. (Citation2010) and the new extremal dependence tests developed by Fry-McKibbin and Hsiao (Citation2018). To the best of our knowledge, this is the first study of its kind to investigate the contagion effects of the COVID-19 pandemic on emerging Islamic equity markets through the asymmetric- and extremal-based contagion tests. Our empirical findings show the superiority of nonlinear (asymmetric and extremal) dependence tests over the linear dependence (correlation-based) tests in capturing the contagious linkages between the receivers and the transmitters of contagion during the two phases of the COVID-19 pandemic. Moreover, we find that most emerging Islamic equity markets are not immune to the contagious effects of the pandemic. Second, we construct a new index called ‘Feverish sentiment’ to examine the causal relationships between investor sentiment and emerging Islamic equity index returns during each phase of the COVID-19 pandemic. To the best of our knowledge, our study is the first of its kind to use such a composite index for investigating its predictive ability for Islamic stock returns during the two phases of the COVID-19 pandemic. Using a frequency-domain Granger causality test, our findings show evidence of an increase in the predictive power of investor sentiment during the second phase of the COVID-19 pandemic.
The rest of the paper is organised as follows. Section 2 presents a review of the existing literature. Section 3 describes the data and provides the summary statistics. Section 4 presents the statistical methodology. Section 5 presents and discusses the empirical results. Section 6 concludes the paper.
2. Literature review
2.1. Contagion and Islamic equity markets
According to Forbes and Rigobon (Citation2002), contagion or ‘shift-contagion’ is defined as a significant increase in cross-market linkages (or comovements) after a shock (crisis) has occurred to one or group of markets. Alternatively, the authors introduced the notion of ‘normal’ interdependence, which indicates a high level of interconnectedness across markets in all states of the world. Such a normal level of interdependence might be due to preexisting market linkages, such as financial flows, exposure to common shocks, and trade channels. The existence of contagion suggests that a shock has caused a non-stability of the normal interconnectedness between markets. As argued by Forbes and Rigobon (Citation2002), the adopted definition of contagion has some advantages. First, it provides a clear empirical framework, which enables us to test whether the linkages between two markets increased in a crisis period compared to a stable period. Second, it provides a broad view of contagion, which allows us to explore the different linear and nonlinear channels of contagion.Footnote3
The research on contagion effects from conventional to Islamic equity markets experienced burgeoning growth after the GFC. Hammoudeh et al. (Citation2014) examined the dynamic dependence structure between the U.S. Islamic equity market, three conventional global equity markets, and four global financial and risk factors. Using a copula approach, they found that the U.S. Islamic equity market exhibits significant dependence on conventional equity markets and global factors. They also concluded that the decoupling hypothesis of the Islamic market from the conventional financial system is not well-supported by their empirical evidence. Using linear and nonlinear Granger causality tests, Ajmi et al. (Citation2014) also rejected the decoupling hypothesis of the U.S. Islamic equity market from its conventional counterparts, thereby reducing the portfolio benefits from diversification with Sharia-based markets.
Dewandaru et al. (Citation2014) examined market co-movements in Islamic and conventional equity markets across different regions during 9 major crises. Using wavelet decomposition, they found incomplete market integration and significant fundamentals-based contagion during the subprime crisis. A similar study by Rizvi et al. (Citation2015) investigated market co-movements in Islamic and conventional equity markets across the U.S. and the Asia Pacific. Using the wavelet methodology, the authors showed that most of the global shocks since 1996 were transmitted via excessive linkages from the U.S. to the Asia Pacific, while the subprime crisis has revealed a fundamentals-based contagion. Their results also indicated that Islamic equity markets show traces of reduced exposure in some crises, due to the low leverage effect.
Majdoub and Mansour (Citation2014) examined the conditional correlations across the U.S. and five Islamic emerging equity markets. Using multivariate GARCH BEKK, CCC, and DCC models, they found evidence of low volatility spillovers between the U.S. and Islamic emerging equity markets. Kenourgios et al. (Citation2016) investigated the contagion effects of the GFC and ESDC on Islamic equity and bond markets. Using the multivariate APARCH-A-DCC process, they showed no evidence of contagion between conventional and Islamic equity and bond markets, revealing the decoupling hypothesis of the Islamic equities.
Nazlioglu et al. (Citation2015) examined the volatility/risk transmission or spillovers between the Dow Jones Islamic stock and three conventional equity markets for the U.S., Europe, and Asia during the pre- and the in- and post-GFC periods. Using the Lagrange multiplier-based causality-in-variance test (Hafner & Herwartz, Citation2006), the authors showed evidence of risk transfers and hence contagion effects between the global conventional and Islamic equity markets during the whole sample and subperiods. Their findings also indicate that Islamic equity markets allow transmitting risk and volatility to and from conventional equity markets because they are fundamentally different.
Hkiri et al. (Citation2017) analysed the total, directional and net volatility spillovers across nine regional Islamic equity market indices and their conventional counterparts during various financial crisis periods. Their objective was to test the decoupling and contagion hypotheses on the safe-haven status of the Islamic equity markets. Using a generalised vector autoregressive framework, they showed that the contagion hypothesis is evident for both Islamic and conventional equity indices. Their empirical findings also suggest the existence of a decoupling of the Islamic equity indices originating from their conventional counterparts during crisis periods.
K. Hassan et al. (Citation2023) examined whether Islamic equities are immune from the GFC originating in conventional equity markets. Using different econometric techniques, including the Markov Switching GARCH-DCC model, and the correlation, asymmetric and extremal dependence tests, the authors showed strong evidence of contagion effects of the GFC on Islamic equity markets. Their findings also indicate that Islamic equities cannot be used as haven assets during the crisis periods.
The more recent empirical literature has focused on the contagion impacts of the COVID-19 pandemic on conventional equity markets (Akhtaruzzaman et al., Citation2021; Alqaralleh & Canepa, Citation2021; Athari & Hung, Citation2022; Bello et al., Citation2022; Chopra & Mehta, Citation2022; Fry-McKibbin et al., Citation2022; Fu et al., Citation2021; Guo et al., Citation2021; Nguyen et al., Citation2022; Okorie & Lin, Citation2021). However, empirical studies of the contagion effects of the COVID-19 pandemic on Islamic equity markets originating from their conventional counterparts seems understudied. To the best of our knowledge, only the study of Shahzad and Naifar (Citation2022) has examined the impact of the COVID-19 pandemic on the co-movement between global Islamic and conventional equity markets. Using wavelet-based multi-timescales techniques, their results indicate that both global markets are strongly associated and tend to co-move highly during the sample period, rebutting the decoupling hypothesis of the Islamic equity market from the conventional market. The authors also highlight that the Shariah screening process fails to provide immunity to Islamic equity markets against the COVID-19 pandemic. Their findings also suggest that Islamic equity markets do not present any hedging or safe-aven benefit for investors.
2.2. Investor sentiment and Islamic equity markets
For investors, the Islamic financial system is an alternative market for investment opportunities. Meanwhile, investors are generally attracted to Islamic financial products because they help improving social welfare and public goods, limiting social crises, reducing injustices, and bringing real value to the economy (Asif Khan et al., Citation2019; Dash & Maitra, Citation2018b). In practice, Shariah-compliant securities can be influenced by macroeconomic factors as well as market factors such as investor sentiment that allow investors to earn above-market returns.
From a theoretical point of view, Sharia-compliant security prices (returns and volatility) and sentiment have two complementary arguments (Asif Khan et al., Citation2019). First, Shariah indices are often subject to strict and active Shariah oversight, and faith-based investors. This can prevent Islamic stocks from tending towards sentiment and can also prevent sentiment-induced mispricing. Second, Shariah screening processes can lead stocks to barriers to short selling (Miller, Citation1977) and limit arbitrage (Shleifer & Vishny, Citation1997). This may imply that Sharia stocks are more affected by noise traders that sustainably deviate their prices from fundamentals.
Recently, these complementary arguments have sparked the interest of scholars in the study of investor sentiment and Islamic stock market returns. Aloui et al. (Citation2016) investigated the comovement between investor sentiment and Islamic equity returns over different time scales and frequencies in the US stock market. Using asymmetric causality tests, their findings suggest that cap firms are vulnerable to negative innovations in investors sentiment. They also found that Sharia rules have no effect on the connectedness between investor sentiment and Islamic equity returns. Perez-Liston et al. (Citation2016) analysed the impact of investor sentiment on the returns and volatility of several U.S. Dow Jones Islamic equity indices. Using GARCH and VAR models, their results indicate that as noise traders create more risk, the market appears to reward them with higher expected returns. Using a dynamic time series regression model, Narayan and Bannigidadmath (Citation2017) showed that financial news predicts Islamic stock returns differently compared to their conventional counterparts. Basically, they found that investing in Islamic stocks is relatively more profitable than investing in non-Islamic stocks. Similarly, Trichilli et al. (Citation2018) examined the predictability of investor sentiment (proxied by internet search data) for Islamic stock returns in MENA countries. Using multivariate GARCH and Wavelet coherence approaches, the authors showed that investor sentiment has higher predictability in MENA Islamic stock markets. Dash and Maitra (Citation2018a) investigated the effect of investor sentiment along with systematic risk factors and macroeconomic variables on Shariah indices return behaviour from Indian stock market. Using linear and nonlinear causality tests, their results suggest that sentiment matters as priced risk for Shariah indices return behaviour. Ftiti and Hadhri (Citation2019) investigated the causal linkage between investor sentiment along with other factors and stock returns of nine Dow Jones Islamic market indices. Using a multiscale decomposition approach, the authors found that investor sentiment may improves the predictability of Islamic stock returns. Otherwise, Asif Khan et al. (Citation2019) examined the predictability of investor sentiment for Islamic stock return volatility. They constructed a new investor sentiment index from Google search volume (GSV) for Islamic stock markets. Their results provide strong predictability evidence for investor sentiment in Islamic stock markets. Lastly, K. Hassan et al. (Citation2023) used market-based proxies for investor sentiment (Baker & Wurgler, Citation2006, Citation2007) to examine whether it has a causal effect on Islamic stock returns. Using a frequency domain causality approach, the authors found that investor sentiment can predict Islamic stock returns during the GFC crisis period.
3. Data and summary statistics
3.1. Data description
Our data set consists of daily closing Morgan Stanley Capital International (MSCI) equity indices prices on 24 emerging Islamic and three conventional markets.Footnote4 Our choice of sample is based solely on data availability. The market capitalisation of Islamic equity indices is generally smaller than that of the conventional World and U.S. indices. Moreover, these indices are value-weighted, with the specificity that a particular stock can have a substantial portion of the index. Furthermore, all MSCI indices are priced in US dollars and extracted from the DataStream database. The choice we make based on daily data can be justified for three main reasons. First, a daily frequency covers richer information than weekly, monthly, or quarterly frequencies (Kenourgios et al., Citation2016). Second, it provides enough observations that enable us to avoid the inefficiency that may occur when a time-varying model is used for testing the contagion before and after crisis periods based on smaller samples (Bannigidadmath & Narayan, Citation2016; Kenourgios et al., Citation2016). Third, the sample of MSCI equity indices does not suffer from the ‘non-synchronous trading problem’ or ‘stale quote problem’ (Lin et al., Citation1994) for different international equity markets. Accordingly, there is no need for using the two-day rolling-average returns method to resolve these issues (Chiang et al., Citation2007; Forbes & Rigobon, Citation2002; Hon et al., Citation2004; Mollah et al., Citation2016; Wang et al., Citation2017). For each MSCI equity index, its continuously compounded daily return series can be computed as where
is the closing price on day
Our analysis chooses the COVID-19 pandemic as the decisive crisis event, while data on MSCI equity market indices cover the period spanning from 31 December 2018 to 20 August 2020. Following Fry-McKibbin et al. (Citation2022), we divide the whole sample period into three sub-periods. The first sub-period refers to the pre-COVID-19 phase, and it is chosen one year before the announcement of the first COVID-19 case in China. It covers the period spanning from 31 December 2018 to 30 December 2019. The second subperiod represents the COVID-19 phase 1, starting with the first recognised case of COVID-19 in China on 31 December 2019, and ending on 10 March 2020. The third sub-period stands for the COVID-19 phase 2. It has begun on 11 March 2020, when WHO declared the COVID-19 outbreak a global pandemic and ended on 20 August 2020.Footnote5
In addition, following some recent studies (Fry-McKibbin et al., Citation2022; K. Hassan et al., Citation2023; Kenourgios et al., Citation2016; Mollah et al., Citation2016; Peillex et al., Citation2019), we select three conventional equity indices to be the potential sources of contagion, while the 24 emerging Islamic equity indices are chosen as recipients of contagion: (i) Since the first phase was about a big local event in China, the conventional MSCI China All Shares Index can be considered as a source of contagion during this period. The MSCI China All Shares Index represents large and mid-cap equity performance across China A‐shares, B‐shares, H‐shares, Red‐chips, P‐chips, and foreign listings. It reflects the opportunity set of China share classes listed in Hong Kong, Shanghai, Shenzhen, and outside of China. (ii) The second phase starts when the COVID-19 crisis is no longer localised only in China but has spread throughout the world and become a global crisis. During this period, the conventional MSCI USA Index can be considered a source of contagion for the emerging Islamic equity markets. Three main reasons justify our choice. First, the MSCI USA Index represents 63% of the MSCI World Index. It measures the performance of the large and mid-cap segments and represents approximately 85% of the U.S. market. Second, the U.S. equity market is the largest in the world and continues to be among the deepest, most liquid, and most efficient. Third, the U.S. has more laboratory-confirmed COVID-19 cases and fatalities than any other country during the second phase. (iii) The conventional MSCI All Country World Index is the second alternative source of contagion in the second phase of the COVID-19 crisis. The main reason for such a choice is that such a broad global equity index captures large and mid-cap equity performance across all 23 developed markets. It also covers approximately 85% of the free float-adjusted market capitalisation in each country.
3.2. Summary statistics
report the descriptive statistics of the MSCI equity index returns during the non-crisis and crisis periods. The commonly used statistics include the measures of central tendency (mean, median) and those of variability or risk (minimum, maximum, standard deviation (SD), downside deviation (DD), skewness, and kurtosis). Regarding the measures of variability, we use the DD instead of SD (Sortino & Price, Citation1994). According to Sortino and Price (Citation1994), the DD is defined as the root-mean-square of the deviations of the realised equity index return’s underperformance from the Minimum Acceptable Return (MAR)) where all equity index returns above this target are treated as underperformance of zero. Therefore, only the equity index returns falling below the target return is considered risky. The DD is calculated by setting the MAR equal to zero. The results given in indicate that the variability of the performance below the MAR is substantially higher during the two crisis periods compared to the non-crisis period for almost all equity markets indices. The only exception concerns the Turkish market index where the DD is found to be higher during the pre-COVID-19 phase compared to the COVID-19 phase 1. Furthermore, the results of the third- and fourth-order moments (i.e., skewness and kurtosis) show that all MSCI equity index return series exhibit fat-tailed and asymmetrical distributions during all considered three sub-periods. Interestingly, our results show two important characteristics for Islamic equity index returns. First, we find that the return distribution, after the COVID-19 shock, switches from negative skewness to positive skewness for some markets including Morocco, Taiwan, Indonesia, and Qatar. Therefore, these equity index returns exhibit a skewness behaviour, with skewness rising during the COVID-19 phases. Such behaviour can be attributed to investors preferring equities whose returns are right-skewed to equity index returns that are left-skewed (Fry et al., Citation2010). Second, a further characteristic of equity index returns is that they exhibit leptokurtic behaviour, with kurtosis rising during the COVID-19 phases for almost all emerging Islamic equity markets. The lower kurtosis observed during the pre-COVID-19 phase is due to investors preferring equities with positive returns and negative skewness (Brunnermeier & Pedersen, Citation2009). Otherwise, following Brunnermeier and Pedersen (Citation2009), we can expect that after the COVID-19 crisis periods, investors may end up holding equity indices with negative returns and negative skewness, leading to higher kurtosis. The findings of the Jarque-Bera (J-B) test further confirm the above results and show that the majority of equity index return series are not normally distributed over the three sub-periods.
Table 1. Descriptive statistics for MSCI equity index return series during the pre-COVID-19 phase.
Table 2. Descriptive statistics for MSCI equity index return series during the COVID-19 phase 1.
Table 3. Descriptive statistics for MSCI equity index return series during the COVID-19 phase 2.
Table 4. Mean and variance comparison test results.
Concerning the measures of central tendency, the results shown in and indicate that the mean returns during the pre-COVID-19 phase are higher than those during the COVID-19 phase 1. We can confirm this finding by conducting the mean comparison -tests where the null hypothesis is
Footnote6 The results of the
-tests are outlined in . The outcomes indicate that the null hypothesis is rejected for almost all equity market indices. This suggests that, during the COVID-19 phase 1, almost individual Islamic equity index return series are significantly lower than those during the pre-COVID-19 phase. Furthermore, we consider the mean returns of all emerging Islamic equity indices during both the pre-COVID-19 phase and COVID-19 phase 1. The findings show that the mean returns during the non-crisis period are higher than those during the COVID-19 phase 1.
The results, given in , also show that standard deviations for each equity index return series during the pre-COVID-19 phase are lower than those during the COVID-19 phase 1 (except for Turkey). To validate this finding, we conduct the variance comparison -tests, where the null hypothesis is
with
and
denoting the standard deviations during the pre-COVID-19 phase and COVID-19 phase 1, respectively. Except for Turkey and Chile, the results of the
-test show that the null hypothesis is strongly rejected. This result highlights that the standard deviations of nearly all the emerging Islamic equity index return series are substantially higher during the COVID-19 phase 1 than those during the pre-COVID-19 phase. Such finding suggests that, with a few exceptions, all emerging Islamic equity indices become riskier during the COVID-19 phase 1. We also apply the variance comparison
-test with the standard deviations of all emerging Islamic equity index return series during the pre-COVID-19 phase and COVID-19 phase 1. The
-test results indicate that the standard deviations during the pre-COVID-19 phase are lower than those during the COVID-19 phase 1.
We repeat the same analysis by comparing the results for both the pre-COVID-19 phase and COVID-19 phase 2 (see and ). The main conclusion that can be drawn is that the standard deviations of all emerging Islamic equity index return series are significantly higher during the COVID-19 phase 2 than those during the pre-COVID-19 phase. Therefore, all emerging Islamic equity indices are even riskier during the second phase of the COVID-19 pandemic. We also perform both the mean and variance comparison tests with the pre-COVID-19 phase and COVID-19 phase 2 for all emerging Islamic equity indices. The results show that both the mean returns and standard deviations during the pre-COVID-19 phase are lower than those during the COVID-19 phase 2.
4. Methodology
The current study uses the following notations. Let denotes the sample size of the pre-COVID-19 phase, while
stands for the sample size of a COVID-19 phase, with
indicating the full sample size. Let also
and
represent the estimated unadjusted (unconditional) correlation coefficients between equity index returns in periods
and
respectively. The source of contagion, where the shock originated, is denoted as
while the recipient of contagion is
The equity index returns are denoted by
and
for markets
and
respectively. The average equity index returns for
and
markets during
and
periods are denoted as
and
respectively. The standard deviation of equity index returns for
and
markets during
and
periods are respectively denoted as
and
Lastly, let
and
denote the sample variances of equity index returns
and
in periods
and
4.1. Linear channels of financial contagion
The linear channels of financial contagion can be examined through the correlation-based tests suggested by Forbes and Rigobon (Citation2002) and Fry et al. (Citation2010). According to Forbes and Rigobon (Citation2002), (shift) contagion can be defined as an increase in the heteroskedasticity-adjusted (conditional) correlation coefficient. They proposed the following statistic:
(1)
(1)
where
is the estimated adjusted correlation coefficient in period
and
captures the change in the ratio of the variance in recipient market
relative to the source market
between periods
and
Forbes and Rigobon (Citation2002) estimated a vector autoregressive (VAR) model and used their variance-covariance estimates to calculate the unconditional correlation coefficient between the source market and the recipient market
In addition, they assumed a nonexistent endogeneity problem and used
-tests to examine whether there is a significant increase in correlations during the period
To show evidence of contagion from the source market to the recipient market
through the linear (correlation) channel, Forbes and Rigobon (Citation2002) proposed the following statistic:
(2)
(2)
The statistic enables us to test for contagion from the expected equity index returns of the source market
to the expected equity index returns of the recipient market
To test whether there is a significant change in the correlation coefficient, Forbes and Rigobon (Citation2002) suggested the following set of hypotheses:
(3)
(3)
Under the null hypothesis of no contagion, the
statistic is asymptotically distributed as
(4)
(4)
To test for the existence of contagion effects, a one-sided -test is applied to
Fry et al. (Citation2010) proposed a variant of the Forbes and Rigobon (Citation2002) contagion test by comparing the adjusted correlations between periods and
To test for the existence of contagion from a source market
to a recipient market
Fry et al. (Citation2010) proposed the following statistic:
(5)
(5)
where
is the estimator of
in EquationEquation (1)
(1)
(1) .
The statistic makes EquationEquation (1)
(1)
(1) a two-sided test. The expression of
is given as follows:
(6)
(6)
where
(7)
(7)
(8)
(8)
(9)
(9)
with
denotes the empirical centered moments.
The set of hypotheses given by EquationEquation (3)(3)
(3) can be used to test the null (alternative) hypothesis of no contagion (contagion) from the source market
to the recipient market
Under the null hypothesis of no contagion, the
statistic is distributed as
(10)
(10)
4.2. Nonlinear channels of financial contagion
As argued by Fry et al. (Citation2010) and Fry-McKibbin and Hsiao (Citation2018), the linear channels are insufficient to grasp the whole contagion pattern. Moreover, they indicated that the relevant information can be obtained from nonlinear dependence. Therefore, these authors suggested using the nonlinear channels of contagion, which can be investigated through both the asymmetric and extremal dependence tests proposed by Fry et al. (Citation2010) and Fry-McKibbin and Hsiao (Citation2018), respectively. The asymmetric dependence tests for contagion are based on higher-order moments of the equity index return distribution. These tests of contagion aim to identify whether there is a statistically significant change in coskewness between non-crisis and crisis periods. Alternatively, the extremal dependence tests for contagion allow us to capture the changes in both cokurtosis and covolatility.
4.2.1. Coskewness channel of financial contagion
According to Fry et al. (Citation2010), the coskewness channel of financial contagion captures changes in coskewness that emerge from the interaction between the first-order moment (expected returns) and the second order-moment (volatility or squared returns) of the joint distribution of sample returns. The first type of coskewness statistic enables us to test for contagion where the shocks are transmitted from the change in the equity index returns of the source market
to the volatility of equity index returns of the recipient market
The second type
allows testing for contagion where the shocks spread from the volatility of equity index returns of the source market
to the equity index returns of the recipient market
Formally, both the
and
statistics are given by
(11)
(11)
(12)
(12)
where
is the estimator of
in EquationEquation (1)
(1)
(1) , and
and
denote the sample coskewness coefficients in periods
and
For
the latter coefficients are defined as follows:
(13)
(13)
(14)
(14)
Notice that and
stand for the continuously compounded daily log-returns of equity market
on day
in periods
and
Moreover,
denotes the correlation between returns of equity markets
and
in period
and
To test whether there is a significant change in coskewness, Fry et al. (Citation2010) suggested the following set of hypotheses:
(15)
(15)
Under the null hypothesis of no contagion, the and
statistics are asymptotically distributed as follows:
(16)
(16)
4.2.2. Cokurtosis channel of financial contagion
As argued by Fry-McKibbin and Hsiao (Citation2018) and Fry-McKibbin et al. (Citation2019), the coskewness channel may not be sufficient to display the complete pattern of contagion. They introduced the cokurtosis channel of contagion, which captures the interaction between the first-order moment (expected returns) and the third order-moment (skewness) of the joint distribution of equity index returns. Therefore, the cokurtosis test allows capturing the significant changes in the fourth-order comoments of the joint distribution of equity index returns series. The first (second) cokurtosis statistic, captures contagion from the expected returns (skewness) of the source market
to the skewness (expected returns) of the recipient market
Formally, both the
and
statistics are given by
(17)
(17)
(18)
(18)
where
is the estimator of
in EquationEquation (1)
(1)
(1) and
(19)
(19)
(20)
(20)
To test whether there is a significant change in cokurtosis, Fry-McKibbin and Hsiao (Citation2018) suggested the following set of hypotheses:
(21)
(21)
Under the null hypothesis of ‘no contagion’, the and
statistics are asymptotically distributed as
(22)
(22)
4.2.3. Covolatility channel of financial contagion
Fry-McKibbin and Hsiao (Citation2018) developed a third extremal dependence test for contagion based on changes in covolatility. This test allows the detection of the contagion effect from the volatility of equity index returns in a source market to the volatility of equity index returns in a recipient market
As argued by Fry-McKibbin and Hsiao (Citation2018), the change in the linkage between volatilities, from negative to positive after the occurrence of a shock, reflects the volatility smile effect through the covolatility channel in the crisis period. To detect contagion from the source market
to the recipient market
through the covolatility channel, Fry-McKibbin and Hsiao (Citation2018) proposed the following covolatility statistic:
(23)
(23)
where
(24)
(24)
(25)
(25)
To test whether there is a significant change in covolatility, Fry-McKibbin and Hsiao (Citation2018) suggested the following set of hypotheses:
(26)
(26)
Under the null hypothesis of ‘no contagion’, the
statistic is asymptotically distributed as follows:
(27)
(27)
5. Results and discussion
5.1. Higher-order comoment relationships
In this paper, we investigate the nonlinear channels of financial contagion using the third- and fourth-order moments of the equity index return distributions. Therefore, it is important to check whether the fat tails and asymmetry that are observed in the Islamic equity index return series are related to those of MSCI China All Shares, MSCI USA, and MSCI All Country World conventional indices. Furthermore, we examine whether these empirical stylised facts are significantly different between crisis and non-crisis periods. All these issues are inspected using the higher-order comoments such as the coskewness, cokurtosis, and covolatility measures.
In and , we report the results of the different higher-order comoment relationships for 24 emerging Islamic markets with respect to the conventional Chinese, and U.S. markets in the pre-COVID-19 period, the Chinese market in COVID-19 phase 1, and the U.S., and World markets in COVID-19 phase 2. The conventional equity markets are represented by = {China, U.S., World}, while the emerging Islamic equity markets are denoted by
= {China, Egypt, Kuwait, United Arab Emirates, Qatar, Saudi Arabia, Oman, Turkey, Brazil, Chile, Mexico, Peru, Thailand, Russia, South Africa, Czech Republic, Indonesia, India, Malaysia, Philippines, Poland, Taiwan, Morocco, Bahrain},
Table 5. Comoment statistics for emerging Islamic equity index returns (in percent) during the pre-COVID-19 phase and COVID-19 phase 1 (source of contagion: China).
Coskewness and cokurtosis are two measures of how much two equity index return series change together. They refer to the third and fourth standardised cross-central moments of the return distributions and can be used to measure the securities’ risk with regard to market risk (Harvey & Siddique, Citation2000; Lin et al., Citation1994; Potì & Wang, Citation2010; Smith, Citation2007). Moreover, they represent two measures of risk in the context of both asset pricing and capital asset pricing models (Fang & Lai, Citation1997; Harvey & Siddique, Citation2000; Lin et al., Citation1994). Coskewness and cokurtosis are respectively related to skewness and kurtosis as covariance is related to variance. If two equity index return series exhibit positive coskewness or positive cokurtosis, they will tend to undergo extreme positive deviations (i.e., positive returns in excess of market returns) at the same time. However, if they show negative coskewness or negative cokurtosis, they will simultaneously have extreme negative deviations (i.e., lower returns than market returns). As documented by Kostakis et al. (Citation2012), equity index returns with negative coskewness and positive cokurtosis values, i.e., with respect to the market portfolio returns, yield significant premiums over counterpart firms with positive coskewness and negative cokurtosis, respectively.
As revealed by Scott and Horvath (Citation1980), the directional preference for rational investors is positive (negative) for positive (negative) values of every odd central moment and negative for every even central moment. Such investors should therefore exhibit on average a positive preference for odd central moments and a negative preference for even central moments. Therefore, rational investors are rewarded for bearing covariance and cokurtosis risks and forego the expected excess returns in exchange for the benefit of the positive or lower negative coskewness (Fang & Lai, Citation1997).
Given the importance of coskewness, cokurtosis, as well as covolatility in empirical asset pricing, we examine the contribution of Islamic equity indices to the skewness, kurtosis, and volatility of the global market portfolio during the non-crisis and crisis periods. If Islamic indices are less risky than conventional indices, then we should expect that adding them to the global market portfolio will result in a less risky position during the two COVID-19 crisis periods compared to the pre-COVID-19 period. The three conventional equity indices are assumed to represent well-diversified global market portfolios. Then, we calculate the coskewness, cokurtosis, and covolatility of Islamic equity indices with these three market portfolios.
The findings in show an increase in return correlations during the COVID-19 phase 1 for all market pairs except for Russia, revealing an increase in return comovement during this phase. During the COVID-19 phase 2, the results in and show an increase in return comovement for all pairs of markets except for China and Qatar. Besides, the results of the mean comparison
-test show that the differences in average returns between non-crisis and crisis periods are statistically significant at the 1% level.
Table 6. Comoment statistics for emerging Islamic equity index returns (in percent) during the pre-COVID-19 phase and COVID-19 phase 2 (source of contagion: U.S.).
Table 7. Comoment statistics for emerging Islamic equity index returns (in percent) during the pre-COVID-19 phase and COVID-19 phase 2 (source of contagion: WORLD).
Regarding the related volatility for each pair of the recipient and the source of contagion, the results show a substantial increase in covolatility for all pairs of equity markets during the COVID-19 crisis periods except for China and Qatar. This finding shows a strengthening of the volatility spillovers during the two crisis periods. Furthermore, the results of the mean comparison -test show that the difference in volatility returns between non-crisis and crisis periods is strongly significant.
Likewise, the findings in and show a general pattern of increase in return cokurtosis during the two crisis periods for all pairs of markets except for China, Russia, United Arab Emirates, Qatar, Malaysia, and Taiwan. This finding suggests a general reinforcement of the linkage between returns and ‘fat-tail’ (kurtosis) risk during the COVID-19 phases. Moreover, the average return cokurtosis for all emerging Islamic equity indices increase significantly during the two COVID-19 crisis periods with China, the U.S., and the World as sources of contagion. These differences are found to be strongly significant.
However, the results in and show a general pattern of decrease in return coskewness during the two crisis periods. Such evidence reflects the aggregate behaviour of risk-averse investors who prefer negative coskewness. Two exceptions are observed for China and Russia whose results show a positive increase in return coskewness during the COVID-19 phase 1. Some other exceptions are also detected for Qatar, Mexico, Indonesia, Malaysia, and Poland during the COVID-19 phase 2. These results reflect the behaviour of rational investors who generally prefer positive coskewness (Kraus & Litzenberger, Citation1976). Furthermore, the average return coskewness decreases significantly during the two phases of the COVID-19 pandemic regardless of the source of contagion. Besides, the null hypothesis of no significant difference between the mean returns during the non-crisis and crisis periods is found to be strong. This shows that the risk of negative coskewness increases significantly during the two phases of the COVID-19 pandemic. Such an important finding indicates that the emerging Islamic equity indices are not immune from the COVID-19 pandemic.
Referring to the above results, any combination of the emerging Islamic equity indices with the conventional indices (sources of contagion) will provide a portfolio characterised by significant skewness and kurtosis risks during the crisis periods compared to the non-crisis period. Such a result implies the existence of asymmetric and extremal dependence between the emerging Islamic and conventional equity markets. It also indicates that emerging Islamic equity indices do not provide a greater safety net to the conventional equity indices during the two COVID-19 phases.
5.2. Results of contagion tests in COVID-19 phase 1
Before calculating the contagion test statistics, we estimate a VAR(1) model to control for market fundamentals (Forbes & Rigobon, Citation2002). Then, we compute the contagion test statistics while comparing the pre-COVID-19 phase with the two COVID-19 phases. Three conventional equity indices are used as proxies for the COVID-19 pandemic. The MSCI China All Shares index is selected as a source of contagion in COVID-19 phase 1, while the MSCI USA and MSCI All Country World indices represent the source of contagion in COVID-19 phase 2.
The results of the comoment tests of contagion along with those based on changes in correlation are reported in . They show relatively strong evidence of contagion from the conventional Chinese equity market to the emerging Islamic equity markets during the COVID-19 phase 1. The null hypothesis of no contagion is rejected for 57.14% of the seven contagion tests conducted at the popular levels of significance. The correlation-based contagion tests provide weak evidence of contagion during the COVID-19 phase 1. Based on both and
correlation tests, the null hypothesis of no contagion is rejected in 7/24 and 5/24 cases, respectively. However, the null hypothesis of no contagion is rejected 17 and 16 times for both the
and
coskewness tests, 20 and 14 times for both the
and
cokurtosis tests, and 18 times for the
covolatility test. We find no evidence of contagion from the conventional Chinese equity market to the Chinese, Turkish, Russian, and Polish Islamic equity markets. Furthermore, the Islamic Malaysian equity market records only one incidence of contagion through the cokurtosis channel. Otherwise, the Islamic indices of Kuwait, Oman, Mexico, Peru, and Bahrain have the most contagious linkages with the conventional MSCI equity index of China.
Table 8. Comoment tests of contagion during COVID-19 phase 1 ( = China).
As an overview, the results in indicate that the higher-order comoment contagion tests are more important in capturing contagious linkages than the correlation-based contagion tests during the COVID-19 phase 1. Interestingly, the strongest evidence of contagion from China arises through the extremal dependence tests, with the percentage of contagion cases being 83.33%, 58.33%, and 75% with the
and
tests, respectively. For both the
and
coskewness tests, the percentage of contagion cases were respectively 70.83% and 66.67%.
As shown in , more than 75% of the emerging Islamic equity markets record more incidence of contagion during the COVID-19 phase 1 through the cokurtosis and covolatility channels. This finding can be interpreted as that equity investors are more concerned with both ‘fat tail’ and volatility risks than with the skewness risk during the COVID-19 phase 1. Therefore, rational investors should not ignore the kurtosis risk since it will cause any model to understate the risk of variables with high kurtosis. In terms of portfolio management, those investors should hedge against ‘fat tail’ risk by enhancing the returns over the long term, while assuming the short-term costs. Accordingly, rational investors may look to diversify their portfolios to hedge against the ‘fat tail’ risk.
5.3. Results of contagion tests in COVID-19 phase 2
reports the results of the correlation- and comoment-based contagion tests, with the conventional U.S. equity market being the source of contagion during the COVID-19 phase 2. During this phase, the proportion of active contagion channels jumps to 71.43%. The Malaysian market experiences contagion through the fewest channels (two), while the Saudi Arabia market shows evidence of contagion through three channels. The remaining markets experience contagion through at least four channels. To confirm the weight of evidence of contagion during the second phase of the COVID-19 pandemic, the null hypothesis of no contagion is rejected in 16/24 and 23/24 cases for both the and
coskewness tests, respectively. Compared to the first phase of the crisis, the percentage of contagion cases jumped to 95.83% during the COVID-19 phase 2. Alternatively, every Islamic equity market shows evidence of cokurtosis contagion, and all but four markets (Saudi Arabia, Mexico, Malaysia, and Taiwan) experience covolatility contagion.
Table 9. Comoment tests of contagion during the COVID-19 phase 2 ( = U.S.).
These results indicate that the strongest evidence of contagion from the U.S. arises through the extremal dependence tests, with the percentage of contagion cases being 91.67%, 100%, and 83.33% with the
and
tests, respectively. Although we find that approximately 8 of 24 emerging Islamic equity markets experience contagion based on both
and
correlation tests, the contagion tests based on changes in correlation are still less prevalent than those based on changes in higher-order comoments. This result corroborates the findings found by K. Hassan et al. (Citation2023). Moreover, our empirical findings indicate that the extremal dependence tests for contagion are relatively more important than the asymmetric dependence tests. Almost all emerging Islamic equity markets record more incidence of contagion during the COVID-19 phase 2 through the cokurtosis channel. We interpret this result as evidence that equity investors are more concerned with the ‘fat tail’ risk than with skewness and volatility risks during the COVID-19 phase 2.
reports the results of the different contagion test statistics, with the source of contagion being the conventional MSCI All Country World Index during the COVID-19 phase 2. The null hypothesis of no contagion is rejected for 72.02% of the different contagion tests conducted. Based on both and
correlation tests, the null hypothesis of no contagion is rejected in 9/24 and 7/24 cases, respectively. The strongest evidence of contagion arises through the higher-order comoment contagion tests, with the null hypothesis of no contagion being rejected in 16/24 and 23/24 cases for both
and
tests, 24/24 and 21/24 cases for both
and
tests, and 21/24 cases for the
test. These findings are consistent with those reported in , revealing that contagion is more intense in phase 2 than in phase 1.
Table 10. Comoment tests of contagion during the COVID-19 phase 2 ( = WORLD).
The results of the comoment-based contagion tests reinforce our initial findings on the higher-order comoment relationships. They stipulate that the COVID-19 pandemic had significant contagious impacts on the emerging Islamic equity markets. Therefore, the selected emerging Islamic equity indices cannot provide a shield against the COVID-19 crisis. To the best of our knowledge, our empirical study is the first that has investigated the contagion effects of the COVID-19 pandemic on the emerging Islamic equity markets. Previous empirical studies have rather examined the impact of the GFC and ESDC on the Islamic equity markets (Ajmi et al., Citation2014; K. Hassan et al., Citation2023; Kenourgios et al., Citation2016; Nazlioglu et al., Citation2015; Rizvi et al., Citation2015).
Alternatively, we find that most emerging Islamic equity markets are not immune to the contagious effects of the COVID-19 pandemic. This result seems to be surprising and can be explained by the fact that Islamic equities are not original Islamic instruments involving risk-return (loss-and-profit) sharing (‘Musharakah’)Footnote7 system, but rather replicas (Azmat et al., Citation2016; K. Hassan et al., Citation2023).
5.4. Causal relationships between investor sentiment and emerging Islamic equity index returns during the COVID-19 pandemic
Generally, religious, or faith-based investors aim to generate returns by selecting investments that align with their religious beliefs and values. As argued by K. Hassan et al. (Citation2023), among others, investors in Islamic equities are not necessarily faith-based. They also indicated that, even for faith-based investors, Islamic equities are replicas of original Islamic instruments. Therefore, the behaviour and perceptions of these investors may respond like those of conventional equities during the crisis periods. Previous empirical studies have shown that individual investor perceptions play an important role in trading and risk-taking behaviour during the past crises such as the GFC (K. Hassan et al., Citation2023; Hoffmann et al., Citation2013, Citation2015).
We examine this possibility by investigating the potential effects of investor sentimentFootnote8 on emerging Islamic equity index returns during the two phases of the COVID-19 pandemic. However, to the best of our knowledge, only the research of K. Hassan et al. (Citation2023) has explored the effect of investor sentiment on Islamic equity returns during the GFC. For this purpose, we draw on a wide range of behavioural indicatorsFootnote9 (panic, media hype, fake news, sentiment, infodemic, and media coverage) of the seventeen largest countriesFootnote10 and data from 01 January 2020 to 20 August 2020. The sentiment index data is collected based on daily frequency from the RavenPackFootnote11 database, which provides media data regarding the coronavirus problems. Then, we construct an aggregate measure, known as the ‘Feverish Sentiment Index’ (FSI), for coronavirus-related panic at the country and World levels by using the principal component analysis (PCA)Footnote12 (Aggarwal et al., Citation2021; Cepoi, Citation2020; Haroon & Rizvi, Citation2020; Huynh et al., Citation2021; Rognone et al., Citation2020).
A brief definition of the six indicators is displayed in . The PCA technique enables us to isolate the common component of all sentiment indicators and then aggregate the existing information into a single composite index. We standardise all the variables (i.e., mean zero and variance one) to ensure that PCA analysis is not affected by the scale of units and the size of each measure. Following Huynh et al. (Citation2021), we also change the Coronavirus Sentiment Index sign to ensure that all measures affect the index in the same direction. For the FSI construction, we select the first component, which explains about 80.3%, 63.9%, and 68.6% of the total variance for Chinese, the U.S., and World markets, respectively. Intuitively, high FSI values imply high levels of fear which have implications for financial uncertainty. According to Huynh et al. (Citation2021), the aggregate FSI measure is likely to reflect investor sentiment better than any single measure. This is the reason why the more recent empirical research study by Huynh et al. (Citation2021) recommends using this global measure of investor sentiment.
Table 11. Data description of behavioural indicators.
Table 12. Summary statistics of FSI.
Before applying any Granger causality-type test, we should ensure the stationarity of each FSI. To do so, we use the first difference for each FSI, i.e., reports the summary statistics of FSI for China, the U.S., and the World. The mean FSI change is positive for China, suggesting an overall average rise in feverish sentiment. However, the mean FSI change is found to be negative for the U.S., and World, revealing a global average decrease in feverish sentiment. The standard deviation shows that the U.S. recorded the highest variability in feverishness, while China has the least standard deviation, indicating the comparative stability and resilience of the Chinese economy. The outcomes of the augmented Dickey-Fuller (ADF) unit root test indicate that all FSI series are found to be stationary at the first level, and thus they can be further used for causality analysis.
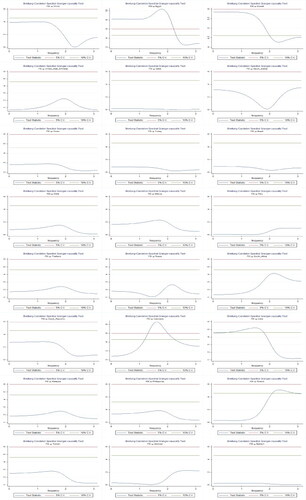
Thereafter, we apply the frequency-domain Granger causality test (henceforth FDGC), suggested by Breitung and Candelon (Citation2006), to examine if investor sentiment has any causal impact on emerging Islamic equity index returns. The standard Granger causality (henceforth GC) test (Granger, Citation2008) has been extensively used in the literature to examine whether one variable is useful in predicting another. However, the major problem of this test is that it does not inform us at what frequency one variable may Granger cause the other. This limitation was avoided by introducing the FDGC test, which enables us to infer whether one variable has a causal effect on another variable and at what frequency. Therefore, we examine if a change in investor sentiment can predict the emerging Islamic equity index returns in different frequencies. We conduct two estimations: one for the COVID-19 phase 1 and the other for the COVID-19 phase 2. The aggregate FSI measure of China is used to examine the causal impacts of investor sentiment on the emerging Islamic equity index returns during the COVID-19 phase 1. Alternatively, the aggregate FSI indicators of both U.S. and the World examine the causal effects of investor sentiment on the emerging Islamic equity index returns during the COVID-19 phase 2.
We first analyse the results of the GC test, which is conducted within the context of bivariate VAR models. The lag length for the VAR model is selected by the Akaike Information Criterion (AIC). The results of the GC test are reported in . During the COVID-19 phase 1, we detect six significant unilateral causalities running from FSI to the MSCI equity index returns of Egypt, Mexico, Russia, Czech Republic, Indonesia, and Poland. We also observe three unidirectional causalities running from the FSI to the MSCI equity index returns of Egypt, Indonesia, and India during the COVID-19 phase 2 at the comfortable significance levels. In other words, investor sentiment seems to lead these Islamic equity markets in the information process during the two phases of the COVID-19 pandemic.
Table 13. Test results of GC and FDGC from the percentage change in FSI to MSCI emerging Islamic equity index returns.
While the GC test provides a summary measure of the average relations between the underlying variables, the FDGC approach enables us to decompose the causality test statistic into different frequencies. The frequency parameter is used to calculate the length of the sample period
measured in days, which corresponds to a cycle where
In the current paper, we decompose the causality into the short-run (transitory), medium-run, and long-run (permanent) components. Short-term relations correspond to higher frequency components of the spectra, while long-term dynamic linkages are captured by lower frequency components or trend relations. Therefore, if there is a long-term dynamic relationship between investor sentiment and emerging Islamic equity index returns, omitted by the conventional GC test, it is likely to be detected in this analysis. In other words, let’s consider the possible case of investor sentiment affecting an MSCI equity index return series in the long run, while in the short run the MSCI equity return series was independent of investor sentiment. In this case, we would expect a difference between short- and long-run causality tests from investor sentiment to emerging Islamic MSCI equity return series, with long-run causality tests being statistically significant. In the current study, the short-run causality tests are conducted at frequency
which corresponds to a periodicity or wavelength of 2 to 3 trading days. These represent the shocks that tend to have a transitory impact. Alternatively, the long-run causality tests are conducted at a frequency of
which corresponds to a periodicity of 12 to 13 trading days. These can stand for low-frequency or permanent shocks with lasting effects. Lastly, the medium-run causality tests are performed at a frequency of
which corresponds to a periodicity of 4 to 5 trading days.
Regarding the COVID-19 phase 1, we calculate the short-, medium- and long-run causality tests. The corresponding outcomes are reported in the fourth, fifth, and sixth columns of Panel A in . The results seem to be a bit different from the GC test. There are three cases of unidirectional causality from FSI to MSCI equity index returns in all three runs (long, medium, and short) for Egypt, Russia, and Poland. Moreover, the results confirm a significant unidirectional causality from FSI to MSCI equity index returns of Indonesia in both the medium- and long-run. In addition, a further significant unidirectional causality is captured for Turkey in the short run. During the COVID-19 phase 2, the results of the FDGC test are found to be different from those given by the standard GC test. The findings, displayed in both Panel B and Panel C in , show evidence of two significant causalities from FSI to MSCI equity index returns of Egypt and Brazil in both the medium- and long-run. The results also highlight three significant unidirectional causalities in the medium-run (Indonesia, India, and the Philippines) and one unidirectional causality in the short-run (Poland). These findings indicate that examining the long-, medium- and short-term causalities separately does change the conclusion that shocks from the FSI are relevant for emerging Islamic MSCI equity index returns movements.
In , displayed in Appendix A, we further present the low, medium, and high-frequency plots evolution in causality for a range of frequencies against 5% and 10% significance levels. The null hypothesis of no Granger causality is rejected if the test statistic curve exceeds the significance line at the 5% or 10% level. In particular, it is noteworthy that the results are not similar for both short- and long-run causality tests. As argued above, if FSI was a long-run determinant of MSCI equity index returns, even if not in the short-run, we should detect significant differences between the high and low-frequency test statistics. This reinforces the need for uncovering short- and long-run causality. Therefore, there is evidence to support this argument and overall, shocks from investor sentiment appear to influence some emerging Islamic equity markets.
Overall, our results are unique and document a significant relationship between investor sentiment and the returns series of some emerging Islamic equity markets during the two phases of the COVID-19 pandemic. Interestingly, we show that the predictive power of investor sentiment increases during the COVID-19 phase 2. As argued by K. Hassan et al. (Citation2023), Islamic indices are not assumed to respond to the investor sentiment index built from variables originating from conventional equities since they are claimed to be Shari’ah-compliant. Nevertheless, these Islamic equities may not be intrinsically Islamic and therefore are not immune to shocks coming from conventional equity markets.
Our sample includes both Muslim countries (Egypt, Kuwait, United Arab Emirates, Qatar, Saudi Arabia, Oman, Turkey, Indonesia, Malaysia, Morocco, and Bahrain) where the Muslim population exceeds 60% as well as non-Muslim countries (China, Brazil, Chile, Mexico, Peru, Thailand, Russia, South Africa, Czech Republic, India, Philippines, Poland, and Taiwan) where the percentage of Muslims is low. This may lead to the view that Islamic equity indices of the Muslim countries may behave differently from their Islamic counterparts in non-Muslim countries (Jaballah et al., Citation2018). However, the results of both asymmetric and extremal dependence tests of contagion do not disclose any systematic differences. Similarly, the FDGC analysis from the percentage change in FSI to the Islamic index returns does not uncover any significant differences.
6. Conclusion
The main objective of the current study was to analyse emerging Islamic equity market reactions to the COVID-19 events. We examined both linear and nonlinear channels of contagion using a range of statistical tests based on changes in correlations and higher-order comoments. This study covered the period from 31 December 2018 to 20 August 2020, while considering two phases of the COVID-19 crisis. In addition, Chinese, U.S., and World conventional equity markets were selected as potential sources of contagion, while 24 emerging Islamic equity markets were chosen as recipients of contagion. Moreover, we considered two phases of the COVID-19 crisis. Our results contribute to the empirical literature due to the adopted methodological approach. They provide several insights into the impact of the COVID-19 pandemic on emerging Islamic equity markets. During COVID-19 phase 1, investors were unsure about the risk of COVID-19 turning into a pandemic and seemed to focus primarily on downside risks. However, on 11 March 2020, WHO declared COVID-19 a pandemic as the coronavirus rapidly spreads across the world. As a consequence, the public health responses needed to tackle the transmission of this virus have significantly affected global economic activity. This critical situation has eliminated the uncertainty surrounding the possibility of a pandemic and caused a coordinated sell-off across global equity markets, as many investors pulled out of equities in favour of safer asset classes. Such coordination between equity markets is consistent with the increasing evidence of contagion during COVID-19 Phase 2. Interestingly, we find more significant channels of contagion from both the U.S. and World conventional equity markets to the emerging Islamic equity markets during phase 2, in particular through the higher-order comoment channels. This finding implies that emerging Islamic equity markets fail to provide immunity against the COVID-19 pandemic.
Due to the unique characteristics of Islamic equities, it should be expected that they provide insurance against adverse market conditions or extreme events. For purely Islamic investors, it should be expected that the investor sentiment created from diverse investor profiles would not affect the performance of Islamic equities. However, the behaviour of Islamic equities could parallel conventional equities. A possible explanation of this is that those equities are not original Islamic instruments ‘Musharakah’ but instead replicas.
In this paper, we further focused on the causal nexus between investor sentiment, which is not based on Islamic principles, and emerging Islamic equity index returns by using a new approach in the form of a comprehensive Feverish Sentiment Index, which includes a wide range of behavioural factors such as panic, media hype, fake news, sentiment, infodemic, and media coverage. Using traditional and frequency-domain Granger causality tests, we found that investor sentiment can predict the emerging Islamic equity index returns during the two COVID-19 phases. Interestingly, the predictive power of investor sentiment increases more in phase 2, suggesting that the higher such sentiment, the lower equity index returns. Otherwise, combining replica equities with heterogeneous investors provides a rationale for Islamic equities that offer no real protection against the COVID-19 pandemic.
The strong evidence of contagion among emerging Islamic equity markets in both phases indicates that policymakers were right to be concerned about the risks posed by equity market turmoil in the wake of the COVID-19 pandemic announcement. The extent of this concern was shown by the excessive interventions made by many global central banks. The primary objective of these interventions was to prevent illiquidity and thus maintain financial stability. During crises and unusual circumstances, some unconventional monetary policies may be applied. Unconventional measures are seen as an attempt to reduce differences between different forms of external financing, which affects the prices of assets and the flow of money in the economy. Therefore, these policies may have unintended consequences for capital flows, asset price inflation and wealth distribution, etc. These unintended effects deserve further study. Similarly, the potential existence of previously unpriced pandemic risk factors raises urgent questions for portfolio management and hedging strategies. Accordingly, these areas should be a priority for economic policy and financial regulation moving forward.
Acknowledgement
The authors would like to thank the editor and anonymous referees for their valuable comments that greatly improved our paper.
Disclosure statement
No potential conflict of interest was reported by the author(s).
Notes
2 Generally, three prominent measures of investor sentiment have been proposed in financial literature: market-based proxies (Baker & Wurgler, Citation2006, Citation2007) , search-based approach (Da et al., Citation2011, Citation2015; Joseph et al., Citation2011; Solanki & Seetharam, Citation2018; Yuan et al., Citation2022), and survey approach (Batrancea, Citation2021a ; Brown & Cliff, Citation2005; Perez-Liston et al., Citation2016).
3 For an extensive review of the literature of financial contagion, see Dornbusch et al. (Citation2000), Pericoli and Sbracia (Citation2003), Dungey et al. (Citation2005), and Forbes (Citation2012).
4 The MSCI Global Islamic equity Indices were launched in July 2007. They reflect Sharia investment principles while retaining replicability for international investors. They are constructed from the underlying MSCI country indices and cover over 70 of MSCI's developed, emerging, and frontier market countries. The set of the 24 emerging Islamic countries includes China, Egypt, Kuwait, United Arab Emirates, Qatar, Saudi Arabia, Oman, Turkey, Brazil, Chile, Mexico, Peru, Thailand, Russia, South Africa, Czech Republic, Indonesia, India, Malaysia, Philippines, Poland, Taiwan, Morocco, and Bahrain.
6 This statistical test has three alternative hypotheses against the null hypothesis: (i) (ii)
and (iii)
where
and
denote the mean returns during the pre-COVID-19 phase, and COVID-19 phase 1, respectively.
7 ‘Musharakah’ instruments are loss-and-profit sharing and are similar to equity, where equity holders generally have more risk than debtholders. According to Shariah standards, the ‘Musharakah’ profit rate can be negotiated, but the loss rate must be in proportion to the investment (Athari, Citation2022; Athari et al., Citation2016; Azmat et al., Citation2016).
8 According to Baker and Wurgler (Citation2007), investor sentiment refers to the ‘belief about future cash flows and investment risks that is not justified by the facts in hand’.
9 The descriptive statistics of the behavioural indices are available upon request.
10 They are listed as the G20’s largest countries and include the U.S., Germany, France, Italy, Spain, the UK, China, South Africa, Australia, Japan, India, Russia, South Korea, Turkey, Argentina, Brazil, and Indonesia.
11 https://coronavirus. ravenpack.com.
12 The results of the PCA are available upon request.
References
- Abu-Alkheil, A., Khan, W. A., Parikh, B., & Mohanty, S. K. (2017). Dynamic co-integration and portfolio diversification of Islamic and conventional indices: Global evidence. Quarterly Review of Economics and Finance, 66, 212–224. https://doi.org/10.1016/j.qref.2017.02.005
- Aggarwal, S., Nawn, S., & Dugar, A. (2021). What caused global stock market meltdown during the COVID pandemic–Lockdown stringency or investor panic? Finance Research Letters, 38, 101827. https://doi.org/10.1016/j.frl.2020.101827
- Ahmad, W., Rais, S., & Shaik, A. R. (2018). Modelling the directional spillovers from DJIM Index to conventional benchmarks: Different this time? The Quarterly Review of Economics and Finance, 67, 14–27. https://doi.org/10.1016/j.qref.2017.04.012
- Ajmi, A. N., Hammoudeh, S., Nguyen, D. K., & Sarafrazi, S. (2014). How strong are the causal relationships between Islamic stock markets and conventional financial systems? Evidence from linear and nonlinear tests. Journal of International Financial Markets, Institutions and Money, 28(1), 213–227. https://doi.org/10.1016/j.intfin.2013.11.004
- Akhtaruzzaman, M., Boubaker, S., & Sensoy, A. (2021). Financial contagion during COVID–19 crisis. Finance Research Letters, 38, 101604. https://doi.org/10.1016/j.frl.2020.101604
- Aloui, C., Hkiri, B., Lau, C. K. M., & Yarovaya, L. (2016). Investors’ sentiment and US Islamic and conventional indexes nexus: A time–frequency analysis. Finance Research Letters, 19, 54–59. https://doi.org/10.1016/j.frl.2016.06.002
- Alqaralleh, H., & Canepa, A. (2021). Evidence of stock market contagion during the COVID-19 pandemic: A wavelet-copula-GARCH approach. Journal of Risk and Financial Management, 14(7), 329. https://doi.org/10.3390/jrfm14070329
- Al-Yahyaee, K. H., Mensi, W., Rehman, M. U., Vo, X. V., & Kang, S. H. (2020). Do Islamic stocks outperform conventional stock sectors during normal and crisis periods? Extreme co-movements and portfolio management analysis. Pacific-Basin Finance Journal, 62, 101385. https://doi.org/10.1016/j.pacfin.2020.101385
- Ashraf, D., Rizwan, M. S., & Ahmad, G. (2022). Islamic equity investments and the COVID-19 pandemic. Pacific-Basin Finance Journal, 73(June 2021), 101765. https://doi.org/10.1016/j.pacfin.2022.101765
- Asif Khan, M., Ahmad, R., Azmi, A., & Akbar, M. (2019). A new sentiment index for the Islamic stock market. Investment Analysts Journal, 48(2), 146–172. https://doi.org/10.1080/10293523.2019.1643968
- Athari, S. A. (2022). Examining the impacts of environmental characteristics on shariah-based bank’s capital holdings: Role of country risk and governance quality. The Economics and Finance Letters, 9(1), 99–109. https://doi.org/10.18488/29.v9i1.3043
- Athari, S. A., Adaoglu, C., & Bektas, E. (2016). Investor protection and dividend policy: The case of Islamic and conventional banks. Emerging Markets Review, 27, 100–117. https://doi.org/10.1016/j.ememar.2016.04.001
- Athari, S. A., & Hung, N. T. (2022). Time–frequency return co-movement among asset classes around the COVID-19 outbreak: Portfolio implications. Journal of Economics and Finance, 46(4), 736–756. https://doi.org/10.1007/s12197-022-09594-8
- Athari, S. A., Kirikkaleli, D., & Adebayo, T. S. (2023). World pandemic uncertainty and German stock market: Evidence from Markov regime-switching and Fourier based approaches. Quality & Quantity, 57(2), 1923–1936. https://doi.org/10.1007/s11135-022-01435-4
- Azmat, S., Jalil, M. N., Skully, M., & Brown, K. (2016). Investor’s choice of Shariah compliant ‘replicas’ and original Islamic instruments. Journal of Economic Behavior & Organization, 132, 4–22. https://doi.org/10.1016/j.jebo.2016.07.018
- Baker, M., & Wurgler, J. (2006). Investor sentiment and the cross-section of stock returns. The Journal of Finance, 61(4), 1645–1680. https://doi.org/10.1111/j.1540-6261.2006.00885.x
- Baker, M., & Wurgler, J. (2007). Investor sentiment in the stock market. Journal of Economic Perspectives, 21(2), 129–151. https://doi.org/10.1257/jep.21.2.129
- Bannigidadmath, D., & Narayan, P. K. (2016). Stock return predictability and determinants of predictability and profits. Emerging Markets Review, 26, 153–173. https://doi.org/10.1016/j.ememar.2015.12.003
- Batrancea, L. (2021a). Empirical evidence regarding the impact of economic growth and inflation on economic sentiment and household consumption. Journal of Risk and Financial Management, 14(7), 336. https://doi.org/10.3390/jrfm14070336
- Batrancea, L. (2021b). The influence of liquidity and solvency on performance within the healthcare industry: Evidence from publicly listed companies. Mathematics, 9(18), 2231. https://doi.org/10.3390/math9182231
- Bello, J., Guo, J., & Newaz, M. K. (2022). Financial contagion effects of major crises in African stock markets. International Review of Financial Analysis, 82(March), 102128. https://doi.org/10.1016/j.irfa.2022.102128
- Breitung, J., & Candelon, B. (2006). Testing for short- and long-run causality: A frequency-domain approach. Journal of Econometrics, 132(2), 363–378. https://doi.org/10.1016/j.jeconom.2005.02.004
- Brown, G. W., & Cliff, M. T. (2005). Investor sentiment and asset valuation. The Journal of Business, 78(2), 405–440. https://doi.org/10.1086/427633
- Brunnermeier, M. K., & Pedersen, L. H. (2009). Market liquidity and funding liquidity. Review of Financial Studies, 22(6), 2201–2238. https://doi.org/10.1093/rfs/hhn098
- Cepoi, C. O. (2020). Asymmetric dependence between stock market returns and news during COVID-19 financial turmoil. Finance Research Letters, 36(June), 101658. https://doi.org/10.1016/j.frl.2020.101658
- Chiang, T. C., Jeon, B. N., & Li, H. (2007). Dynamic correlation analysis of financial contagion: Evidence from Asian markets. Journal of International Money and Finance, 26(7), 1206–1228. https://doi.org/10.1016/j.jimonfin.2007.06.005
- Chopra, M., & Mehta, C. (2022). Is the COVID-19 pandemic more contagious for the Asian stock markets? A comparison with the Asian financial, the US subprime and the Eurozone debt crisis. Journal of Asian Economics, 79(June 2021), 101450. https://doi.org/10.1016/j.asieco.2022.101450
- Da, Z., Engelberg, J., & Gao, P. (2011). In search of attention. The Journal of Finance, 66(5), 1461–1499. https://doi.org/10.1111/j.1540-6261.2011.01679.x
- Da, Z., Engelberg, J., & Gao, P. (2015). The sum of all FEARS investor sentiment and asset prices. Review of Financial Studies, 28(1), 1–32. https://doi.org/10.1093/rfs/hhu072
- Dash, S. R., & Maitra, D. (2018a). Does sentiment matter for stock returns? Evidence from Indian stock market using wavelet approach. Finance Research Letters, 26, 32–39. https://doi.org/10.1016/j.frl.2017.11.008
- Dash, S. R., & Maitra, D. (2018b). Does Shariah index hedge against sentiment risk? Evidence from Indian stock market using time–frequency domain approach. Journal of Behavioral and Experimental Finance, 19, 20–35. https://doi.org/10.1016/j.jbef.2018.03.003
- Dewandaru, G., Rizvi, S. A. R., Masih, R., Masih, M., & Alhabshi, S. O. (2014). Stock market co-movements: Islamic versus conventional equity indices with multi-timescales analysis. Economic Systems, 38(4), 553–571. https://doi.org/10.1016/j.ecosys.2014.05.003
- Dornbusch, R., Park, Y. C., & Claessens, S. (2000). Contagion: Understanding How It Spreads. The World Bank Research Observer, 15(2), 177–197.
- Dungey, M., Fry, R., González-Hermosillo, B., & Martin, V. L. (2005). Empirical modelling of contagion: A review of methodologies. Quantitative Finance, 5(1), 9–24. https://doi.org/10.1080/14697680500142045
- Fang, H., & Lai, T. Y. (1997). Co-kurtosis and capital asset pricing. The Financial Review, 32(2), 293–307. https://doi.org/10.1111/j.1540-6288.1997.tb00426.x
- Forbes, K. J., & Rigobon, R. (2002). No contagion, only interdependence: Measuring stock market comovements. The Journal of Finance, 57(5), 2223–2261. https://doi.org/10.1111/0022-1082.00494
- Forbes, K. (2012). The “Big C”: Identifying Contagion. NBER working paper, 18465. https://doi.org/10.3386/w18465
- Fry-McKibbin, R., Greenwood-Nimmo, M., Hsiao, C. Y. L., & Qi, L. (2022). Higher-order comoment contagion among G20 equity markets during the COVID-19 pandemic. Finance Research Letters, 45(February 2021), 102150. https://doi.org/10.1016/j.frl.2021.102150
- Fry-McKibbin, R., & Hsiao, C. Y. L. (2018). Extremal dependence tests for contagion. Econometric Reviews, 37(6), 626–649. https://doi.org/10.1080/07474938.2015.1122270
- Fry-McKibbin, R., Hsiao, C. Y. L., & Martin, V. L. (2019). Joint tests of contagion with applications. Quantitative Finance, 19(3), 473–490. https://doi.org/10.1080/14697688.2018.1475747
- Fry, R., Martin, V. L., & Tang, C. (2010). A new class of tests of contagion with applications. Journal of Business & Economic Statistics, 28(3), 423–437. https://doi.org/10.1198/jbes.2010.06060
- Ftiti, Z., & Hadhri, S. (2019). Can economic policy uncertainty, oil prices, and investor sentiment predict Islamic stock returns? A multi-scale perspective. Pacific-Basin Finance Journal, 53(September 2018), 40–55. https://doi.org/10.1016/j.pacfin.2018.09.005
- Fu, S., Liu, C., & Wei, X. (2021). Contagion in global stock markets during the COVID‐19 crisis. Global Challenges, 5(10), 2000130. https://doi.org/10.1002/gch2.202000130
- Granger, C. W. J. (2008). Investigating causal relations by econometric models and cross-spectral methods. Essays in Econometrics Vol II: Collected Papers of Clive W. J. Granger, 37(3), 31–47. https://doi.org/10.1017/ccol052179207x.002
- Guo, Y., Li, P., & Li, A. (2021). Tail risk contagion between international financial markets during COVID-19 pandemic. International Review of Financial Analysis, 73, 101649. https://doi.org/10.1016/j.irfa.2020.101649
- Hafner, C. M., & Herwartz, H. (2006). A Lagrange multiplier test for causality in variance. Economics Letters, 93(1), 137–141. https://doi.org/10.1016/j.econlet.2006.04.008
- Hammoudeh, S., Mensi, W., Reboredo, J. C., & Nguyen, D. K. (2014). Dynamic dependence of the global Islamic equity index with global conventional equity market indices and risk factors. Pacific-Basin Finance Journal, 30, 189–206. https://doi.org/10.1016/j.pacfin.2014.10.001
- Haroon, O., & Rizvi, S. A. R. (2020). COVID-19: Media coverage and financial markets behavior—A sectoral inquiry. Journal of Behavioral and Experimental Finance, 27, 100343. https://doi.org/10.1016/j.jbef.2020.100343
- Harvey, C. R., & Siddique, A. (2000). Conditional skewness in asset pricing tests. The Journal of Finance, 55(3), 1263–1295. https://doi.org/10.1111/0022-1082.00247
- Hasan, M. B., Mahi, M., Hassan, M. K., & Bhuiyan, A. B. (2021). Impact of COVID-19 pandemic on stock markets: Conventional vs. Islamic indices using wavelet-based multi-timescales analysis. The North American Journal of Economics and Finance, 58(June), 101504. https://doi.org/10.1016/j.najef.2021.101504
- Hassan, K., Hoque, A., Gasbarro, D., & Wong, W. K. (2023). Are Islamic stocks immune from financial crises? Evidence from contagion tests. International Review of Economics & Finance, 86, 919–948. https://doi.org/10.1016/j.iref.2020.08.004
- Hassan, M. K., Aliyu, S., Saiti, B., & Abdul Halim, Z. (2021). A review of Islamic stock market, growth and real-estate finance literature. International Journal of Emerging Markets, 16(7), 1259–1290. https://doi.org/10.1108/IJOEM-11-2019-1001
- Hkiri, B., Hammoudeh, S., Aloui, C., & Yarovaya, L. (2017). Are Islamic indexes a safe haven for investors? An analysis of total, directional and net volatility spillovers between conventional and Islamic indexes and importance of crisis periods. Pacific-Basin Finance Journal, 43, 124–150. https://doi.org/10.1016/j.pacfin.2017.03.001
- Hoffmann, A. O. I., Post, T., & Pennings, J. M. E. (2013). Individual investor perceptions and behavior during the financial crisis. Journal of Banking & Finance, 37(1), 60–74. https://doi.org/10.1016/j.jbankfin.2012.08.007
- Hoffmann, A. O. I., Post, T., & Pennings, J. M. E. (2015). How investor perceptions drive actual trading and risk-taking behavior. Journal of Behavioral Finance, 16(1), 94–103. https://doi.org/10.1080/15427560.2015.1000332
- Hon, M. T., Strauss, J., & Yong, S. K. (2004). Contagion in financial markets after September 11: Myth or reality? Journal of Financial Research, 27(1), 95–114. https://doi.org/10.1111/j.1475-6803.2004.00079.x
- Huynh, T. L. D., Foglia, M., Nasir, M. A., & Angelini, E. (2021). Feverish sentiment and global equity markets during the COVID-19 pandemic. Journal of Economic Behavior & Organization, 188, 1088–1108. https://doi.org/10.1016/j.jebo.2021.06.016
- ICD-REFINITIV Islamic Finance Development Report. 2020. Progressing through adversity. https://icdps.org/uploads/files/ICD-Refinitiv%20IFDI%20Report%2020201607502893_2100.pdf
- Jaballah, J., Peillex, J., & Weill, L. (2018). Is being Sharia compliant worth it? Economic Modelling, 72(April 2017), 353–362. https://doi.org/10.1016/j.econmod.2018.02.011
- Joseph, K., Babajide Wintoki, M., & Zhang, Z. (2011). Forecasting abnormal stock returns and trading volume using investor sentiment: Evidence from online search. International Journal of Forecasting, 27(4), 1116–1127. https://doi.org/10.1016/j.ijforecast.2010.11.001
- Kenourgios, D., Naifar, N., & Dimitriou, D. (2016). Islamic financial markets and global crises: Contagion or decoupling? Economic Modelling, 57, 36–46. https://doi.org/10.1016/j.econmod.2016.04.014
- Kraus, A., & Litzenberger, R. (1976). Skewness preference and the valuation of risk assets. Journal of Finance, 31(4), 1085–1100.
- Kostakis, A., Muhammad, K., & Siganos, A. (2012). Higher co-moments and asset pricing on London Stock Exchange. Journal of Banking & Finance, 36(3), 913–922. https://doi.org/10.1016/j.jbankfin.2011.10.002
- Lin, W.-L., Engle, R. F., & Ito, T. (1994). Do Bulls and Bears Move Across Borders? International Transmission of Stock Returns and Volatility. The Review of Financial Studies, 7(3), 507–538.
- Majdoub, J., & Mansour, W. (2014). Islamic equity market integration and volatility spillover between emerging and US stock markets. The North American Journal of Economics and Finance, 29, 452–470. https://doi.org/10.1016/j.najef.2014.06.011
- Merdad, H. J., Kabir Hassan, M., & Hippler, W. J. (2015). The Islamic risk factor in expected stock returns: An empirical study in Saudi Arabia. Pacific-Basin Finance Journal, 34, 293–314. https://doi.org/10.1016/j.pacfin.2015.04.001
- Miller, E. M. (1977). Risk, uncertainty, and divergence of opinion. The Journal of Finance, 32(4), 1151–1168. https://doi.org/10.1111/j.1540-6261.1977.tb03317.x
- Mollah, S., Quoreshi, A. M. M. S., & Zafirov, G. (2016). Equity market contagion during global financial and Eurozone crises: Evidence from a dynamic correlation analysis. Journal of International Financial Markets, Institutions and Money, 41, 151–167. https://doi.org/10.1016/j.intfin.2015.12.010
- Muteba Mwamba, J. W., Hammoudeh, S., & Gupta, R. (2017). Financial tail risks in conventional and Islamic stock markets: A comparative analysis. Pacific-Basin Finance Journal, 42, 60–82. https://doi.org/10.1016/j.pacfin.2016.01.003
- Narayan, P. K., & Bannigidadmath, D. (2017). Does financial news predict stock returns? New evidence from Islamic and non-Islamic stocks. Pacific-Basin Finance Journal, 42, 24–45. https://doi.org/10.1016/j.pacfin.2015.12.009
- Nazlioglu, S., Hammoudeh, S., & Gupta, R. (2015). Volatility transmission between Islamic and conventional equity markets: Evidence from causality-in-variance test. Applied Economics, 47(46), 1–16. https://doi.org/10.1080/00036846.2015.1039705
- Nguyen, T. N., Phan, T. K. H., & Nguyen, T. L. (2022). Financial contagion during global financial crisis and Covid–19 pandemic: The evidence from DCC–GARCH model. Cogent Economics & Finance, 10(1), 1–20. https://doi.org/10.1080/23322039.2022.2051824
- Okorie, D. I., & Lin, B. (2021). Stock markets and the COVID-19 fractal contagion effects. Finance Research Letters, 38(April 2020), 101640. https://doi.org/10.1016/j.frl.2020.101640
- Peillex, J., Erragragui, E., Bitar, M., & Benlemlih, M. (2019). The contribution of market movements, asset allocation and active management to Islamic equity funds’ performance. The Quarterly Review of Economics and Finance, 74, 32–38. https://doi.org/10.1016/j.qref.2018.03.013
- Perez-Liston, D., Huerta, D., & Haq, S. (2016). Does investor sentiment impact the returns and volatility of Islamic equities? Journal of Economics and Finance, 40(3), 421–437. https://doi.org/10.1007/s12197-014-9290-6
- Pericoli, M., & Sbracia, M. (2003). A primer on financial contagion. Journal of Economic Surveys, 17(4), 571–608. https://doi.org/10.1111/1467-6419.00205
- Potì, V., & Wang, D. L. (2010). The coskewness puzzle. Journal of Banking & Finance, 34(8), 1827–1838. https://doi.org/10.1016/j.jbankfin.2009.12.003
- Rahman, M. L., Hedström, A., Uddin, G. S., & Kang, S. H. (2021). Quantile relationship between Islamic and non-Islamic equity markets. Pacific-Basin Finance Journal, 68(August 2020), 101586. https://doi.org/10.1016/j.pacfin.2021.101586
- Rizvi, S. A. R., Arshad, S., & Alam, N. (2015). Crises and contagion in Asia Pacific - Islamic v/s conventional markets. Pacific-Basin Finance Journal, 34, 315–326. https://doi.org/10.1016/j.pacfin.2015.04.002
- Rognone, L., Hyde, S., & Zhang, S. S. (2020). News sentiment in the cryptocurrency market: An empirical comparison with Forex. International Review of Financial Analysis, 69, 101462. https://doi.org/10.1016/j.irfa.2020.101462
- Roy, S., & Kemme, D. M. (2020). The run-up to the global financial crisis: A longer historical view of financial liberalization, capital inflows, and asset bubbles. International Review of Financial Analysis, 69(July 2019), 101377. https://doi.org/10.1016/j.irfa.2019.101377
- Salisu, A. A., & Shaik, M. (2022). Islamic stock indices and COVID-19 pandemic. International Review of Economics & Finance, 80(March), 282–293. https://doi.org/10.1016/j.iref.2022.02.073
- Scott, R. C., & Horvath, P. A. (1980). On the direction of preference for moments of higher order than the variance. The Journal of Finance, 35(4), 915–919. https://doi.org/10.1111/j.1540-6261.1980.tb03509.x
- Sensoy, A. (2016). Systematic risk in conventional and Islamic equity markets. International Review of Finance, 16, 457–466.
- Shahzad, S. J. H., Ferrer, R., Ballester, L., & Umar, Z. (2017). Risk transmission between Islamic and conventional stock markets: A return and volatility spillover analysis. International Review of Financial Analysis, 52, 9–26. https://doi.org/10.1016/j.irfa.2017.04.005
- Shahzad, S. J. H., & Naifar, N. (2022). Dependence dynamics of Islamic and conventional equity sectors: What do we learn from the decoupling hypothesis and COVID-19 pandemic? The North American Journal of Economics and Finance, 59(September 2021), 101635. https://doi.org/10.1016/j.najef.2021.101635
- Shleifer, A., & Vishny, R. W. (1997). The limits of arbitrage. The Journal of Finance, 52(1), 35. https://doi.org/10.2307/2329555
- Smales, L. A. (2014). News sentiment and the investor fear gauge. Finance Research Letters, 11(2), 122–130. https://doi.org/10.1016/j.frl.2013.07.003
- Smith, D. R. (2007). Conditional coskewness and asset pricing. Journal of Empirical Finance, 14(1), 91–119. https://doi.org/10.1016/j.jempfin.2006.04.004
- Solanki, K., & Seetharam, Y. (2018). Is investor sentiment a relevant factor in determining asset prices? Investment Analysts Journal, 47(3), 243–257. https://doi.org/10.1080/10293523.2018.1497250
- Sortino, F. A., & Price, L. N. (1994). Performance measurement in a downside risk framework. The Journal of Investing, 3(3), 59–64. https://doi.org/10.3905/joi.3.3.59
- Trichilli, Y., Abdelhédi, M., & Boujelbène Abbes, M. (2018). Googling investor’s sentiment: powerful measure in conventional and Islamic MENA financial markets. International Economic Journal, 32(3), 454–469. https://doi.org/10.1080/10168737.2018.1522055
- Wang, G. J., Xie, C., Lin, M., & Stanley, H. E. (2017). Stock market contagion during the global financial crisis: A multiscale approach. Finance Research Letters, 22, 163–168. https://doi.org/10.1016/j.frl.2016.12.025
- Yuan, Y., Wang, H., & Jin, X. (2022). Pandemic-driven financial contagion and investor behavior: Evidence from the COVID-19. International Review of Financial Analysis, 83(January), 102315. https://doi.org/10.1016/j.irfa.2022.102315
Appendix A
Figure A1. Breitung-Candelon Spectral Ganger causality test during the COVID-19 phase 1 ( China). Source: Authors’ calculations.
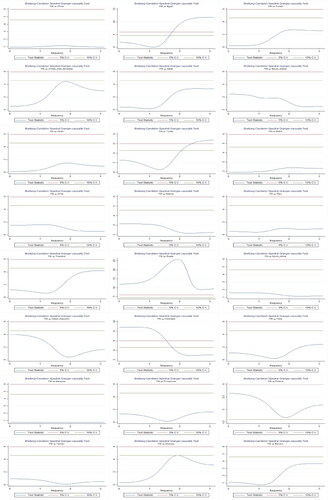
Figure A2. Breitung-Candelon Spectral Ganger causality test during the COVID-19 phase 2 ( U.S.). Source: Authors’ calculations.
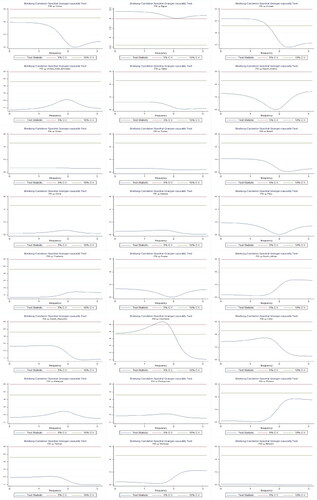
Figure A3. Breitung-Candelon Spectral Ganger causality test during the COVID-19 phase 2 ( WORLD). Source: Authors’ calculations.