 ?Mathematical formulae have been encoded as MathML and are displayed in this HTML version using MathJax in order to improve their display. Uncheck the box to turn MathJax off. This feature requires Javascript. Click on a formula to zoom.
ABSTRACT
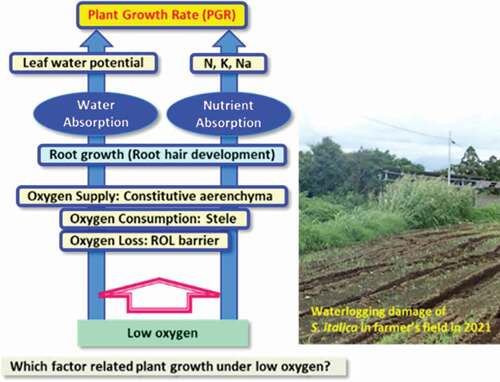
The purpose was to elucidate the hypoxia tolerance mechanism of millet species by focusing on the oxygen acquisition mechanism of adventitious roots. Brachiaria ramosa, Echinochloa utilis, Eragrostis tef, and Setaria italica were used. Thirty-day old plants were hydroponically cultivated for 28 days as the control, where aeration was continued and a hypoxia treatment was applied, where nitrogen gas was flushed to reduce the oxygen concentration. From the stress susceptibility index based on plant growth rate, it was clarified that E. utilis and E. tef had higher hypoxia tolerance than B. ramosa and S. italica. Root growth rate, nitrogen concentration of leaves and stems, and sodium concentration per plant of the higher hypoxia-tolerant species did not change with hypoxia treatment. In hypoxia-susceptible millet species, the root growth rate and nitrogen concentration in the leaf and stem decreased, and the sodium concentration in the whole plant increased. The proportion of the stele area of the adventitious root of the hypoxia-tolerant millet species was smaller than that of the hypoxia-susceptible millet species, and the lysigenous aerenchyma was constitutively developed. Furthermore, root hairs were observed near the root tip in the hypoxia-tolerant millet species. In conclusion, we deduced that the hypoxia tolerance of the millet species is mainly attributable to the supply of oxygen to the root tip via the lysigenous aerenchyma along the adventitious root. Lower oxygen consumption by a smaller proportion of the stele area might be an important genetic trait. Furthermore, root hair may contribute to nutrient absorption.
Graphical Abstract
Introduction
Climate change associated with global warming is expected to increase the risk of flooding in various parts of the world, including Central Africa and Southeast Asia (Hirabayashi et al., Citation2013; Kaur et al., Citation2019). Field crops are generally susceptible to excess moisture, reducing agricultural production worldwide (Bailey-Serres et al., Citation2012; Perata et al., Citation2011), and the introduction and breeding of crops tolerant to waterlogging is an urgent issue (Pedersen et al., Citation2017). Understanding how waterlogging-tolerant plants maintain their growth and survive excess moisture is the key to selecting or improving crop varieties that tolerate waterlogging (Sasidharan et al., Citation2021).
Flooding is defined as a condition in which pores in the soil are filled with water, and gas diffusion is restricted (Setter & Waters, Citation2003). The flux of oxygen into soils is 320,000 times less when soil pores are filled with water than when they are gas-filled (Armstrong & Drew, Citation2002; Colmer & Flowers, Citation2008). In flooded soil, the supply of oxygen from outside is reduced, the diffusion of oxygen is restricted inside, and the consumption of oxygen by soil microorganisms causes a shortage of oxygen supply to the roots of plants. ATP production is significantly reduced by switching from aerobic respiration to anaerobic respiration in cells due to a decrease in root oxygen concentration, leading to cytoplasmic acidity and cells death, resulting in large reduction of plant growth and yield (Drew & Sisworo, Citation1979; Geigenberger et al., Citation2000).
Plant growth under flooded conditions is determined by the leaf area and photosynthetic rate (Kaur et al., Citation2019; Mutava et al., Citation2015; Ren et al., Citation2016). Decreased leaf area and photosynthetic rate are caused by decreased absorption of water and nutrients, which require ATP (Irfan et al., Citation2010; Ren et al., Citation2016). In particular, root growth and/or nitrogen absorption are reduced by hypoxia, and these affects plant growth (Jackson et al., Citation1986). The concentration of ions, such as potassium and sodium, in plants is a good indicator of the normal functioning of cell membranes because energy is required for the uptake and elimination of ions (Thomson et al., Citation1989).
In rice and aquatic plants that grow vigorously even under waterlogging conditions, there is an oxygen acquisition mechanism, such as aerenchyma and the radial oxygen loss (ROL) barrier inside the adventitious roots (Engelaar et al., Citation1993; Kotula et al., Citation2009; Laan et al., Citation1989; Soukup et al., Citation2007; Watanabe et al., Citation2013). The formation of aerenchyma is associated with hypoxia tolerance in crops, such as rice, wheat, barley, corn, and sorghum, because the roots can grow rapidly due to oxygen supply from the aboveground parts to the root tip and rhizosphere. (Jackson & Armstrong, Citation1999; Thomson et al., Citation1990; Visser et al., Citation1996). Millet species with lysigenous aerenchyma are classified as ‘radial lysigeny,’ commonly found in Poales, Ranunculales, and Myrtales (Seago et al., Citation2005). Crops with tolerance to waterlogging develop aerenchyma even under non-waterlogging conditions (Cardoso et al., Citation2013; Mano & Omori, Citation2013), which are called constitutive aerenchyma. In contrast, aerenchyma in the roots of field crops, such as corn and wheat, are generally called inducible aerenchyma because they are not generally formed under aerobic conditions, but formed under oxygen-deficient conditions (Evans, Citation2003). The inducible aerenchyma formation is triggered by ethylene (Khan et al., Citation2020). Reportedly, waterlogging-tolerant millet species develop constitutive lysigenous aerenchyma at the base of adventitious roots under aerated conditions (Matsuura et al., Citation2016).
Regarding the oxygen acquisition mechanism of root tips in rice, suberin accumulates in the hypodermis of the root and lignin accumulates in the sclerenchyma to suppress ROL from the inside to the outside of the root basal part (Nishiuchi et al., Citation2012). It is speculated that this mechanism not only efficiently supplies oxygen from the aboveground parts to the roots but also prevents invasion by toxic substances from the outside of the roots (Greenway et al., Citation2006). In previous studies using rice, lignin was stained at 50 μg cm−2 or more and suberin at 12 μg cm−2 or more; therefore, lignin accumulated 4–11 times more than suberin (Watanabe et al., Citation2013). A strong ROL barrier is formed when a large amount of suberin and/or lignin accumulates at the base of the root (Shiono, Citation2016). In contrast, if a strong ROL barrier cannot be established on the base of the root, oxygen may be released from the base, and oxygen reaching the root tip will be reduced. However, even plants with waterlogging tolerance may not have a strong ROL barrier, and the relationship between the ROL pattern and the accumulation of lignin and suberin may not match. The relationship between the hypoxia tolerance of millets and the ROL barrier is unclear because there are few suitable studies.
Many studies have been conducted on the waterlogging of gramineous crops, including rice, wheat, and maize (Pedersen et al., Citation2021; Shiono, Citation2016; Yamauchi & Nakazono, Citation2015). Based on these studies, new lines of wheat and corn have been developed using wild relatives with strong waterlogging tolerance; however, a dramatic increase in growth and yield has not been reported (Gong et al., Citation2019; Malik et al., Citation2011).
Millets constitute a group of gramineous crops that has small caryopsis and is cultivated mainly in ‘summer rain-type’ semi-arid climate, tropical or subtropical savanna ecological conditions, as well as in temperate monsoon climate regions (Sakamoto, Citation1993). Since Sakamoto’s definition is consistent with plant taxonomy, it can be treated as a single plant group. There are interspecific differences in waterlogging tolerance among millet species (Kono et al., Citation1987; Matsuura et al., Citation2016) and there is no example of a comprehensive and detailed study of the environmental stress tolerance mechanisms of millet species.
Tef (Eragrostis tef) is an annual plant native to Ethiopia. The ancestral species were thought to be E. pilosa. Caryopsis is the world’s smallest among millet species, with a length of about 1 mm; the etymology of E. tef from ‘tefa’ means ‘lost’ in Amharic. It is nutritious and used as a staple food in Ethiopia as an injera (lightly baked bread). E. tef is highly tolerant to environmental stresses, including drought, waterlogging, and salinity (Assefa et al., Citation2015; Cannarozzi et al., Citation2014). The strength of environmental stress tolerance is a factor that has enabled survival of it as an edible crop, even if the grain is smaller than weeds. Despite its versatility in adapting to environmental conditions, the productivity of tef is very low (1.5 t ha−1; CSA, Citation2014). The Japanese millet (Echinochloa utilis) is an annual plant, and its ancestral species is Echinochloa crus-galli. The origin of cultivation is East Asia (China and Japan), and it is considered to be one of the oldest crops, together with foxtail and common millet, since carbonized seeds have been found in Japan from a stratum of the Jomon period. All Japanese wild species of Echinochloa are annual and can be divided into three types (Yabuno, Citation1975) as follows: The ones that grow only in paddy fields (Echinochloa crus-galli var. oryzicola, Echinochloa crus-galli var. formosensis); those that grow in the lowlands (Echinochloa crus-galli var. crus-galli); those that grow in drylands, including upland fields (Echinochloa crus-galli var. praticola). The Japanese millet originated from Echinochloa crus-galli var. crus-galli, which has waterlogging tolerance (Kono et al., Citation1987; Matsuura et al., Citation2016). Korne (Brachiaria ramosa) is an annual plant widely distributed in South Asia, which has drought tolerance and grows vigorously; therefore, it has been used as feed. When cultivated densely, many adventitious roots appear from almost all nodes above the ground. Foxtail millet (Setaria italica) is an annual plant, and its ancestral species is Setaria italica subsp. viridis. Nine species have been cultivated worldwide (Austin, Citation2006). The origin is considered to be from Central Asia to the northwestern part of the Indian subcontinent, and it was reported to have been cultivated in Eurasia since 5000 BC. In Japan, Kojiki and Nihon Shoki describe millet originating from God, and it is one of the oldest crops that were already cultivated during the Jomon period. S. italica is a crop with strong drought tolerance (Matsuura & An, Citation2020; Matsuura et al., Citation2012) and is susceptible to waterlogging (Matsuura et al., Citation2016). Currently, 43,000 strains are stored in research institutes around the world, which are important as diverse genetic resources.
Millets are considered to be highly tolerant to environmental stresses; however, the detailed mechanisms of hypoxia tolerance is elusive. In present study, we hypothesized that if the roots can acquire sufficient oxygen, water and nutrient absorption of the roots will be maintained, and the plant growth rate can be maintained. The purpose of this study is to clarify the determinants of hypoxia tolerance among the four millet species.
Materials and Methods
Plant Materials and Growth Conditions
Foxtail millet (Setaria italica L. P. Beauv. 84-6-14-2), Japanese millet (Echinochloa utilis Ohwi et Yabuno), Korne (Brachiaria ramosa (L.) Stapf 96–11-5-2b-4), and teff (Eragrostis tef (Zucc.) Trotter JP No. 37,758) were used in this study. Seeds of each species were sown in wet vermiculite in plastic containers (50.0 × 36.0 × 10.5 cm in height) floated on a half of concentration of the nutrient solution containing twice the Fe concentration of the original Hoagland and Arnon’s solution (Hoagland & Arnon, Citation1950) for three weeks in a vinyl house at the Tokai University, Kumamoto, Japan, on 1 June 2020. The mean air temperature was 30.7°C, light intensity (9:30–12:30) was 1726.9 μmol m−2 s−1, mean relative humidity was 78.9%, and day length was 14 h during the experiments. Two weeks after sowing, all plants were transplanted to a 400 L container (60 × 140 × 49 cm in depth) filled with the nutrient solution containing twice the Fe concentration of the original Hoagland and Arnon’s solution (Hoagland & Arnon, Citation1950) in a vinyl house at the National Agriculture and Food Research Organization Kyushu Okinawa Agricultural Research Center, Kumamoto, Japan. Two weeks after transplanting, half of the plants were cultured in the culture solution with low dissolved oxygen as the hypoxia treatment (H). Prior to this study, the dissolved oxygen concentration in root zone of rice in paddy fields was measured and found to be 20 to 80% of the saturated oxygen concentration. So, the dissolved O2 concentration was adjusted to less than 1 mg L−1 twice a week by flushing with N2. For the control (C), air was continuously ventilated in the nutrient solution using an air pump. The treatments were started when the plants are at 30–42 days (panicle differentiation stage) after sowing and were held for 28 days. The pH, electrical conductivity (EC), dissolved oxygen (DO), and temperature of both treatments were measured twice per week, and the pH was adjusted to 5.3–5.5 using HCl. The nutrient solution was replaced every 3–4 weeks.
Analysis of growth and stress susceptibility index
Six plants were sampled for each treatment at one day before treatment and 28 days after treatment (three replication). The leaf blade, stem (including leaf sheath), and root samples were collected and dried at 110°C for 30 min, followed by drying at 65°C for 72 h and weighed. Plant growth rate (PGR), shoot growth rate (GRs), and root growth rate (GRr) were calculated using the following equations:
where W1 and W2 are the dry weights of the whole plant, shoot, or root one day before the start of treatment (T1) and 28 days after the start of the treatment (T2), respectively.
The stress susceptibility index (SSI) was calculated as follows (Fisher & Maurer, Citation1978):
where WH is PGR of each millet species in the hypoxia treatment, WC is PGR of each millet species in the control, and WCM and WHM are the mean PGR of all millet species in the control and the hypoxia treatments, respectively.
Water potential of leaves
The water potential of the second fully expanded leaf was measured for three leaves per treatment in a pressure chamber (model 600, PMS Inc., Corvallis, USA) at 17 days after the treatment. Measurements were conducted in three replications.
Anatomical observations of adventitious roots
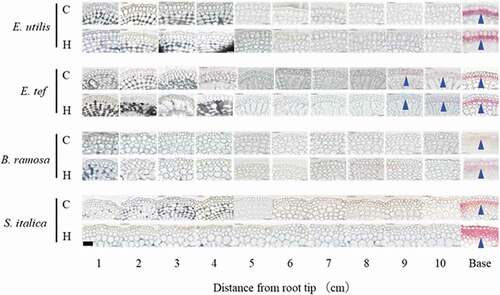
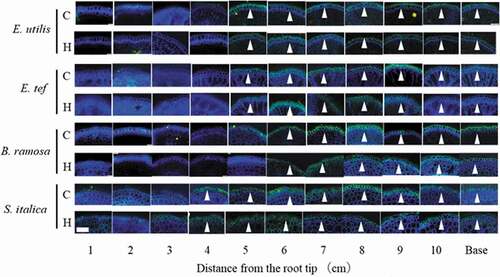
Eighteen days after the treatment, three adventitious roots with a root length of 14–19 cm were collected for each treatment, and cross-sections of 1 cm from the junction of adventitious roots and shoots (base) and every 1 cm at 1–10 cm from the root tip were prepared. Cross-sections (6–10 μm thick) were obtained using a plant microtome (MT-3 Nippon Medical & Chemical Instruments, Osaka, Japan). Sections were stained with Fluorol Yellow 088 at room temperature for 1 h to visualize the suberin lamellae (Brundrett et al., Citation1991). The sections were stained with 0.01% toluidine blue to observe the lysigenous aerenchyma and stele, and imaged using a light microscope (BX53 Olympus Optical, Tokyo, Japan) with a CCD camera (DP70, Olympus Optical, Tokyo, Japan). Other sections were stained with saturated phloroglucinol in 30% hydrochloric acid at room temperature to visualize the lignin (Jensen, Citation1962). The percentage of lysigenous aerenchyma or stele was calculated as the ratio of the cross-sectional area of adventitious roots. The cross-sectional area of the adventitious root, the area of the lysigenous aerenchyma, and the stele were analyzed using ImageJ software. All measurements were conducted in three replications.
Measurement of N, K, and Na levels in the leaf, stem (including leaf sheath), and root
Total nitrogen concentration was analyzed using a DUMATHERM CN (Gerhardt GmbH & Co., Königswinter, Germany) following a dry combustion method based on the original method described by Dumas (Citation1831). We used 0.1 g of dried and ground sample for this analysis. About 0.5 g of the oven-dried leaves, stems (including leaf sheath), and roots of control and hypoxia-treated plants harvested 28 days after the start of treatment were digested with sulfuric acid and hydrogen peroxide (Mizuno & Minami, Citation1980). The concentrations of Na+ and K+ were determined using an atomic absorption spectrophotometer (Model Z-2300, Hitachi, Ltd.). All measurements were replicated three times.
Statistical analysis
The treatment means were compared using the t-test (p < 0.05) in and . The means among millet species were compared using Tukey’s HSD test at p < 0.05, as shown in . In , an arcsine transformation for the percentage data was conducted before Tukey’s HSD test at p < 0.05. All statistical tests were performed using the JMP 13 statistical software (SAS Institute Japan, Tokyo, Japan).
Table 1. Influence of hypoxia stress on temperature, pH, EC, and DO of the nutrient solution during the experiment
Table 2. Influence of hypoxia stress on leaf water potential (ψL), N, K, and Na contents in four millet species
Figure 1. Plant growth rate (PGR), shoot growth rate (GRs) and root growth rate (GRr) among four millet species 28 days after the hypoxic treatment. C, Control; H, Hypoxia; SSI, Stress susceptible index. The treatment means were compared using the t-test (p < 0.05). ** and * indicate significant differences at p < 0.01 and p < 0.05, NS indicates not significant. Means with the same letter are not significantly different according to Tukey’s HSD (p < 0.05) when comparing the four species. n = 6.
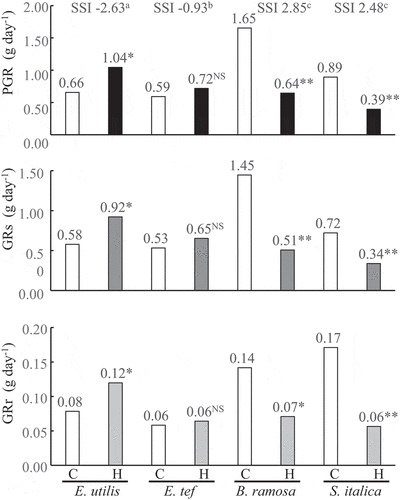
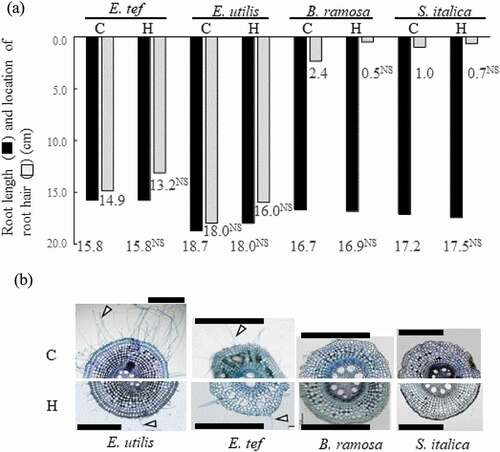
Figure 2. Length of adventitious root and location of root hair (A) and cross section of adventitious root 2 cm from the root tip (B) among four millet species 18 days after the hypoxic treatment. C, Control; H, Hypoxia. Location of the root hair was deducted from pictures in . 0.0 means base of root in (A). The treatment means were compared using the t-test (p < 0.05). ** and * indicate significant differences at p < 0.01 and p < 0.05, NS indicates not significant. n = 6. Cell wall was stained with 0.1% toluidine blue. Arrowheads show root hair. Scale bars = 500 μm.
Results
Growth analysis and hypoxia tolerance
During the treatment, the average pH, water temperature, and EC of the control and hypoxia treatments were similar (). However, the concentrations of dissolved oxygen upon hypoxia and control treatments were 11 and 91% of the saturated oxygen, respectively.
PGR of E. utilis was approximately 1.6 times higher than that of the control upon hypoxia treatment on day 28 after the treatment (). In contrast, these values decreased to 39 and 44% in B. ramosa and S. italica, respectively. PGR of E. tef did not change. SSI was calculated based on PGR, and it was significantly higher for E. utilis and E. tef than that of B. ramosa and S. italica. The trends based on the statistical analyses results of GRs and GRr were the same as the results of PGR in all millet species.
Water and nutrient absorption
There was no significant difference between control and hypoxia treatments in the root length of adventitious roots used for microscopic observations. (). A cross section of an adventitious root, 2 cm from the root tip, is shown in . In E. utilis and E. tef, the amount of root hair decreased upon treatment; however, root hair occurred near the root tip regardless of the treatment. In contrast, in B. ramosa and S. italica with lower hypoxia tolerance, almost no root hair was observed, regardless of the treatment.
There were no differences in the water potential of the second expanded leaf among the millet species upon hypoxia treatment (). Hypoxia treatment significantly reduced the nitrogen concentration per plant in B. ramosa and S. italica (). Hypoxia treatment did not change the nitrogen concentration of the leaves and stems in millets with high hypoxia tolerance; however, it decreased to 64–84% in millet species with low hypoxia tolerance. Hypoxia treatment did not change potassium concentration per plant except for B. ramosa (). Hypoxia treatment significantly reduced the potassium concentration of the leaves, stems and plants of B. ramosa. Hypoxia treatment did not change the sodium concentration per plant in E. utilis and E. tef; however, it was increased by 1.4 to 1.6 times in B. ramosa and S. italica (). Sodium concentration in the leaves of E. tef and S. italica decreased, however, it did not change in E. utilis and B. ramosa after hypoxia treatment. Sodium concentration in the roots of E. utilis did not change; however, it increased in E. tef, B. ramosa, and S. italica under hypoxia conditions.
Anatomical observation of adventitious roots
The stele areas of E. utilis and E. tef were generally smaller than those of B. ramosa and S. italica, regardless of the treatment (). Lysigenous aerenchyma of the adventitious roots of E. tef and E. utilis was observed 1 cm from the root tip in the control. Upon hypoxia treatment, lysigenous aerenchyma was observed 1 and 2 cm from the root tip in E. tef and E. utilis, respectively. In contrast, no lysigenous aerenchyma was observed in B. ramosa and S. italica in the control. Upon hypoxia treatment, lysigenous aerenchyma was observed 7–10 cm from the root tip in B. ramosa, and only at the base in S. italica.
Figure 3. Transverse cross section of each position of adventitious roots in control and hypoxic treatments 18 days after the treatment. C, Control; H; Hypoxia. Base: Observation 1 cm from the junction of shoot and adventitious root. Cell wall stained with 0.01% toluidine blue. Arrowheads show lysigenous aerenchyma. Scale bar = 500 μm.
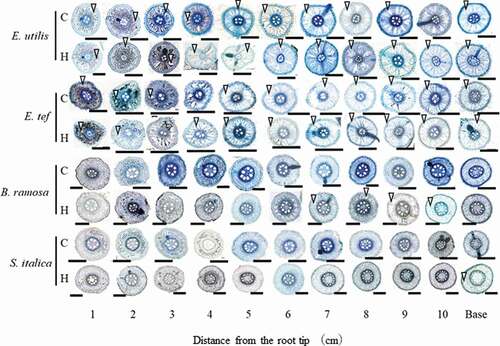
Figure 4. Percentage of stele (A) and lysigenous aerenchyma area (B) in cross-sections of adventitious roots (14–19 cm long) 18 days after the treatment. C, Control; H, Hypoxia. Base: Observation 1 cm from the junction of shoot and adventitious root. Data are presented as the mean (n = 6). Means with the same letter are not significantly different according to Tukey’s HSD (p < 0.05) at each distance from the root tip when comparing the four species.
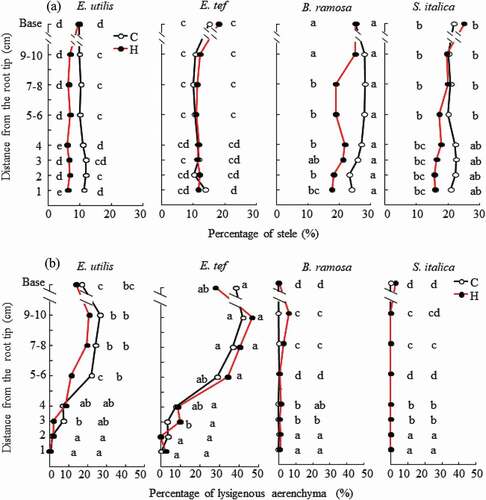
The mean percentage area of the stele of adventitious roots 1–10 cm from the root tip was 11.0 and 11.3%, respectively, for E. utilis and E. tef in the control (). Upon hypoxia treatment, the mean percentage area of the stele of adventitious roots 1–10 cm from the root tip was 6.7 and 11.6%, respectively, for E. utilis and E. tef. In the control, the mean percentage area of the stele of adventitious roots 1–10 cm from the root tip was 26.4 and 21.4%, respectively, in B. ramosa and S. italica. Upon hypoxia treatment, it decreased to 20.3 and 17.7% in B. ramosa and S. italica, respectively. The mean percentage area of the stele of adventitious roots tended to decrease upon hypoxia treatment in E. utilis, B. ramosa, and S. italica. The percentage area of the stele of adventitious roots of E. tef and E. utilis was generally smaller than that of B. ramosa and S. italica, regardless of the treatment.
Hypoxia treatment did not change the proportion of the area of lysigenous aerenchyma in any of the millet species at any position along the root (). Upon hypoxia treatment, the proportion of lysigenous aerenchyma at 9–10 cm from the root tip was the highest, at 21.0 and 46.6%, respectively, in E. utilis and E. tef. The highest proportion of lysigenous aerenchyma was 6.1% at 9–10 cm from the root tip in B. ramosa and 2.9% at the base in S. italica. The proportion of lysigenous aerenchyma from 5 cm to the base of adventitious roots in E. utilis and E. tef was significantly higher than that of B. ramosa and S. italica.
In the adventitious roots of E. utilis, B. ramosa, and S. italica, accumulation of lignin was observed in the sclerenchyma at the base, regardless of the treatment (). In E. tef, lignin accumulation was observed in the sclerenchyma 9–10 cm from the root tip, in addition to the base, regardless of the treatment.
Figure 5. Lignin accumulation in sclerenchyma of adventitious roots grown in aerated control (C) and hypoxic treatment (H) by flushing N2. Base: Observation 1 cm from the junction of shoot and adventitious root. Cross section of 14–19 cm adventitious roots 18 days after the treatment, stained with phloroglucinol-HCl and viewed under white light. Arrowheads show lignin (stained red) accumulation. Scale bar = 50 μm.
In E. tef and E. utilis, suberin accumulation was observed in the hypodermis/exodermis at the base and 5–10 cm from the root tip, regardless of treatment (). In B. ramosa and S. italica, suberin accumulation was observed in the hypodermis/exodermis at the base, as well as 6–10 and 4–10 cm from the root tip, regardless of the treatment.
Figure 6. Suberin accumulation in hypodermis/exodermis of adventitious roots grown in aerated control (C) and hypoxic treatment (H) by flushing N2. Base: Observation 1 cm from the junction of shoot and adventitious root. Cross section of 14–19 cm adventitious roots 18 days after the treatment, stained with Fluorol yellow 088 and observed under UV illumination. Arrowheads show suberin accumulation (stained yellow-green). Scale bar = 100 μm.
Discussion
Growth analysis and hypoxia tolerance
Growth and yield under stress are defined by both yield potential (growth or yield without stress) and susceptibility to stress, and SSI observed to be a useful indicator for assessing drought tolerance in wheat (Fisher & Maurer, Citation1978). SSI is also widely used in drought tolerance studies to classify susceptible and tolerant genotypes and is an appropriate index for distinguishing tolerant varieties (Fernandez, Citation1992; Matsuura et al., Citation2012; Sio-Se Mardeh et al., Citation2006). Previous studies using four millet species have reported a positive correlation between plant growth and grain yield (Matsuura et al., Citation2016). Therefore, it is appropriate to use plant growth as a criterion for hypoxia tolerance during the vegetative growth period. From the results of the SSI based on PGR, it was considered that E. utilis and E. tef were more hypoxia tolerant than B. ramosa and S. italica (). Similar to this study, it has been reported that highly waterlogging-tolerant E. tef varieties grow more vigorously when cultivated in flooded soil (Cannarozzi et al., Citation2018). It has also been reported that E. utilis is highly tolerant of waterlogging and S. italica shows low waterlogging tolerance among nine summer cereals in a pot experiment (filled with sandy loam soil; Kono et al., Citation1987). For 12 rice varieties (seven upland rice, three paddy rice, two floating rice), the plant dry weights under waterlogging treatment in upland rice, paddy rice, and floating rice were 0.7–1.4, 0.9–1.2, and 0.7–0.9 times, respectively, compared to that of the drained soil for 30 days; however, no significant differences were observed (Colmer, Citation2003a). These results suggest that E. utilis and E. tef have high waterlogging tolerance. The waterlogging tolerance of E. utilis and E. tef might be supported by root growth, as shown in . Therefore, we considered that interspecific differences in waterlogging tolerance were associated with capacity for nutrient and water absorption.
Water and nutrient absorption
Root growth is considered an important adaptive response to hypoxia (Daugherty & Musgrave, Citation1994; Erdmann & Wiedenroth, Citation1986). Hypoxia treatment did not change GRr in E. tef and increased GRr of E. utilis (). In contrast, GRr decreased to 50 and 33% in B. ramosa and S. italica, respectively. Root hairs were generated near the root tip, and the site of occurrence was long in E. utilis and E. tef (). Since root hairs play an important role in nutrient absorption (Gahoonia et al., Citation2001; Nye, Citation1966), it was considered that the growth of adventitious roots with root hair was greatly involved in the interspecific difference in hypoxia tolerance among the four-millet species in used in this study.
When root growth decrease, the nutrient absorption area decreases. When the balance between root growth and transpiration rate is lost, the plant become water deficient. Hayashi et al. (Citation2013) found that the waterlogging-tolerant wheat cultivars maintained higher leaf water potential under waterlogged conditions than the susceptible ones and reported that maintaining root development is an important quantitative trait to maintain water uptake under waterlogged conditions. Decrease in leaf water potential under waterlogged conditions was also reported for Triticum aestivum (Huang et al., Citation1994), Arachis hypogaea (Bishnoi & Krishnamoorthy, Citation1992), Helianthus annuus (Everard & Drew, Citation1989). On the other hand, there are no effects on plant water status of Helianthus annuus (Everard & Drew, Citation1989) and Pisum sativum (Zhang & Davies, Citation1986). When the water potential of the leaf blade xylem was measured, no difference was observed among different species and treatments (), suggesting that water shortage is not a factor that reduces plant growth. Therefore, it was considered that nutrient absorption was mainly involved in the interspecific differences in growth under hypoxia; we investigated the nitrogen concentration of the plant. We observed that nitrogen concentration in the leaves and stems was consistent with the interspecific differences in hypoxia tolerance (). In wheat and barley, 11 days of nitrogen aeration during the vegetative growth period resulted in oxygen and ATP deficiency, reducing nitrogen concentration to 60–70%, resulting in reduced growth due to nutrient deficiency (Steffens et al., Citation2005). In corn, the chlorophyll concentration was significantly reduced when the field was flooded for 6 days in the third leaf stage (Ren et al., Citation2016). In the present study, it was considered that photosynthesis and leaf growth might have decreased due to decreased transfer of nitrogen to leaves, as well as nitrogen absorption.
The concentration of ions, such as potassium and sodium, in plants is an excellent indicator of the normal functioning of cell membranes because energy is required for the uptake and elimination of ions (Thomson et al., Citation1989). Since potassium concentration and interspecific differences in hypoxia tolerance did not match (), potassium accumulation was not considered to be a factor in determining hypoxia tolerance. In contrast, sodium accumulation per plant was consistent with the interspecific differences in hypoxia tolerance. However, the sodium concentration was low and was considered not critical for hypoxia tolerance. In corn, it was found that the cell membrane was damaged as reflected by high concentration of malondialdehyde in leaves, resulting from lipid peroxidation which increased when waterlogging was continued for 6 days in the third leaf stage (Ren et al., Citation2016). In the present study, sodium absorption was more sensitive to hypoxia treatment than potassium absorption and it was considered that selective permeability of cell membranes was rapidly inhibited in hypoxia-susceptible species under hypoxia treatment (Tester & Davenport, Citation2003).
Anatomical observation of adventitious roots
Based on the research results of wetland grass species, the characteristics of plants with strong waterlogging tolerance are as follows: (1) Development of lysigenous aerenchyma in the roots (oxygen supply); (2) low proportion of stele (suppression of oxygen consumption) and (3) ROL barrier that suppresses oxygen leakage at the base of the roots (prevention of oxygen leakage and inflow of toxic gas; McDonald et al., Citation2002). Wetland plants that do not show all of these characteristics have not been reported, but there are some wetland plants that do not have one of the three traits (Malik et al., Citation2009; Manzur et al., Citation2015; McDonald et al., Citation2002).
Stele area
Rice showed a smaller proportion of stele area than wheat and corn; the stele consumes a large amount of oxygen (Armstrong et al., Citation2000), and is considered disadvantageous for hypoxia tolerance (Pedersen, Sauter, Colmer, Nakazono et al., Citation2021; Yamauchi et al., Citation2019). In the present study, the proportion of the stele of the adventitious roots of the hypoxia-tolerant millet was approximately 10%, which was less than that of the hypoxia-susceptible millet (). Similarly, in previous millet studies, waterlogging-tolerant millets had a smaller proportion of stele (Matsuura et al., Citation2016). Considering that the proportion of stele was 2.6–32.2% under aerated conditions in wetland plants and 19.7–35.5% in non-wetland plants (McDonald et al., Citation2002), the proportion of stele area is not the main factor that determines hypoxia tolerance. However, the proportion of stele might be an important for suppressing oxygen consumption, even in millet species.
Aerenchyma development
Some wetland plants do not develop aerenchyma (Drosera capensis, Gunnera manicata, Euphorbia aquayica); however, many wetland plants develop (Seago et al., Citation2005). Root aerenchyma is usually calculated as the relative volume of internal gas spaces of tissue (porosity) using the buoyancy method/microbalance method or the percentage area of air spaces to total cross-sectional area via microscopic analysis. There is a rough positive correlation between the results of the two methods, and microscopical cross-sectioning of roots has the advantage of providing a clear view of the anatomical structure of the tissue (Visser & Bogemann, Citation2003). Porosity at the base of adventitious roots in many wetland plants, including rice, is 13.8–13.8% and 0% for non-wetland plants under aeration (McDonald et al., Citation2002). The porosity of adventitious roots in wetland monocotyledons under aeration is 10–43%, and that in non-wetland monocotyledons is 1–7% (Colmer, Citation2003b). When rice is grown in stagnant deoxygenated 0.1% agar nutrient solution for 30–40 days, a porosity of 10% is observed 1 cm from the root tip. (Kotula et al., Citation2009). Root aerenchyma at 4 cm from the root tip of Paspalidium geminiatum, a wetland gramineous plant, was 12% in aerated solution (Manzur et al., Citation2015). Root aerenchyma at 9 cm from the root tip of Zea nicaraguensis, a wild relative of Zea mays, with high waterlogging tolerance, is 25% in aerated solution (Gong et al., Citation2019). As mentioned above, plants with strong waterlogging tolerance develope constitutive aerenchyma. In the present study, the lysigenous aerenchyma of E. utilis and E. tef was observed at 1 cm from the root tip, showing maximum values of 26.9 and 42.0%, respectively, at 10 cm from the root tip under aerated conditions (). In contrast, the lysigenous aerenchyma of B. ramosa was observed at 6 cm from the root tip, showing a maximum value of 0.2% upon aerated treatment. The lysigenous aerenchyma of S. italica was not observed at any position from the root tip in the control. The development of constitutive aerenchyma allows plants to adapt rapidly to sudden flooding by maintaining oxygen flow from the shoot to the root tip (Mano & Omori, Citation2013). It was confirmed that millet species with higher waterlogging tolerance develop constitutive aerenchyma like wetland plants; however, millet species that have lower waterlogging tolerance did not markedly develop constitutive aerenchyma. The development of constitutive aerenchyma might be one of the most important traits among the four-millet species in the present study.
When Z. nicaraguensis and Zea mays were grown in deoxygenated 0.1% (w/v) agar for 14 days, the aerenchyma of adventitious roots of Z. nicaraguensis and Z. mays were observed at 1 and 2 cm from the root tip, respectively, showing maximum values of 28 and 22%, respectively, at 8 cm from the root tip (Abiko et al., Citation2012). In the present study, the lysigenous aerenchyma of E. utilis and E. tef was observed at 1 cm from the root tip, showing maximum values of 21.0 and 46.6%, respectively, at 10 cm from the root tip under hypoxia treatment (). In contrast, the lysigenous aerenchyma of B. ramosa was observed at 1 cm from the root tip, showing maximum values of 6.1% at 10 cm from the root tip under hypoxia treatment. The lysigenous aerenchyma of S. italica was only observed at the base of adventitious roots, showing a maximum value of 2.9%. A close relationship was previously found between the root growth rate of Rumex species grown in wetlands and the development of aerenchyma in adventitious roots (Laan et al., Citation1989). There was a close relationship between the development of lysigenous aerenchyma and the root growth rate under hypoxia treatment in the present study (). Furthermore, the lysigenous aerenchyma plays an important role in the transfer of harmful gases from roots to shoots under flooded conditions (Colmer, Citation2003b).
Lignin accumulation in cortical sclerenchyma
In rice, lignin accumulated 4–5 times more than that of suberin, which is higher in older tissues than in younger tissues (Kotula et al., Citation2009). In the present study, lignin accumulation in the cortical sclerenchyma of adventitious roots was found at the base of adventitious roots of all millet species, and no interspecific or intertreatment differences were observed (). From this, it was considered that the accumulation of lignin in cortical sclerenchyma is not one of the main factors responsible for the interspecific difference in hypoxia tolerance among the four millet species.
Suberin accumulation in hypodermis/exodermis
In rice, accumulation of suberin in the hypodermis/exodermis of adventitious roots was observed 3–6 cm from the root tip in the aerated solution and 2–6 cm from the root tip in the stagnant solution (Kotula et al., Citation2009). In Z. mays, suberin accumulation in the hypodermis/exodermis of adventitious roots was observed 3–8 cm from the root tip in the aerated solution and 4–8 cm from the root tip in the stagnant solution (Abiko et al., Citation2012). In Z. nicaraguensis, suberin accumulation in the hypodermis/exodermis of adventitious roots was observed 7–8 cm from the root tip in the aerated solution and 2–8 cm from the root tip in the stagnant solution. Although the hypoxia treatment method was different, these results suggest that the accumulation of suberin in millet species tended to be farther than the root tip compared to O. sativa, Z. mays, and Z. nicaraguensis. If the ROL barrier develops along the root and close to the root tip, oxygen supplied from the shoot can be efficiently delivered to the root tip, oxidizing the rhizosphere and preventing the uptake of reduced toxins from flooded soil; however, some wetland plants do not have a tight ROL barrier (Colmer, Citation2003b).
From the above results, it is considered that the interspecific differences in hypoxia tolerance was attributable to the oxygen acquisition mechanisms of adventitious roots, which constitute the development of lysigenous aerenchyma that supplies oxygen.
Future challenges
Hordeum marinum and Z. nicaraguensis, which develop aerenchyma and ROL barriers under hypoxia conditions, have been used to provide useful chromosome segments to improve the hypoxia tolerance of wheat and corn. However, the proportion of aerenchyma and the dry weight of the whole plant in the new introgression lines did not increase markedly and some decreased their growth under aerated condition (Gong et al., Citation2019; Malik et al., Citation2011). Gong et al. (Citation2019) considered that the introduction of aerenchyma alone was inadequate and that QTL analysis did not sufficiently identify the causal genes.
Even in a stable and optimal agricultural area, it is not easy to meet the urgent demand for increased food production because of various factors, such as increased land and water use by biofuel crops, climate change, and abiotic stresses (Ruggiero et al., Citation2017). In this situation, increasing productivity without imposing a burden on the environment is an urgent issue. Millet species might be able to solve this problem as an old and new diverse genetic resource, as mentioned by Bandyopadhyay et al. (Citation2017). To improve crop productivity in waterlogging areas, not only variety improvement is critical, but also conservation and evaluation of diverse genetic resources and elucidation of stress tolerance mechanisms are important.
Acknowledgments
We thank Mr. Kentaro Kawasaki, students of the Department of Agriculture, Tokai University, for his assistance in carrying out the experiments. We would like to express our deep gratitude to Mr. Akira Ogata and Mr. Yutaka Takagi, technical staff of Tokai University, for creating, repairing, and managing of research survey equipment. This research was supported in part by a Grant-in-Aid for Arid Land Research Center, Tottori University, and JSPS KAKENHI Grant Number JP18K05600.
Disclosure statement
No potential conflict of interest was reported by the author(s).
References
- Abiko, T., Kotula, L., Shiono, K., Malik, A. I., Colmer, T. D., & Nakazono, M. (2012). Enhanced formation of aerenchyma and induction of a barrier to radial oxygen loss in adventitious roots of Zea nicaraguensis contribute to its waterlogging tolerance as compared with maize (Zea mays ssp. mays). Plant, Cell & Environment, 35(9), 1618–1630. https://doi.org/https://doi.org/10.1111/j.1365-3040.2012.02513.x
- Armstrong, W., Cousins, D., Armstrong, J., Turner, D. W., & Beckett, P. M. (2000). Oxygen distribution in wetland plant roots and permeability barriers to gas-exchange with the rhizosphere: A microelectrode and modelling study with Phragmites australis. Annals of Botany, 86(3), 687–703. https://doi.org/https://doi.org/10.1006/anbo.2000.1236
- Armstrong, W., & Drew, M. C. (2002). Root growth and metabolism under oxygen deficiency. In Y. Waisel, Eshel, A., Beeckman, T., and Kafkafi, U. Eds. Plant roots: The hidden half, 3rd edn. (CRC Press). pp. 729–761.
- Assefa, K., Cannarozzi, G., Girma, D., Kamies, R., Chanyalew, S., Plaza-Wüthrich, S., Blösch, R., Rindisbacher, A., Rafudeen, S., & Tadele, Z. (2015). Genetic diversity in tef [Eragrostis tef (Zucc.) Trotter]. Frontiers in Plant Science, 6, 1–13. https://doi.org/https://doi.org/10.3389/fpls.2015.00177
- Austin, D. F. (2006). S. italica (Setaria: Poaceae) - Abandoned food in two hemispheres. Economic Botany, 60(2), 143–158. https://doi.org/https://doi.org/10.1663/0013-0001(2006)60[143:FMSPFI]2.0.CO;2
- Bailey-Serres, J., Lee, S. C., & Brinton, E. (2012). Waterproofing crops: Effective flooding survival strategies. Plant Physiology, 160(4), 1698–1709. https://doi.org/https://doi.org/10.1104/pp.112.208173
- Bandyopadhyay, T., Muthamilarasan, M., & Prasad, M. (2017). Millets for next generation climate-smart agriculture. Frontiers in Plant Science, 8, 1–6. https://doi.org/https://doi.org/10.3389/fpls.2017.01266
- Bishnoi, N. R., & Krishnamoorthy, H. N. (1992). Effect of waterlogging and gibberellic acid on leaf gas exchange in peanut (Arachis hypogaea L.). Journal of Plant Physiology, 139(4), 503–505. https://doi.org/https://doi.org/10.1016/S0176-1617(11)80502-X
- Brundrett, M. C., Kendrick, B., & Peterson, C. A. (1991). Efficient lipid staining in plant material with Sudan red 7B or fluorol yellow 088 in polyethylene glycol-glycerol. Biotechnic and Histochemistry, 66(3), 111–116. https://doi.org/https://doi.org/10.3109/10520299109110562
- Cannarozzi, G., Plaza-Wüthrich, S., Esfeld, K., Larti, S., Song Wilson, Y., Girma, D., de Castro, E., Chanyalew, S., Blösch, R., Farinelli, L., Lyons, E., Schneider, M., Falquet, L., Kuhlemeier, C., Assefa, K. & Tadele, Z. (2014). Genome and transcriptome sequencing identifies breeding targets in the orphan crop tef (Eragrostis tef). BMC Genomics, 15(1), 581. https://doi.org/https://doi.org/10.1186/1471-2164-15-581
- Cannarozzi, G., Weichert, A., Schnell, M., Ruiz, C., Bossard, S., Blösch, R., Plaza‐Wüthrich, S., Chanyalew, S., Assefa, K., & Tadele, Z. (2018). Waterlogging affects plant morphology and the expression of key genes in tef (Eragrostis tef). Plant Direct, 2(4), e00056. https://doi.org/https://doi.org/10.1002/pld3.56
- Cardoso, J. A., Rincon, J., Jimenez, J. C., Noguera, D., & Rao, I. M. (2013). Morpho-anatomical adaptations to waterlogging by germplasm accessions in a tropical forage grass. AOB Plants, 5, 1–14. https://doi.org/https://doi.org/10.1093/aobpla/plt047
- Colmer, T. D., & Flowers, T. J. (2008). Flooding tolerance in halophytes. New Phytologist, 179(4), 964–974. https://doi.org/https://doi.org/10.1111/j.1469-8137.2008.02483.x
- Colmer, T. D. (2003a). Aerenchyma and an inducible barrier to radial oxygen loss facilitate root aeration in upland, paddy and deep-water rice (Oryza sativa L.). Annals of Botany, 91(2), 301–309. https://doi.org/https://doi.org/10.1093/aob/mcf114
- Colmer, T. D. (2003b). Long-distance transport of gases in plants: A perspective on internal aeration and radial oxygen loss from roots. Plant, Cell & Environment, 26(1), 17–36. https://doi.org/https://doi.org/10.1046/j.1365-3040.2003.00846.x
- CSA. (2014). Agricultural sample survey for 2013/14. In Statistical bulletin (pp. 532). Central Statistical Agency.
- Daugherty, C. J., & Musgrave, M. E. (1994). Characterization of populations of rapid-cycling Brassica rapa L. selected for differential waterlogging tolerance. Journal of Experimental Botany, 45(3), 385–392. https://doi.org/https://doi.org/10.1093/jxb/45.3.385
- Drew, M. C., & Sisworo, E. J. (1979). The development of waterlogging damage in young barley plants in relation to plant nutrient status and changes in soil properties. New Phytologist, 82(2), 301–314. https://doi.org/https://doi.org/10.1111/j.1469-8137.1979.tb02656.x
- Dumas, J. B. A. (1831). Procedes de l’analyse Organic. Annales de Chimie Et de Physique (Annals of Chemistry and of Physics), 247, 198–213.
- Engelaar, W. M. H. G., Van Bruggen, M. W., Van Den Hoek, W. P. M., Huyser, M. A. H., & Blom, C. W. P. M. (1993). Root porosities and radial oxygen losses of Rumex and Plantago species as influenced by soil pore diameter and soil aeration. New Phytologist, 125(3), 565–574. https://doi.org/https://doi.org/10.1111/j.1469-8137.1993.tb03904.x
- Erdmann, B., & Wiedenroth, E. M. (1986). Changes in the root system of wheat seedlings following root anaerobiosis. II. Morphology and anatomy of evolution forms. Annals of Botany, 58(5), 607–616. https://doi.org/https://doi.org/10.1093/oxfordjournals.aob.a087223
- Evans, D. E. (2003). Aerenchyma formation. New Phytologist, 161(1), 35–49. https://doi.org/https://doi.org/10.1046/j.1469-8137.2003.00907.x
- Everard, J. D., & Drew, M. C. (1989). Water relations of sunflower (Helianthus annuus) shoots during exposure of the root. Journal of Experimental Botany, 40(11), 1255–1264. https://doi.org/https://doi.org/10.1093/jxb/40.11.1255
- Fernandez, G. C. J. (1992). Effective selection criteria for assessing stress tolerance. In C. G. Kuo, editor, Proceedings of the international symposium on adaptation of food crops to temperature and water stress, Taiwan. 13-18 August, Asian Vegetable Res. and Dev. Ctr. Publication, Shanhua, Tainan, 257–270.
- Fisher, R. A., & Maurer, R. (1978). Drought resistance in spring wheat cultivars. Grain yield responses. Australian Journal of Agricultural Research, 29(5), 897–912. https://doi.org/https://doi.org/10.1071/AR9780897
- Gahoonia, T. S., Nielsen, N. E., Joshi, P. A., & Jahoor, A. (2001). A root hairless barley mutant for elucidating genetics of root hairs and phosphorus uptake. Plant and Soil, 235(2), 211–219. https://doi.org/https://doi.org/10.1023/A:1011993322286
- Geigenberger, P., Fernie, A. R., Gibon, Y., Christ, M., & Stitt, M. (2000). Metabolic activity decreases as an adaptive response to low internal oxygen in growing potato tubers. Biological Chemistry, 381(8), 723–740. https://doi.org/https://doi.org/10.1515/BC.2000.093
- Gong, F., Takahashi, H., Omori, F., Wang, W., Mano, Y., & Nakazono, M. (2019). QTLs for constitutive aerenchyma from Zea nicaraguensis improve tolerance of maize to root-zone oxygen deficiency. Journal of Experimental Botany, 70(21), 6475–6487. https://doi.org/https://doi.org/10.1093/jxb/erz403
- Greenway, H., Armstrong, W., & Colmer, T. D. (2006). Conditions leading to high CO2 (>5 kPa) in Waterlogged–flooded soils and possible effects on root growth and metabolism. Annals of Botany, 98(1), 9–32. https://doi.org/https://doi.org/10.1093/aob/mcl076
- Hayashi, T., Yoshida, T., Fujii, K., Mitsuya, S., Tsuji, T., Okada, Y., Hayashi, E., & Yamauchi, A. (2013). Maintained root length density contributes to the waterlogging tolerance in common wheat (Triticum aestivum L.). Field Crops Research, 152, 27–35. https://doi.org/https://doi.org/10.1016/j.fcr.2013.03.020
- Hirabayashi, Y., Mahendran, R., & Koirala, S. (2013). Global flood risk under climate change. Climatic Change, 3, 816–821. https://doi.org/https://doi.org/10.1038/NCLIMATE1911
- Hoagland, D. R., & Arnon, D. L. (1950). The water-culture method for growing plants without soil. California Agricultural Experiment Station Circular, 347. In college of Agriculture, University of California.
- Huang, B., Johnson, J. W., Nesmith, S., & Bridges, D. C. (1994). Growth, physiological and anatomical responses of two wheat genotypes to waterlogging and nutrient supply. Journal of Experimental Botany, 45, 193–202. https://doi.org/https://doi.org/10.1093/jxb/45.2.193
- Irfan, M., Hayat, S., & Hayat, Q. (2010). Physiological and biochemical changes in plants under waterlogging. Protoplasma, 241(1–4), 3–17. https://doi.org/https://doi.org/10.1007/s00709-009-0098-8
- Jackson, M. B., & Armstrong, W. (1999). Formation of aerenchyma and the processes of plant ventilation in relation to soil flooding and submergence. Plant Biology, 1(3), 274–287. https://doi.org/https://doi.org/10.1111/j.1438-8677.1999.tb00253.x
- Jackson, W. A. P., L., W., Moll, R. H., & Kamprath, E. J. (1986). Biochemical basis of plant breeding (Vol. 2, pp. 73). CRC Press.
- Jensen, W. (1962). Botanical histochemistry: Principles and practice. W. H. Freeman.
- Kaur, G., Singh, G., Motavalli, K. A., Nelson, B. A., Orlowski, J. M., & Golden, B. R. (2019). Impacts and management strategies for crop production in waterlogged or flooded soils: A review. Agronomy Journal, 112(3), 1475–1501. https://doi.org/https://doi.org/10.1002/agj2.20093
- Khan, M. I. R., Trivellinib, A., Chhillara, H., Chopraa, P., Ferrantec, A., Khand, N. A., & Ismail, A. M. (2020). The significance and functions of ethylene in flooding stress tolerance in plants. Environmental and Experimental Botany, 179, 1041881–13. https://doi.org/https://doi.org/10.1093/jxb/45.2.193
- Kono, Y., Yamauchi, A., Kawamura, N., Tatshumi, J., Nonoyama, T., & Inagaki, N. (1987). Interspecific differences of the capacities of waterlogging and drought tolerances among summer cereals. Japanese Journal of Crop Science, 56(1), 115–129. https://doi.org/https://doi.org/10.1626/jcs.56.115
- Kotula, L., Ranathunge, K., Schreiber, L., & Steudle, E. (2009). Functional and chemical comparison of apoplastic barriers to radial oxygen loss in roots of rice (Oryza sativa L.) grown in aerated or deoxygenated solution. Journal of Experimental Botany, 60(7), 2155–2167. https://doi.org/https://doi.org/10.1093/jxb/erp089
- Laan, P., Berrevoets, M. J., Lythe, S., Armstrong, W., & Blom, C. W. P. M. (1989). Root morphology and aerenchyma formation as indicators of the flood-tolerance of Rumex species. Journal of Ecology, 77(3), 693–703. https://doi.org/https://doi.org/10.2307/2260979
- Malik, A. I., English, J. P., & Colmer, T. D. (2009). Tolerance of Hordeum marinum accessions to O2 deficiency, salinity and these stresses combined. Annals of Botany, 103(2), 237–248. https://doi.org/https://doi.org/10.1093/aob/mcn142
- Malik, A. I., Islam, A. K. M. R., & Colmer, T. D. (2011). Transfer of the barrier to radial oxygen loss in roots of Hordeum marinum to wheat (Triticum aestivum): Evaluation of four H. marinum -wheat amphiploids. New Phytologist, 190(2), 499–508. https://doi.org/https://doi.org/10.1111/j.1469-8137.2010.03519.x
- Mano, Y., & Omori, F. (2013). Flooding tolerance in interspecific introgression lines containing chromosome segments from teosinte (Zea nicaraguensis) in maize (Zea mays subsp. mays). Annals of Botany, 112(6), 1125–1139. https://doi.org/https://doi.org/10.1093/aob/mct160
- Manzur, M. E., Grimoldi, A. A., Insausti, P., & Striker, G. G. (2015). Radial oxygen loss and physical barriers in relation to root tissue age in species with different types of aerenchyma. Functional Plant Biology, 42(1), 9–17. https://doi.org/https://doi.org/10.1071/FP14078
- Matsuura, A., An, P., Murata, K., & Inanaga, K. (2016). Effect of pre- and post-heading waterlogging on growth and grain yield of four millets. Plant Production Science, 19(3), 348–359. https://doi.org/https://doi.org/10.1080/1343943X.2016.1146907
- Matsuura, A., & An, P. (2020). Factors related water and dry matter during pre- and post- heading in four millet species under severe water deficit. Plant Production Science, 23(1), 28–38. https://doi.org/https://doi.org/10.1080/1343943X.2019.1698969
- Matsuura, A., Tsuji, W., An, P., Inanaga, S., & Murata, K. (2012). Effect of pre- and post-heading water deficit on growth and grain yield of four millets. Plant Production Science, 15(4), 323–331. https://doi.org/https://doi.org/10.1626/pps.15.323
- McDonald, M. P., Galwey, N. W., & Colmer, T. D. (2002). Similarity and diversity in adventitious root anatomy as related to root aeration among a range of wetland and dryland grass species. Plant, Cell & Environment, 25(3), 441–451. https://doi.org/https://doi.org/10.1046/j.0016-8025.2001.00817.x
- Mizuno, N., & Minami, M. (1980). [Rapid decomposition method for determination of N, K, Mg, Ca, Fe and Mn in agricultural plants with sulfuric acid and hydrogen peroxide.]. Japanese Journal of Soil Science and Plant Nutrition, 51(In Japanese with English title), 418–420. https://doi.org/https://doi.org/10.20710/dojo.51.5_418
- Mutava, R. N., Prince, S. J., Syed, N. H., Song, L., Valliyodan, B., Chen, W., & Nguyen, H. T. (2015). Understanding abiotic stress tolerance mechanisms in soybean: A comparative evaluation of soybean response to drought and flooding stress. Plant Physiology and Biochemistry, 86, 109–120. https://doi.org/https://doi.org/10.1016/j.plaphy.2014.11.010
- Nishiuchi, S., Yamauchi, T., Takahashi, H., Kotula, L., & Nakazono, M. (2012). Mechanisms for coping with submergence and waterlogging in rice. Rice, 5(1), 5. https://doi.org/https://doi.org/10.1186/1939-8433-5-5
- Nye, P. H. (1966). The effect of the nutrient intensity and buffering power of a soil, and the absorbing power, size and root hairs of a root, on nutrient absorption by diffusion. Plant and Soil, 25(1), 81–105. https://doi.org/https://doi.org/10.1007/BF01347964
- Pedersen, O., Perata, P., & Voesenek, L. A. C. J. (2017). Flooding and low oxygen responses in plants. Functional Plant Biology, 44(9), 3–6. https://doi.org/https://doi.org/10.1071/FPv44n9_FO
- Pedersen, O., Sauter, M., Colmer, T. D., & Nakazono, M. (2021). Regulation of root adaptive anatomical and morphological traits during low soil oxygen. New Phytologist, 229 , 5–7. https://doi.org/https://doi.org/10.1111/nph.16375
- Perata, P., Armstrong, W., & Voesenek, L. A. C. J. (2011). Plants and flooding stress. New Phytologist, 190(2), 269–273. https://doi.org/https://doi.org/10.1111/j.1469-8137.2011.03702.x
- Ren, B. Z., Zhang, J., Dong, S., Liu, P., & Zhao, B. (2016). Effects of waterlogging on leaf mesophyll cell ultrastructure and photosynthetic characteristics of summer maize. PLOS ONE, 11(9), e0161424. https://doi.org/https://doi.org/10.1371/journal.pone.0161424
- Ruggiero, A., Punzo, P., Landi, S., Costa, A., Van Ooosten, M., & Grillo, S. (2017). Improving plant water use efficiency through molecular genetics. Horticulture, 3(2), 31. https://doi.org/https://doi.org/10.3390/horticulturae3020031
- Sakamoto, S. (1993). Millets in the world and their food culture. Farming Japan, 27, 10–18.
- Sasidharan, R., Voesenek, L. A. C. J., & Perata, P. (2021). Plant performance and food security in a wetter world. New Phytologist, 229(1), 5–7. https://doi.org/https://doi.org/10.1111/nph.17067
- Seago, J. L., Jr., Marsh, L. C., Stevens, K. J., Soukup, A., Votrubova, O., & Enstone, D. E. (2005). A re-examination of the root cortex in wetland flowering plants with respect to aerenchyma. Annals of Botany, 96(4), 565–579. https://doi.org/https://doi.org/10.1093/aob/mci211
- Setter, T. L., & Waters, I. (2003). Review of prospects for germplasm improvement for waterlogging tolerance in wheat, barley and oats. Plant and Soil, 253(1), 1–34. https://doi.org/https://doi.org/10.1023/A:1024573305997
- Shiono, K. A barrier to radial oxygen loss enables wetland plants to grow under waterlogged conditions.]. (2016). Root Research, 25(3), 47–62. In Japanese with English abstract. https://doi.org/https://doi.org/10.3117/rootres.25.47
- Sio-Se Mardeh, A., Ahmadi, A., Poustini, K., & Mohammadi, V. (2006). Evaluation of drought resistance indices under various environmental conditions. Field Crops Research, 98(2–3), 222–229. https://doi.org/https://doi.org/10.1016/j.fcr.2006.02.001
- Soukup, A., Armstrong, W., Schreiber, L., Franke, R., & Votrubová, O. (2007). Apoplastic barriers to radial oxygen loss and solute penetration: A chemical and functional comparison of the exodermis of two wetland species, Phragmites australis and Glyceria maxima. New Phytologist, 173(2), 264–278. https://doi.org/https://doi.org/10.1111/j.1469-8137.2006.01907.x
- Steffens, D., Hutsch, B., Eschholz, T., Losak, T., & Schubert, S. (2005). Waterlogging may inhibit plant growth primarily by nutrient deficiency rather than nutrient toxicity. Plant, Soil and Environment 51, 545–552. https://doi.org/https://doi.org/10.17221/3630-PSE
- Tester, M., & Davenport, R. (2003). Na+ tolerance and Na+ transport in higher plants. Annals of Botany, 91(5), 503–527. https://doi.org/https://doi.org/10.1093/aob/mcg058
- Thomson, C. J., Armstrong, W., Waters, I., & Greenway, H. (1990). Aerenchyma formation and associated oxygen movement in seminal and nodal roots of wheat. Plant, Cell & Environment, 13(4), 395–403. https://doi.org/https://doi.org/10.1111/j.1365-3040.1990.tb02144.x
- Thomson, C. J., Atwell, B. J., & Greenway, H. (1989). Response of wheat seedlings to low O2 concentrations in nutrient solution. Journal of Experimental Botany, 40(9), 993–999. https://doi.org/https://doi.org/10.1093/jxb/40.9.993
- Visser, E. J. W., Blom, C. W. P. M., & Voesenek, L. A. C. J. (1996). Flooding-induced adventitious rooting in Rumex: Morphology and development in an ecological perspective. Acta Botanica Neerlandica, 45(1), 17–28. https://doi.org/https://doi.org/10.1111/j.1438-8677.1996.tb00492.x
- Visser, E. J. W., & Bogemann, G. M. (2003). Measurement of porosity in very small samples of plant tissue. Plant and Soil, 253(1), 81–90. https://doi.org/https://doi.org/10.1023/A:1024560322835
- Watanabe, K., Nishiuchi, S., Kulichikhin, K., & Nakazono, M. (2013). Does suberin accumulation in plant roots contribute to waterlogging tolerance? Frontiers in Plant Science, 4(178), 1–7. https://doi.org/https://doi.org/10.3389/fpls.2013.00178
- Yabuno, T. The classification and geographical distribution of the genus Echinochloa.]. (1975). Journal of Weed Science and Technology, 20(3), 97–104. In Japanese with English title. https://doi.org/https://doi.org/10.3719/weed.20.97
- Yamauchi, T., Abe, F., Tsutsumi, N., & Nakazono, M. (2019). Root cortex provides a venue for gas-space formation and is essential for plant adaptation to waterlogging. Frontiers in Plant Science, 10, 259. https://doi.org/https://doi.org/10.3389/fpls.2019.00259
- Yamauchi, T., & Nakazono, M. Mechanisms of morphological adaptation of roots to waterlogging in gramineous plants.]. (2015). Root Research, 24(1), 23–35. In Japanese with English abstract. https://doi.org/https://doi.org/10.3117/rootres.24.23
- Zhang, J., & Davies, W. J. (1986). Chemical and hydraulic influences on the stomata of flooded plants. Journal of Experimental Botany, 37(10), 1479–1491. https://doi.org/https://doi.org/10.1093/jxb/37.10.1479